| Param | Original file | Final file |
|---|---|---|
| Filename | modeM0/AS1A09_029T03_9000005108_35686cztM0_level2.evt | modeM0/AS1A09_029T03_9000005108_35686cztM0_level2_quad_clean.evt |
| Size (bytes) | 426,067,200 | 67,049,280 |
| Size | 406.3 MB | 63.9 MB |
| Events in quadrant A | 2,567,917 | 437,520 |
| Events in quadrant B | 3,620,871 | 432,355 |
| Events in quadrant C | 2,920,468 | 415,040 |
| Events in quadrant D | 3,449,242 | 389,272 |
| Mode SS | |||
|---|---|---|---|
| Quadrant | BADHDUFLAG | Total packets | Discarded packets |
| A | 0 | 104 | 0 |
| B | 0 | 104 | 0 |
| C | 0 | 104 | 0 |
| D | 0 | 104 | 0 |
| Mode M9 | |||
|---|---|---|---|
| Quadrant | BADHDUFLAG | Total packets | Discarded packets |
| A | 0 | 21 | 0 |
| B | 0 | 21 | 0 |
| C | 0 | 21 | 0 |
| D | 0 | 21 | 0 |
| Mode M0 | |||
|---|---|---|---|
| Quadrant | BADHDUFLAG | Total packets | Discarded packets |
| A | 0 | 10811 | 1 |
| B | 0 | 13986 | 1 |
| C | 0 | 11734 | 1 |
| D | 0 | 13681 | 1 |
| Quadrant | Total seconds | Saturated seconds | Saturation percentage |
|---|---|---|---|
| A | 5074 | 4 | 0.078833% |
| B | 5074 | 354 | 6.976744% |
| C | 5074 | 111 | 2.187623% |
| D | 5074 | 255 | 5.025621% |
Noise dominated data is calculated using 1-second bins in cleaned event files. If a bin has >2000 counts, and if more than 50% of those come from <1% of pixels, then it is considered to be noise-dominated and hence unusable.
| Quadrant | # 1 sec bins | Bins with >0 counts | Bins with >2000 counts | High rate bins dominated by noise | Noise dominated (total time) | Noise dominated (detector-on time) | Marked lightcurve |
|---|---|---|---|---|---|---|---|
| A | 7197 | 5075 | 0 | 0 | 0.00% | 0.00% | 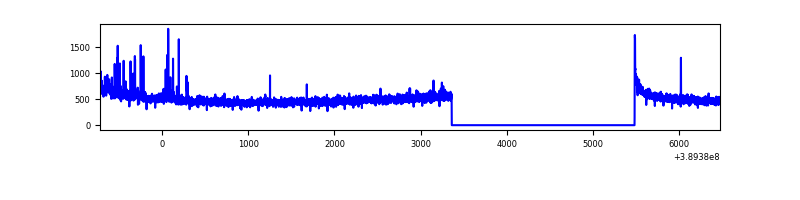 |
| B | 7197 | 5075 | 259 | 259 | 3.60% | 5.10% | 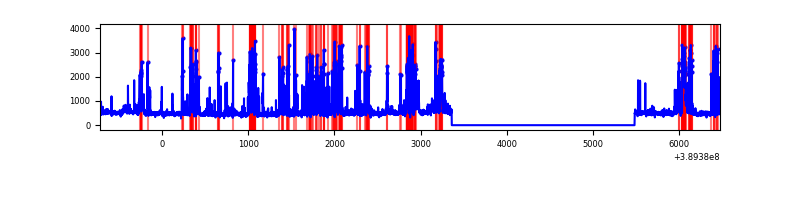 |
| C | 7197 | 5075 | 101 | 101 | 1.40% | 1.99% | 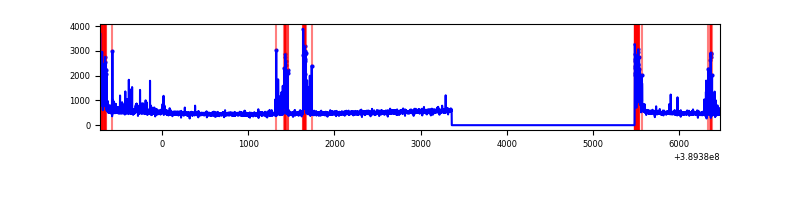 |
| D | 7197 | 5075 | 261 | 261 | 3.63% | 5.14% | 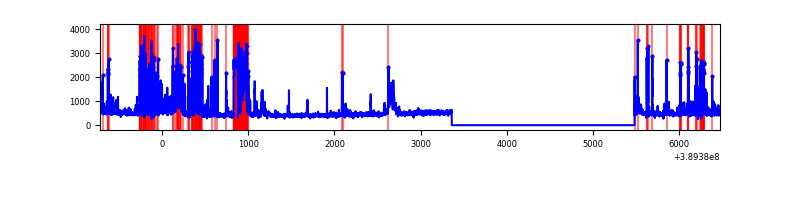 |
Top three noisy pixels from each quadrant. If the there are fewer than three noisy pixels in the level2.evt file, extra rows are filled as -1
| Pixel properties | Quadrant properties | ||||||
|---|---|---|---|---|---|---|---|
| Quadrant | DetID | PixID | Counts | Sigma | Mean | Median | Sigma |
| A | 10 | 83 | 124784 | 1016.74 | 608 | 598 | 122.1 |
| A | 15 | 169 | 50620 | 409.54 | 608 | 598 | 122.1 |
| A | 13 | 6 | 18827 | 149.25 | 608 | 598 | 122.1 |
| B | 5 | 172 | 907576 | 8094.35 | 589 | 574 | 112.1 |
| B | 5 | 255 | 314565 | 2802.15 | 589 | 574 | 112.1 |
| B | 5 | 31 | 26305 | 229.63 | 589 | 574 | 112.1 |
| C | 0 | 10 | 281863 | 2114.75 | 572 | 578 | 133.0 |
| C | 15 | 214 | 211864 | 1588.48 | 572 | 578 | 133.0 |
| C | 9 | 187 | 161674 | 1211.15 | 572 | 578 | 133.0 |
| D | 7 | 223 | 375797 | 2756.29 | 563 | 549 | 136.1 |
| D | 10 | 118 | 330454 | 2423.24 | 563 | 549 | 136.1 |
| D | 12 | 128 | 266680 | 1954.8 | 563 | 549 | 136.1 |
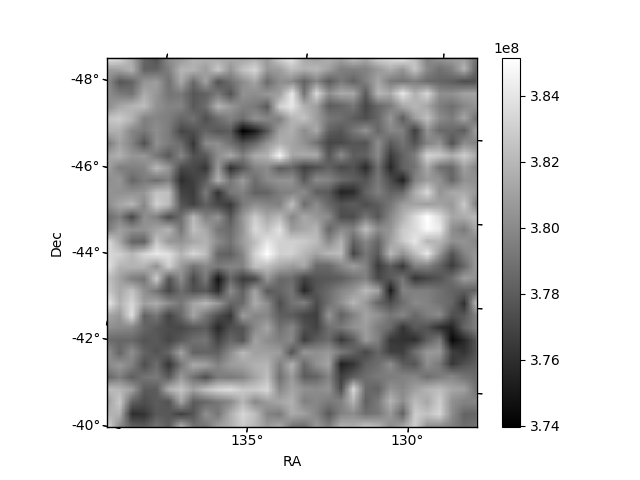
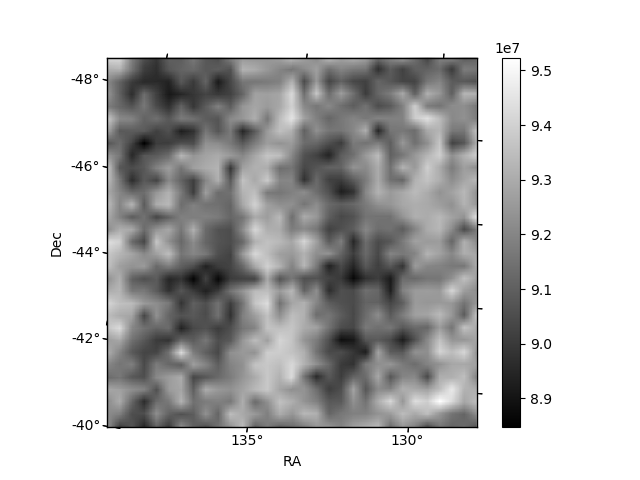
Histogram calculated using DETX and DETY for each event in the final _common_clean file
| Quadrant A | 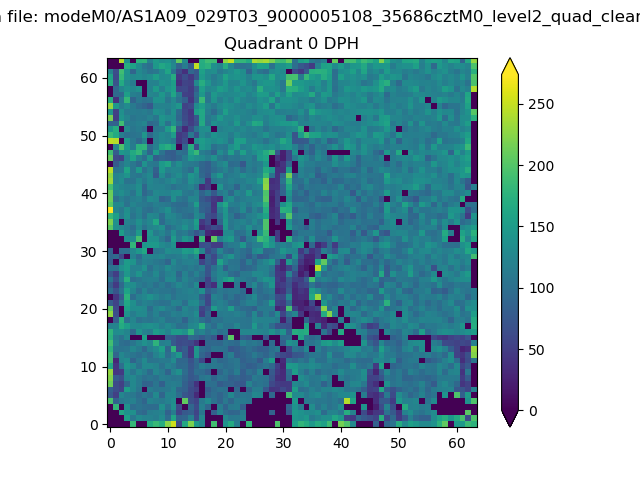 |
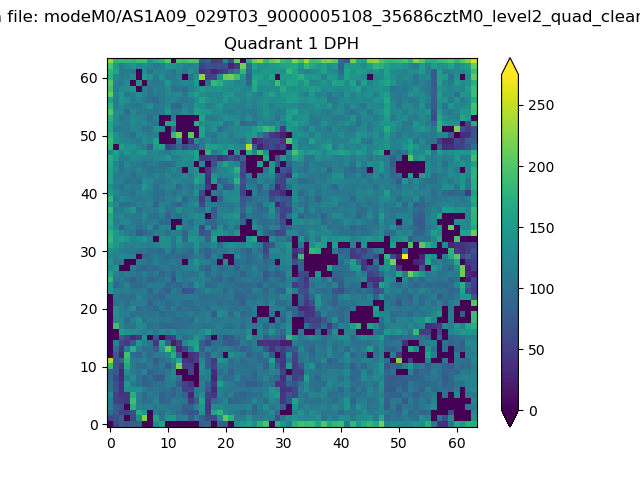 |
Quadrant B |
|---|---|---|---|
| Quadrant D | 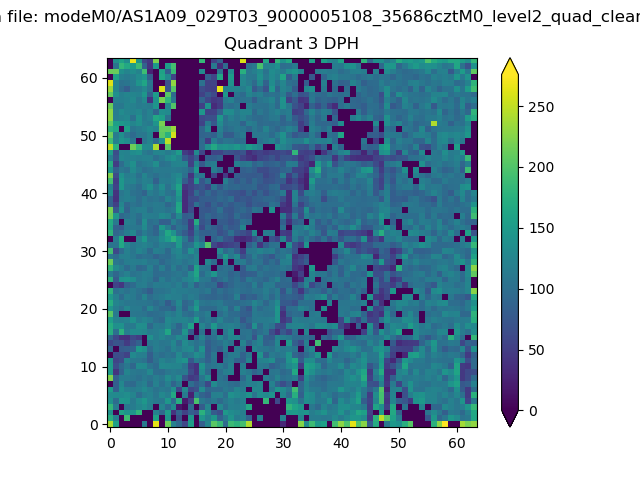 |
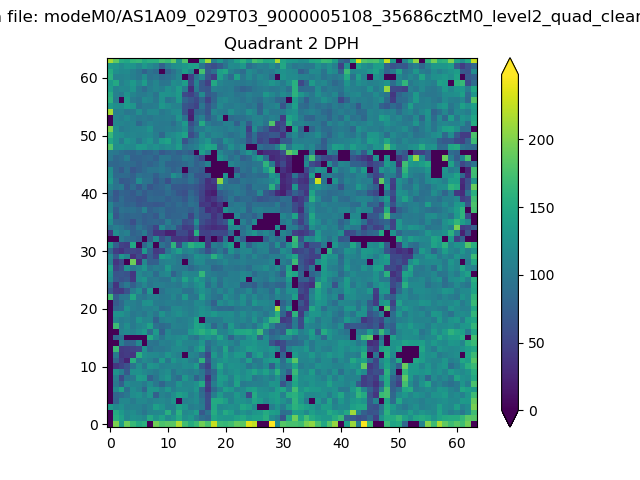 |
Quadrant C |
| Plot type | Count rate plots | Images |
|---|---|---|
| Comparison with Poisson distribution Blue bars denote a histogram of data divided into 1 sec bins. Red curve is a Poisson curve with rate = median count rate of data. |
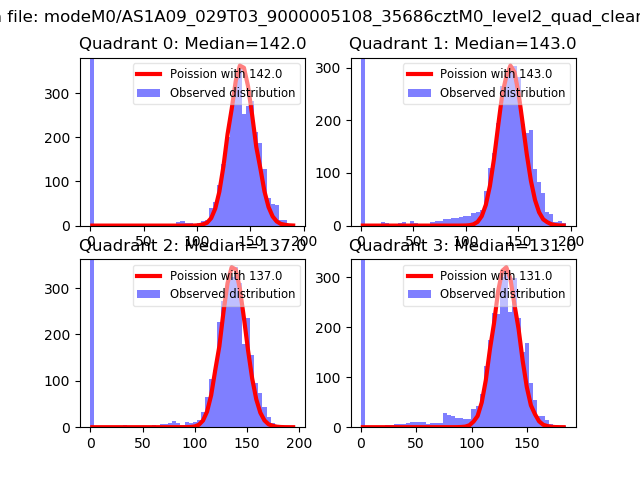 |
 |
| Quadrant-wise count rates Data is divided into 100 sec bins |
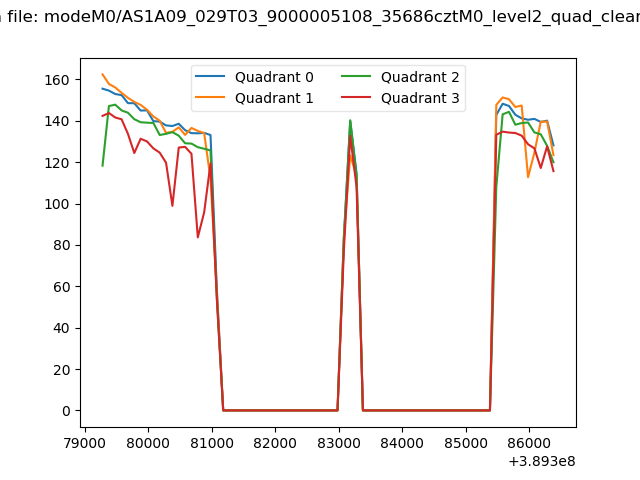 |
|
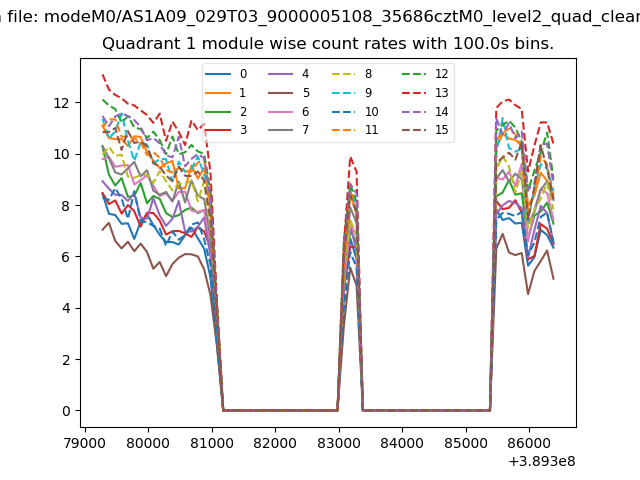
| Module-wise count rates for Quadrant A Data is divided into 100 sec bins |
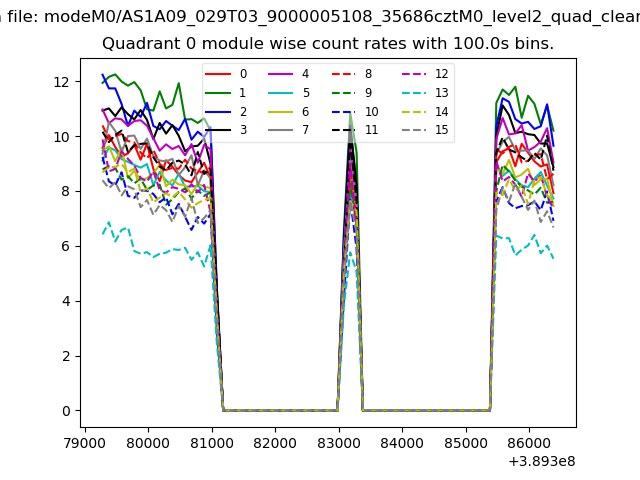 |
 |
| Module-wise count rates for Quadrant B Data is divided into 100 sec bins |
 |
 |
| Module-wise count rates for Quadrant C Data is divided into 100 sec bins |
 |
 |
| Module-wise count rates for Quadrant D Data is divided into 100 sec bins |
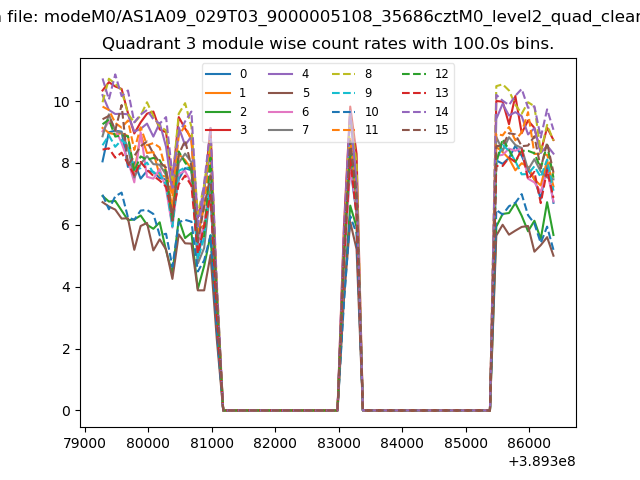 |
 |
| Parameter | Plot |
|---|---|
| CZT HV Monitor | 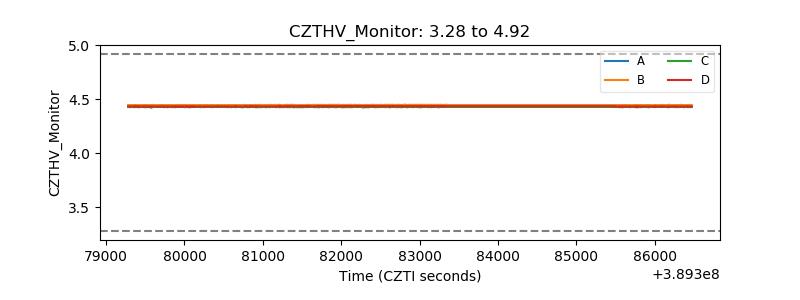 |
| D_VDD | 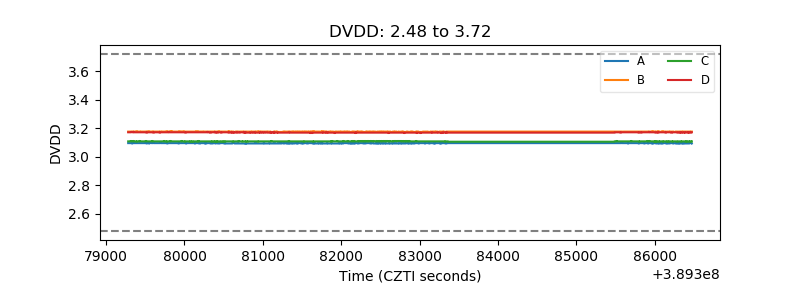 |
| Temperature 1 |  |
| Veto HV Monitor |  |
| Veto LLD | 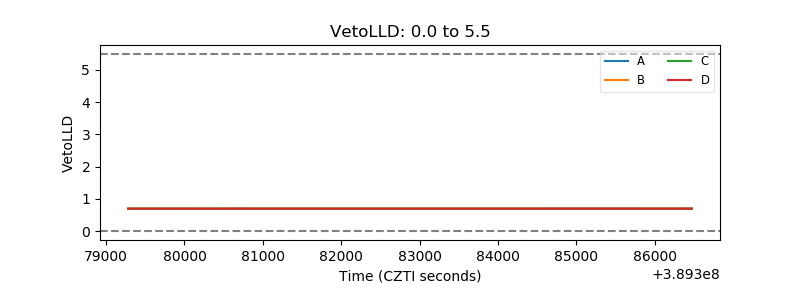 |
| Alpha Counter | 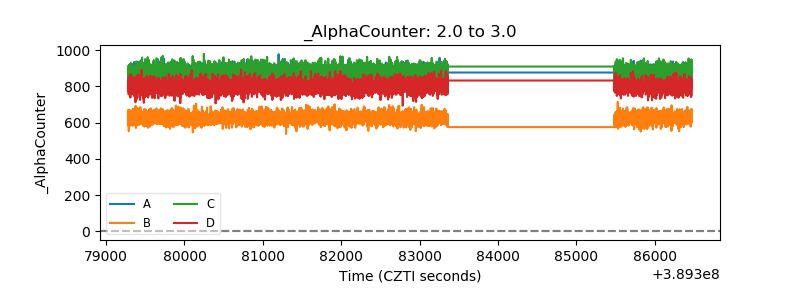 |
| _CPM_Rate | 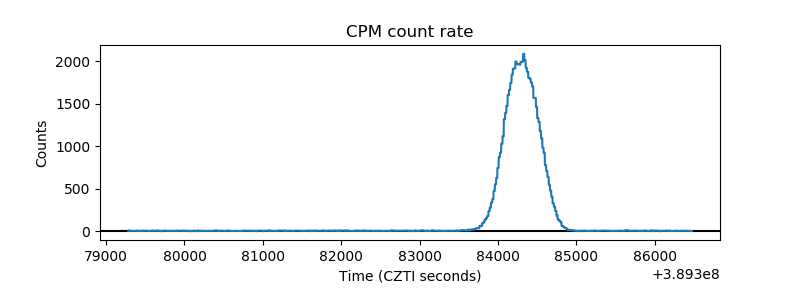 |
| CZT Counter | 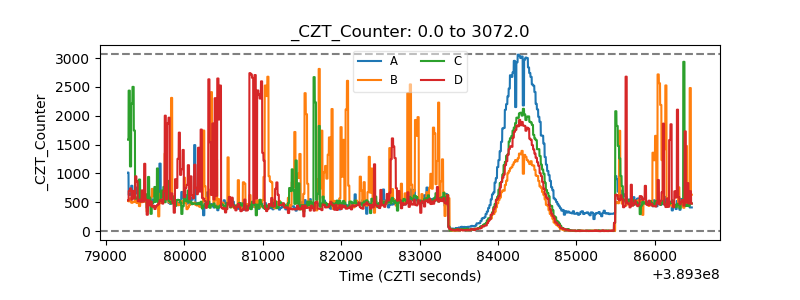 |
| +2.5 Volts monitor | 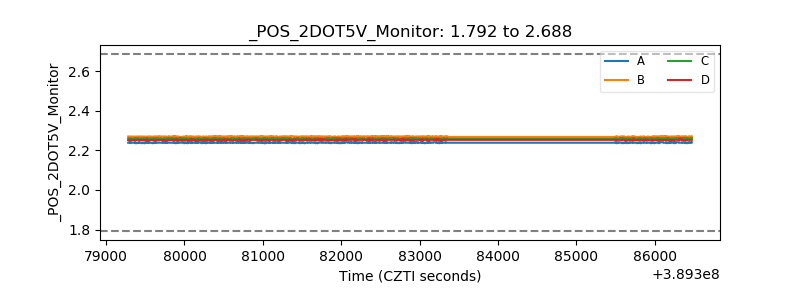 |
| +5 Volts monitor | 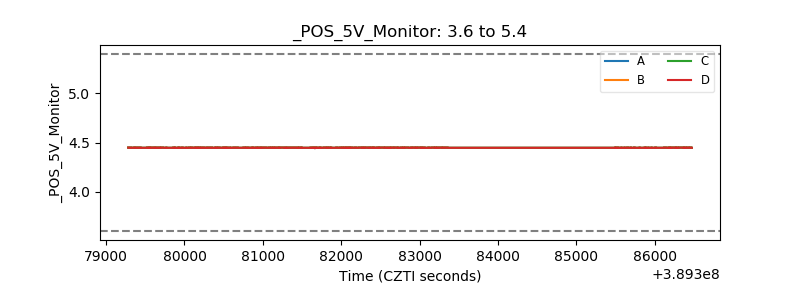 |
| _ROLL_ROT | 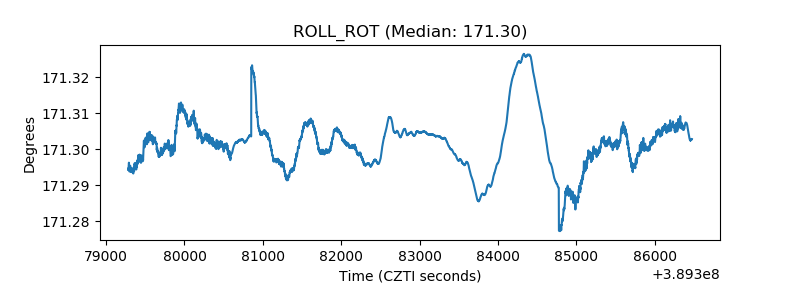 |
| _Roll_DEC | 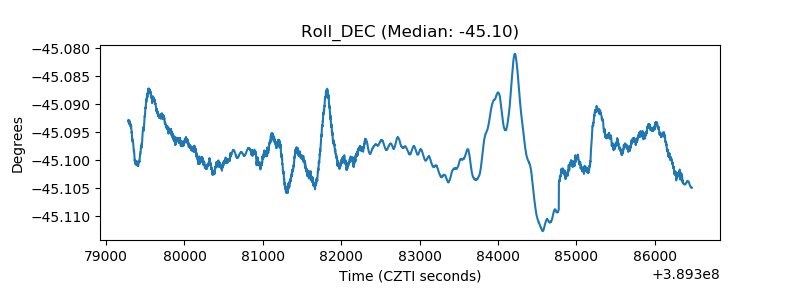 |
| _Roll_RA | 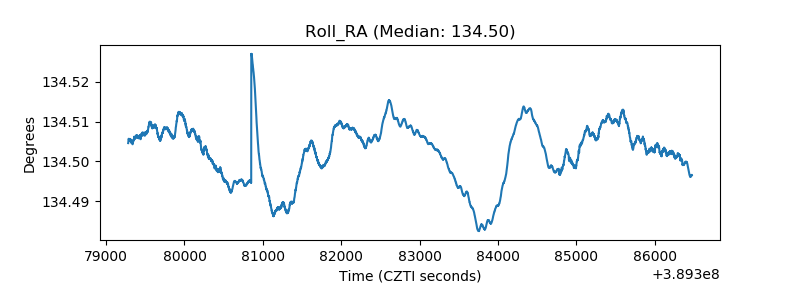 |
| Veto Counter | 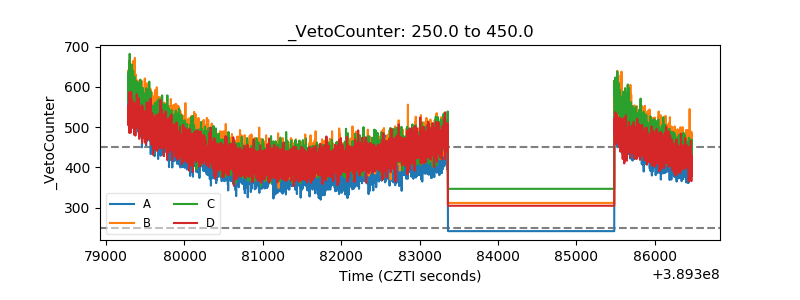 |