| Param | Original file | Final file |
|---|---|---|
| Filename | modeM0/AS1A09_029T03_9000005108_35682cztM0_level2.evt | modeM0/AS1A09_029T03_9000005108_35682cztM0_level2_quad_clean.evt |
| Size (bytes) | 436,037,760 | 68,339,520 |
| Size | 415.8 MB | 65.2 MB |
| Events in quadrant A | 2,632,815 | 447,726 |
| Events in quadrant B | 3,658,049 | 443,227 |
| Events in quadrant C | 3,071,870 | 419,257 |
| Events in quadrant D | 3,493,368 | 398,691 |
| Mode SS | |||
|---|---|---|---|
| Quadrant | BADHDUFLAG | Total packets | Discarded packets |
| A | 0 | 106 | 0 |
| B | 0 | 106 | 0 |
| C | 0 | 106 | 0 |
| D | 0 | 106 | 2 |
| Mode M9 | |||
|---|---|---|---|
| Quadrant | BADHDUFLAG | Total packets | Discarded packets |
| A | 0 | 29 | 0 |
| B | 0 | 29 | 0 |
| C | 0 | 29 | 0 |
| D | 0 | 30 | 0 |
| Mode M0 | |||
|---|---|---|---|
| Quadrant | BADHDUFLAG | Total packets | Discarded packets |
| A | 0 | 11049 | 2 |
| B | 0 | 14132 | 2 |
| C | 0 | 12227 | 2 |
| D | 0 | 13853 | 2 |
| Quadrant | Total seconds | Saturated seconds | Saturation percentage |
|---|---|---|---|
| A | 5138 | 8 | 0.155703% |
| B | 5138 | 355 | 6.909303% |
| C | 5138 | 168 | 3.269755% |
| D | 5138 | 256 | 4.982483% |
Noise dominated data is calculated using 1-second bins in cleaned event files. If a bin has >2000 counts, and if more than 50% of those come from <1% of pixels, then it is considered to be noise-dominated and hence unusable.
| Quadrant | # 1 sec bins | Bins with >0 counts | Bins with >2000 counts | High rate bins dominated by noise | Noise dominated (total time) | Noise dominated (detector-on time) | Marked lightcurve |
|---|---|---|---|---|---|---|---|
| A | 7261 | 5139 | 0 | 0 | 0.00% | 0.00% | 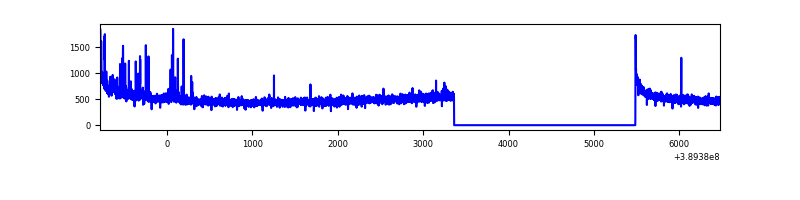 |
| B | 7261 | 5139 | 259 | 259 | 3.57% | 5.04% | 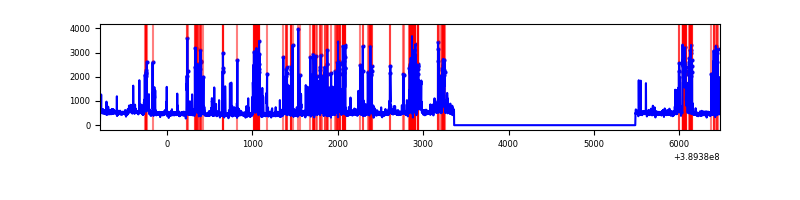 |
| C | 7261 | 5139 | 149 | 149 | 2.05% | 2.90% | 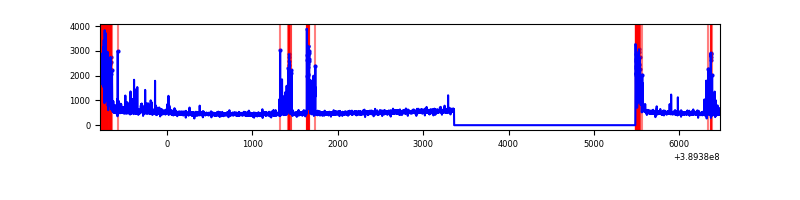 |
| D | 7261 | 5139 | 261 | 261 | 3.59% | 5.08% | 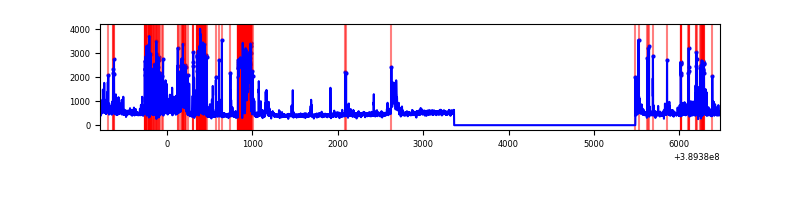 |
Top three noisy pixels from each quadrant. If the there are fewer than three noisy pixels in the level2.evt file, extra rows are filled as -1
| Pixel properties | Quadrant properties | ||||||
|---|---|---|---|---|---|---|---|
| Quadrant | DetID | PixID | Counts | Sigma | Mean | Median | Sigma |
| A | 10 | 83 | 146443 | 1177.33 | 617 | 606 | 123.9 |
| A | 15 | 169 | 57338 | 457.99 | 617 | 606 | 123.9 |
| A | 13 | 6 | 19269 | 150.66 | 617 | 606 | 123.9 |
| B | 5 | 172 | 907597 | 7948.76 | 598 | 582 | 114.1 |
| B | 5 | 255 | 317568 | 2777.95 | 598 | 582 | 114.1 |
| B | 5 | 31 | 26322 | 225.58 | 598 | 582 | 114.1 |
| C | 0 | 10 | 410378 | 3062.04 | 576 | 582 | 133.8 |
| C | 15 | 214 | 213534 | 1591.2 | 576 | 582 | 133.8 |
| C | 9 | 187 | 168022 | 1251.13 | 576 | 582 | 133.8 |
| D | 7 | 223 | 375832 | 2705.58 | 572 | 557 | 138.7 |
| D | 10 | 118 | 330482 | 2378.62 | 572 | 557 | 138.7 |
| D | 12 | 128 | 266691 | 1918.71 | 572 | 557 | 138.7 |
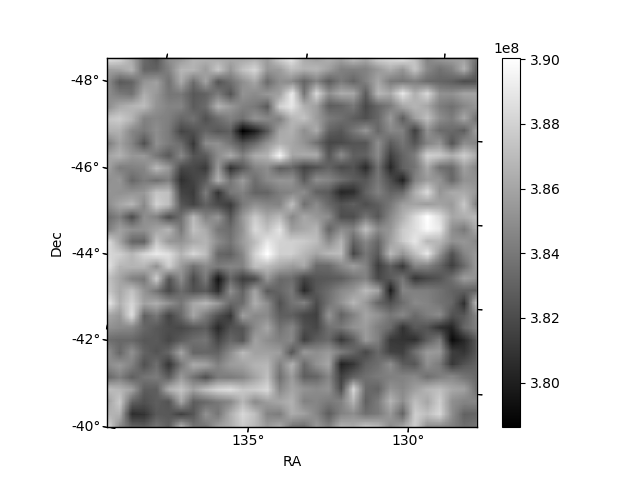
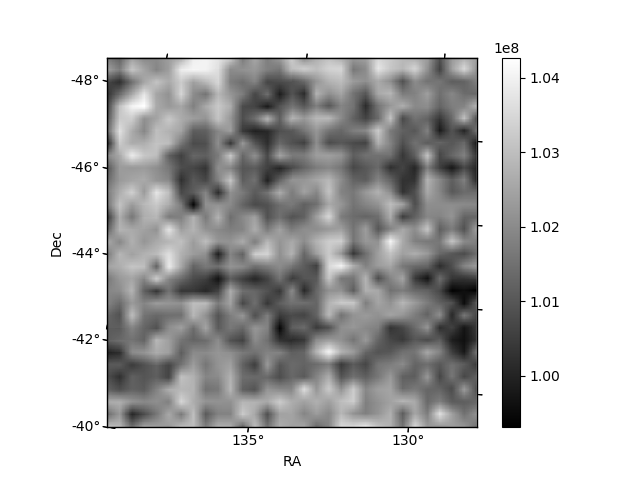
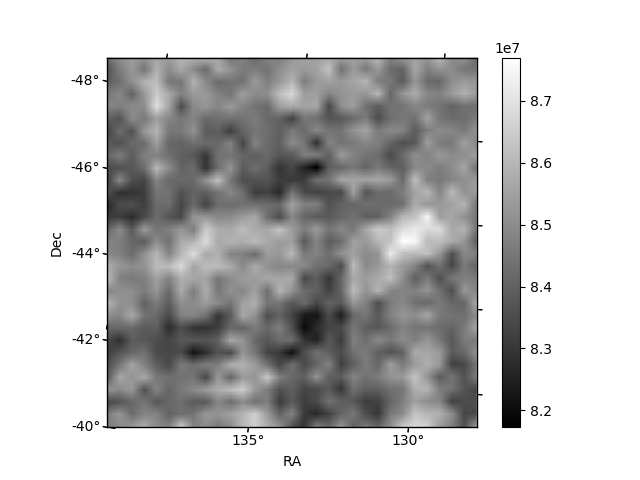
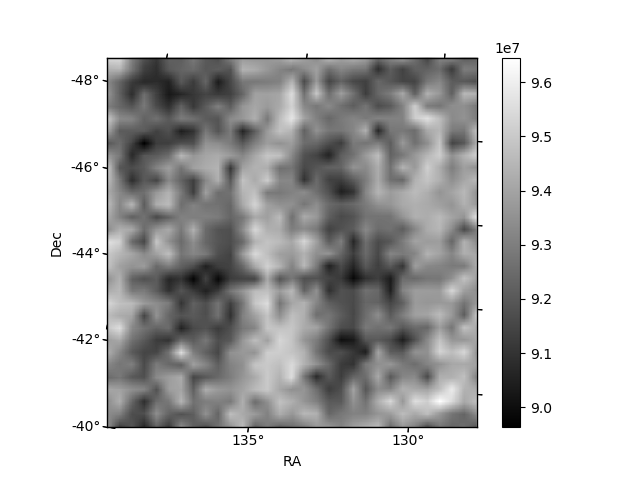
Histogram calculated using DETX and DETY for each event in the final _common_clean file
| Quadrant A | 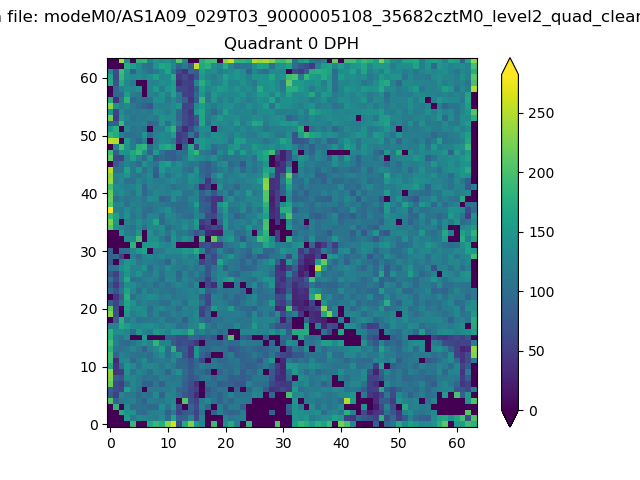 |
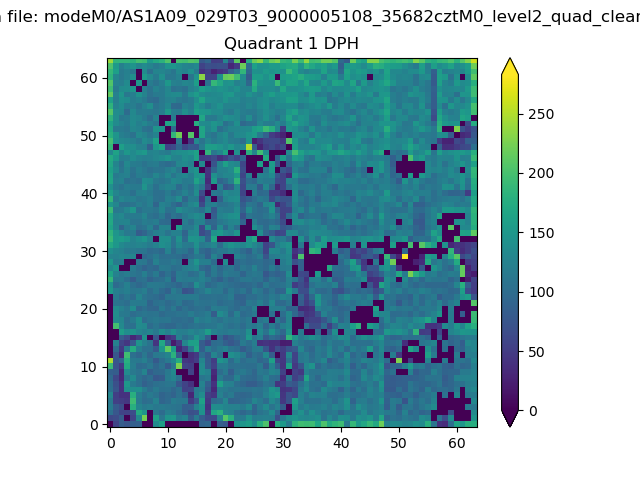 |
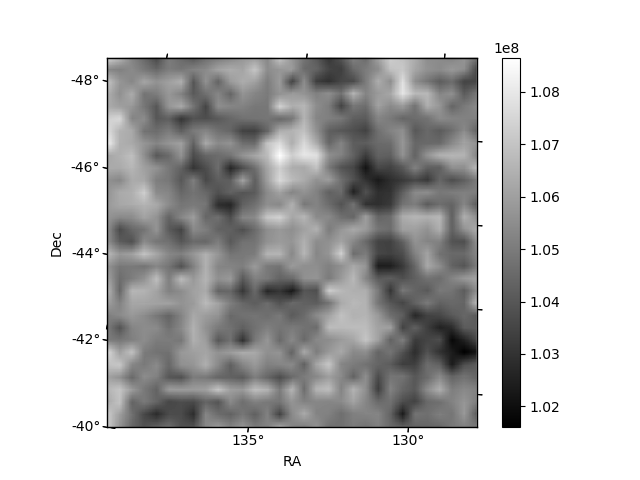
Quadrant B |
|---|---|---|---|
| Quadrant D | 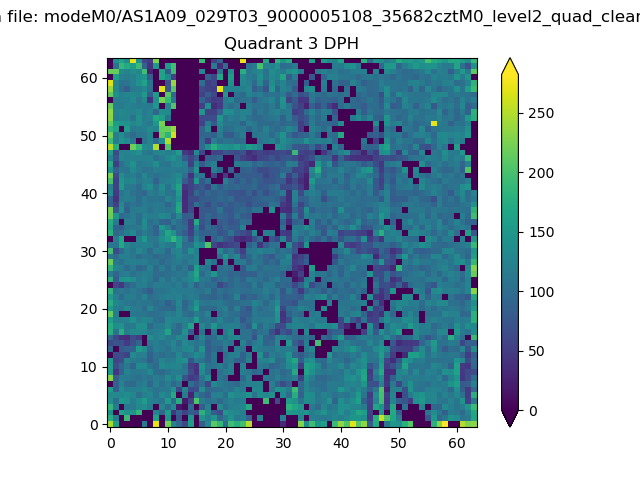 |
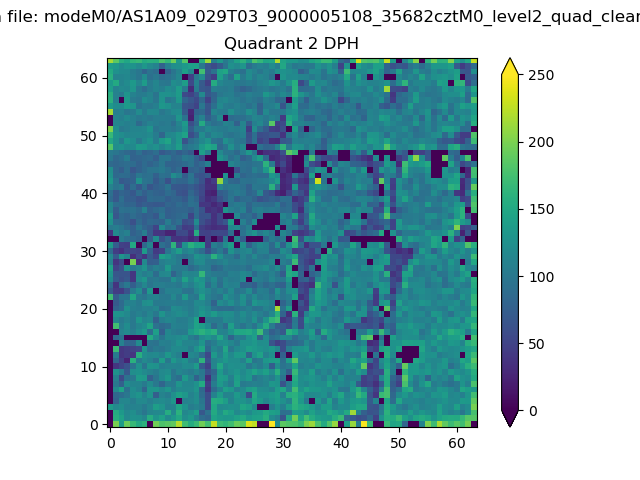 |
Quadrant C |
| Plot type | Count rate plots | Images |
|---|---|---|
| Comparison with Poisson distribution Blue bars denote a histogram of data divided into 1 sec bins. Red curve is a Poisson curve with rate = median count rate of data. |
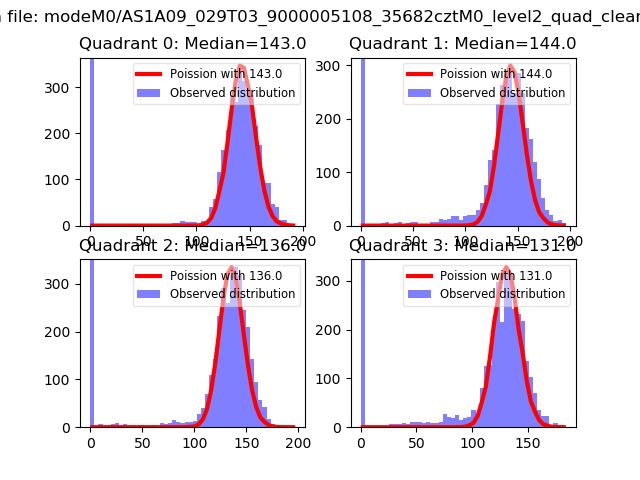 |
 |
| Quadrant-wise count rates Data is divided into 100 sec bins |
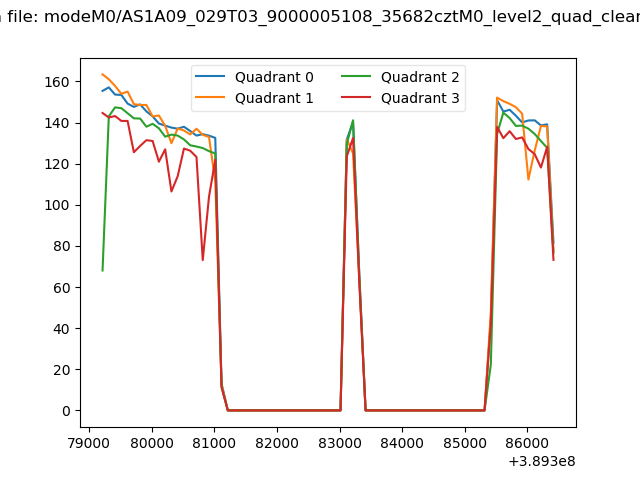 |
|
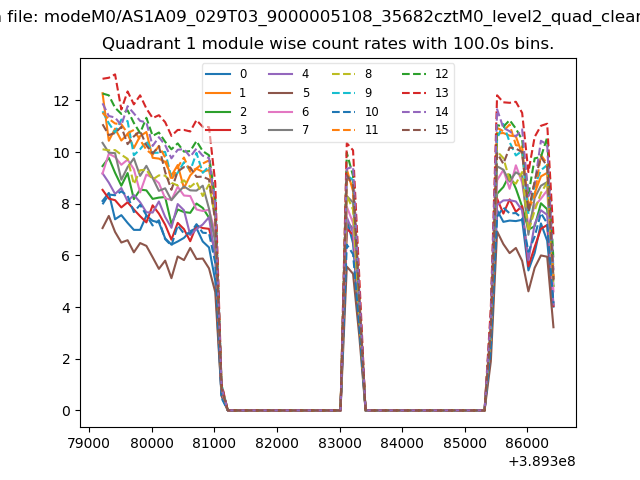
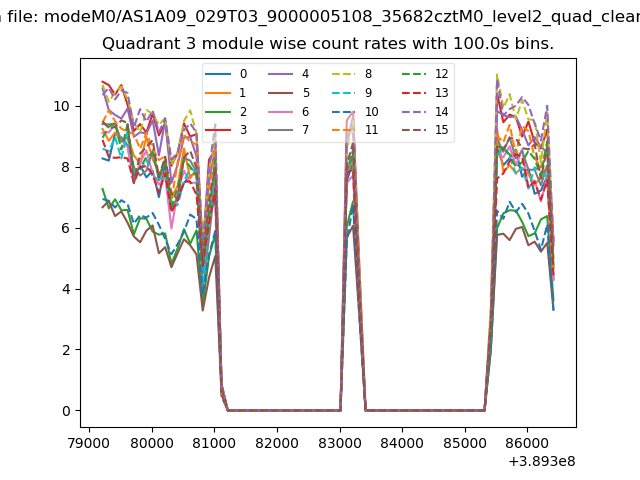
| Module-wise count rates for Quadrant A Data is divided into 100 sec bins |
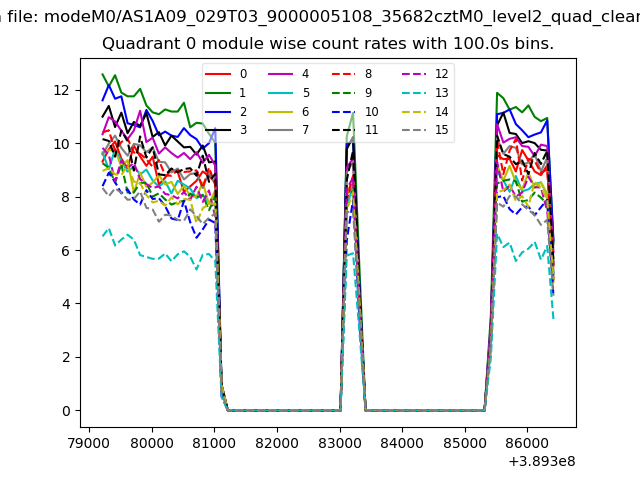 |
 |
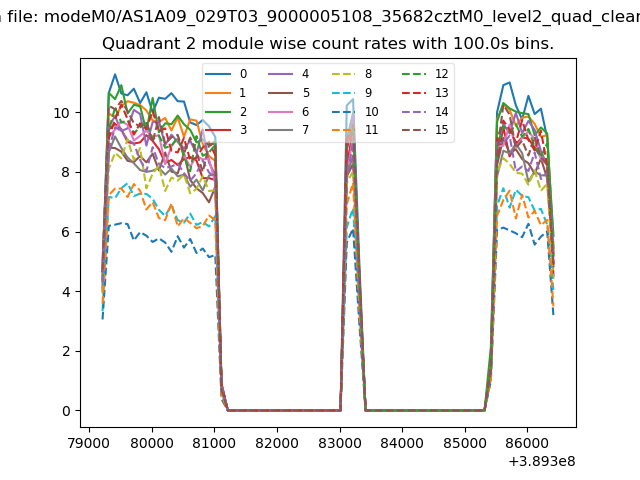
| Module-wise count rates for Quadrant B Data is divided into 100 sec bins |
 |
 |
| Module-wise count rates for Quadrant C Data is divided into 100 sec bins |
 |
 |
| Module-wise count rates for Quadrant D Data is divided into 100 sec bins |
 |
 |
| Parameter | Plot |
|---|---|
| CZT HV Monitor | 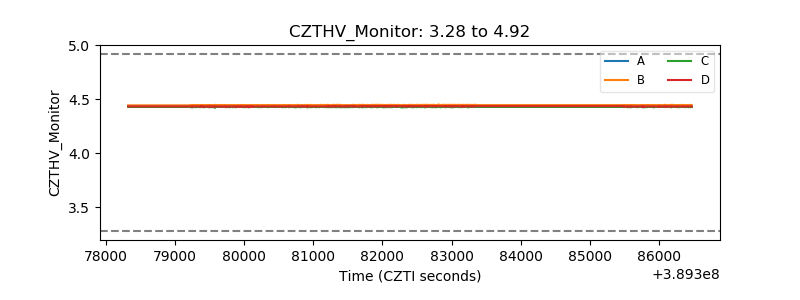 |
| D_VDD | 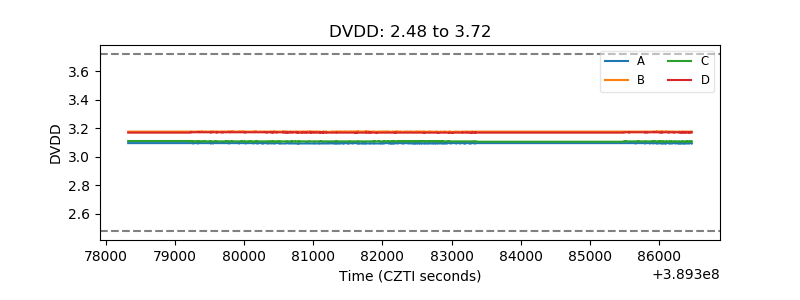 |
| Temperature 1 | 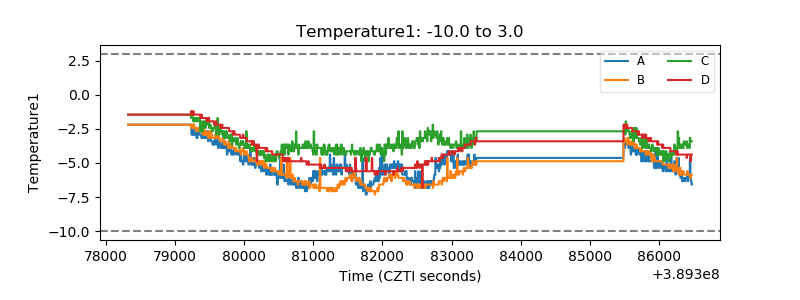 |
| Veto HV Monitor | 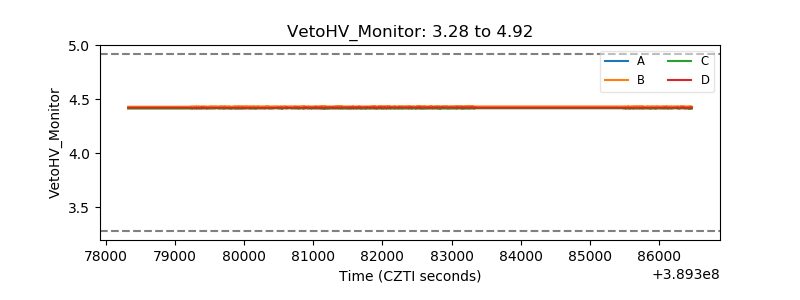 |
| Veto LLD | 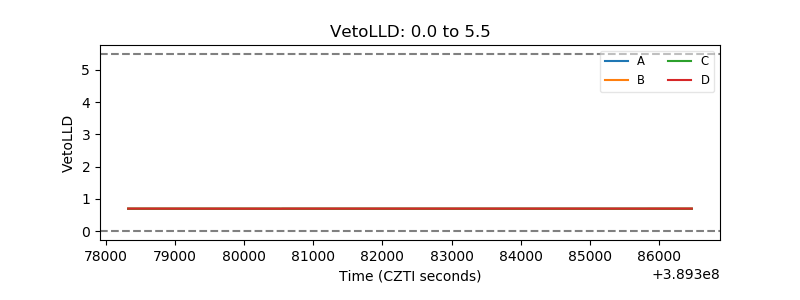 |
| Alpha Counter | 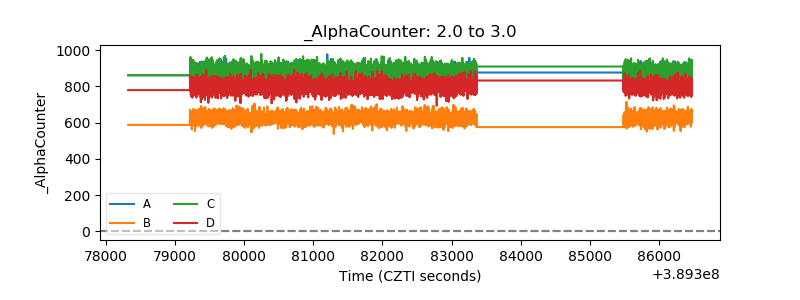 |
| _CPM_Rate | 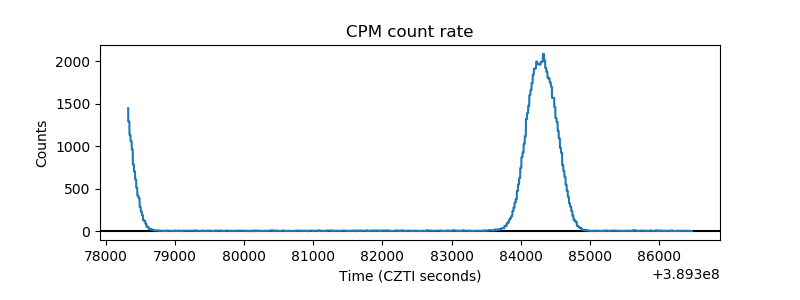 |
| CZT Counter | 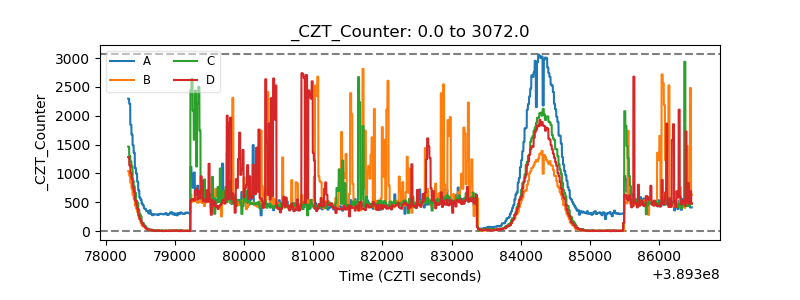 |
| +2.5 Volts monitor | 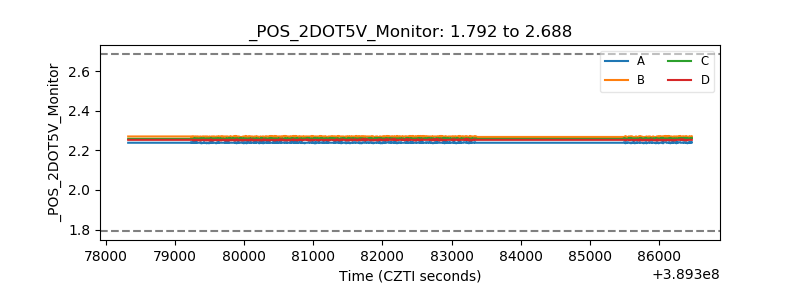 |
| +5 Volts monitor | 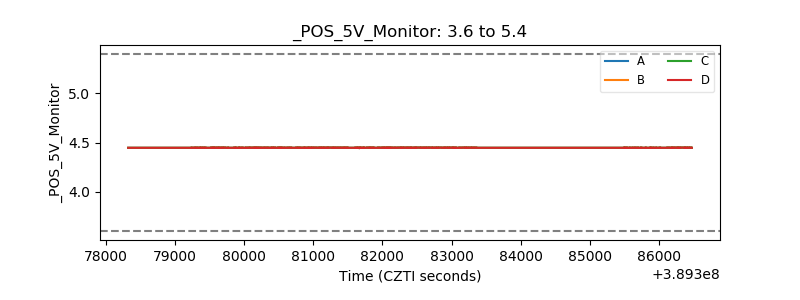 |
| _ROLL_ROT | 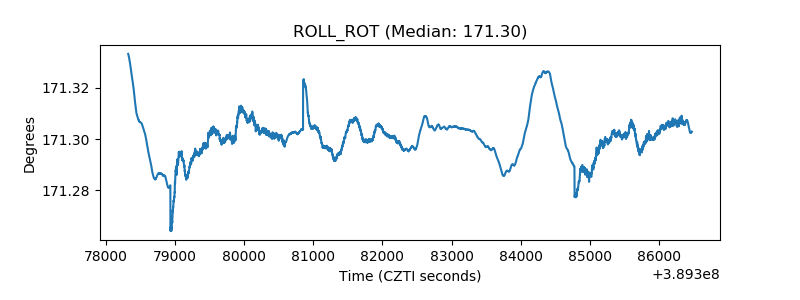 |
| _Roll_DEC | 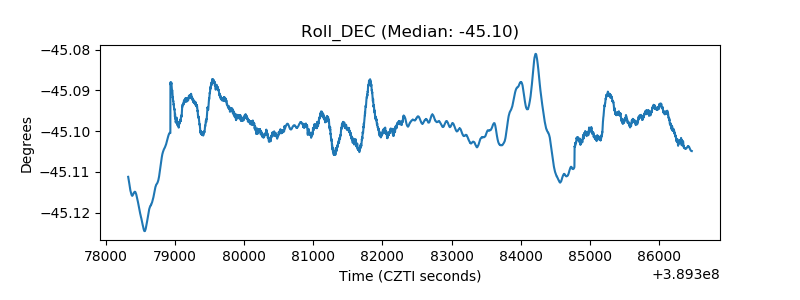 |
| _Roll_RA | 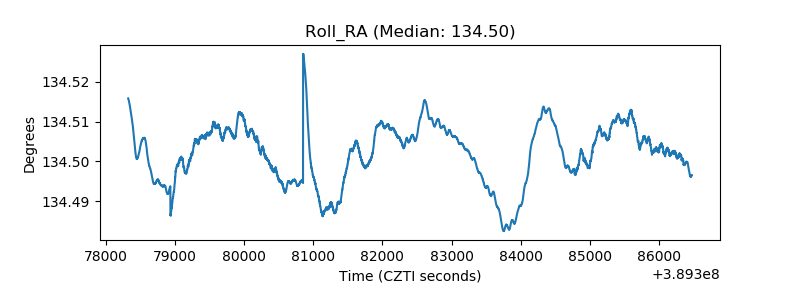 |
| Veto Counter | 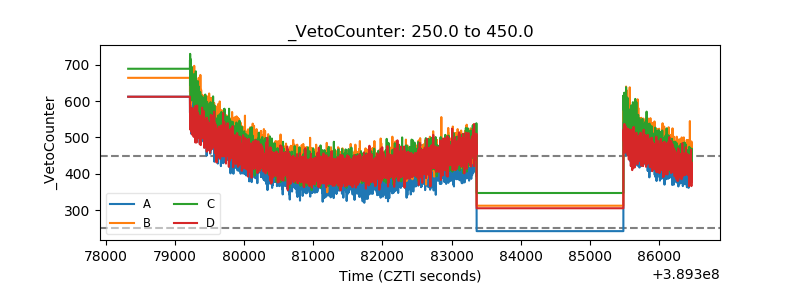 |