| Param | Original file | Final file |
|---|---|---|
| Filename | modeM0/AS1A09_029T03_9000005108_35681cztM0_level2.evt | modeM0/AS1A09_029T03_9000005108_35681cztM0_level2_quad_clean.evt |
| Size (bytes) | 439,715,520 | 71,945,280 |
| Size | 419.3 MB | 68.6 MB |
| Events in quadrant A | 2,716,189 | 473,729 |
| Events in quadrant B | 4,130,096 | 472,103 |
| Events in quadrant C | 3,073,543 | 434,167 |
| Events in quadrant D | 3,047,116 | 437,519 |
| Mode SS | |||
|---|---|---|---|
| Quadrant | BADHDUFLAG | Total packets | Discarded packets |
| A | 0 | 106 | 0 |
| B | 0 | 106 | 0 |
| C | 0 | 106 | 0 |
| D | 0 | 106 | 0 |
| Mode M9 | |||
|---|---|---|---|
| Quadrant | BADHDUFLAG | Total packets | Discarded packets |
| A | 0 | 23 | 0 |
| B | 0 | 23 | 0 |
| C | 0 | 23 | 0 |
| D | 0 | 24 | 0 |
| Mode M0 | |||
|---|---|---|---|
| Quadrant | BADHDUFLAG | Total packets | Discarded packets |
| A | 0 | 11234 | 3 |
| B | 0 | 15605 | 2 |
| C | 0 | 12201 | 2 |
| D | 0 | 12553 | 2 |
| Quadrant | Total seconds | Saturated seconds | Saturation percentage |
|---|---|---|---|
| A | 5147 | 9 | 0.174859% |
| B | 5147 | 554 | 10.763552% |
| C | 5147 | 205 | 3.982903% |
| D | 5147 | 104 | 2.020595% |
Noise dominated data is calculated using 1-second bins in cleaned event files. If a bin has >2000 counts, and if more than 50% of those come from <1% of pixels, then it is considered to be noise-dominated and hence unusable.
| Quadrant | # 1 sec bins | Bins with >0 counts | Bins with >2000 counts | High rate bins dominated by noise | Noise dominated (total time) | Noise dominated (detector-on time) | Marked lightcurve |
|---|---|---|---|---|---|---|---|
| A | 7210 | 5148 | 0 | 0 | 0.00% | 0.00% | 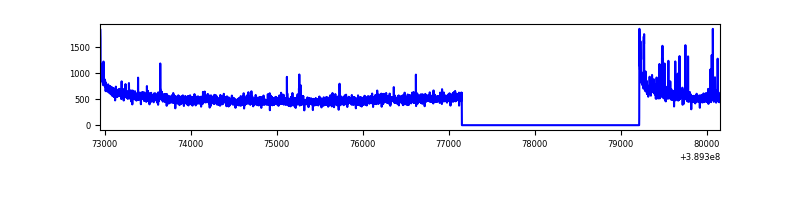 |
| B | 7210 | 5148 | 424 | 424 | 5.88% | 8.24% | 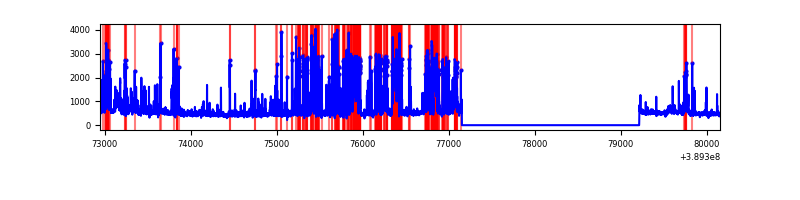 |
| C | 7210 | 5148 | 180 | 180 | 2.50% | 3.50% | 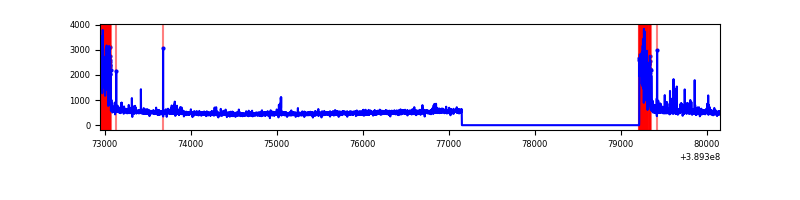 |
| D | 7210 | 5148 | 97 | 97 | 1.35% | 1.88% | 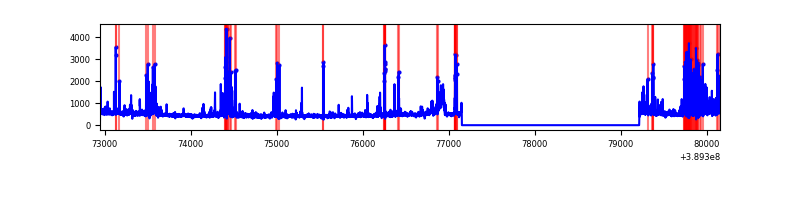 |
Top three noisy pixels from each quadrant. If the there are fewer than three noisy pixels in the level2.evt file, extra rows are filled as -1
| Pixel properties | Quadrant properties | ||||||
|---|---|---|---|---|---|---|---|
| Quadrant | DetID | PixID | Counts | Sigma | Mean | Median | Sigma |
| A | 10 | 83 | 147809 | 1168.66 | 627 | 616 | 126.0 |
| A | 15 | 169 | 111399 | 879.58 | 627 | 616 | 126.0 |
| A | 7 | 3 | 13412 | 101.6 | 627 | 616 | 126.0 |
| B | 5 | 172 | 1388625 | 12192.71 | 592 | 577 | 113.8 |
| B | 5 | 255 | 186763 | 1635.47 | 592 | 577 | 113.8 |
| B | 4 | 81 | 135905 | 1188.73 | 592 | 577 | 113.8 |
| C | 0 | 10 | 579345 | 4335.18 | 576 | 581 | 133.5 |
| C | 15 | 214 | 212715 | 1588.97 | 576 | 581 | 133.5 |
| C | 9 | 187 | 26937 | 197.42 | 576 | 581 | 133.5 |
| D | 12 | 128 | 233302 | 1610.35 | 591 | 573 | 144.5 |
| D | 13 | 249 | 176728 | 1218.89 | 591 | 573 | 144.5 |
| D | 2 | 153 | 153670 | 1059.34 | 591 | 573 | 144.5 |
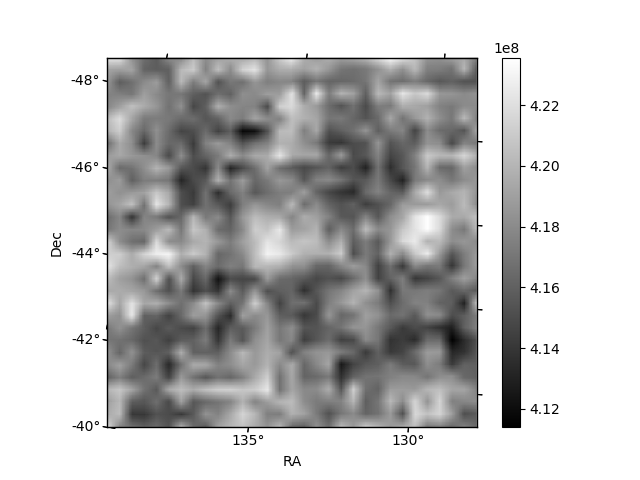
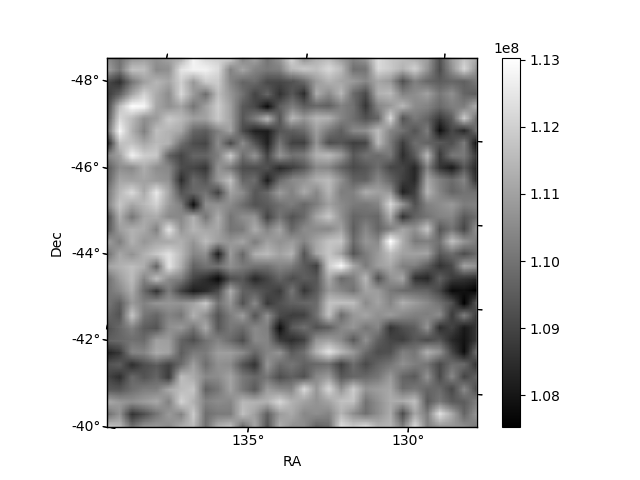
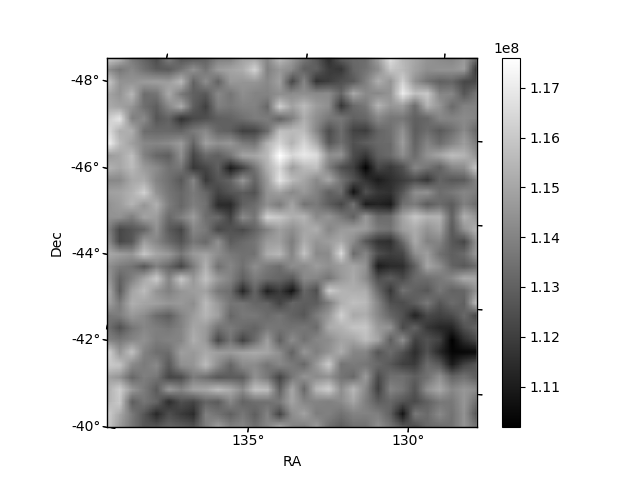
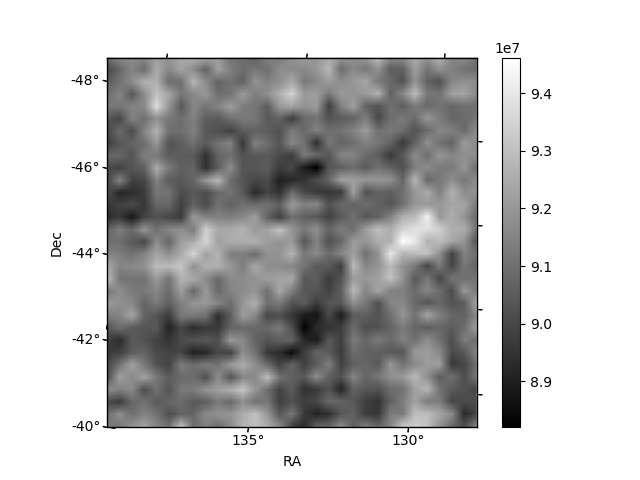
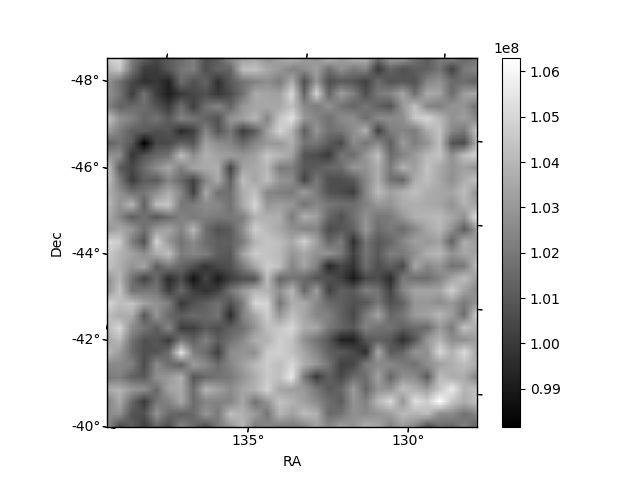
Histogram calculated using DETX and DETY for each event in the final _common_clean file
| Quadrant A | 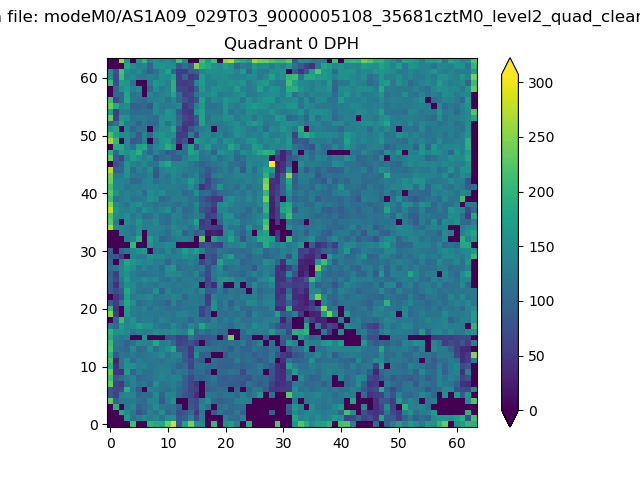 |
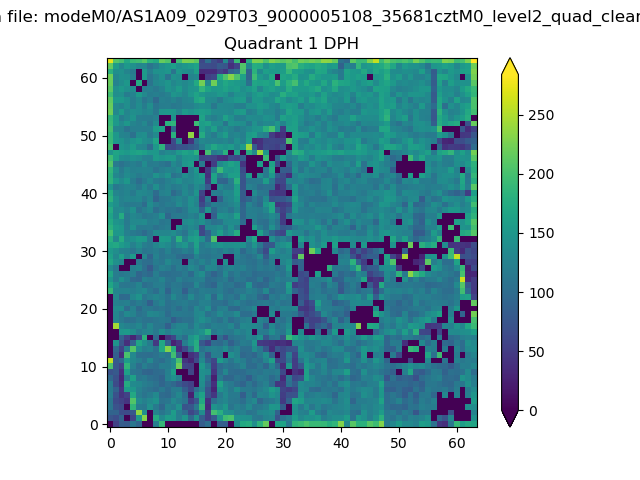 |
Quadrant B |
|---|---|---|---|
| Quadrant D | 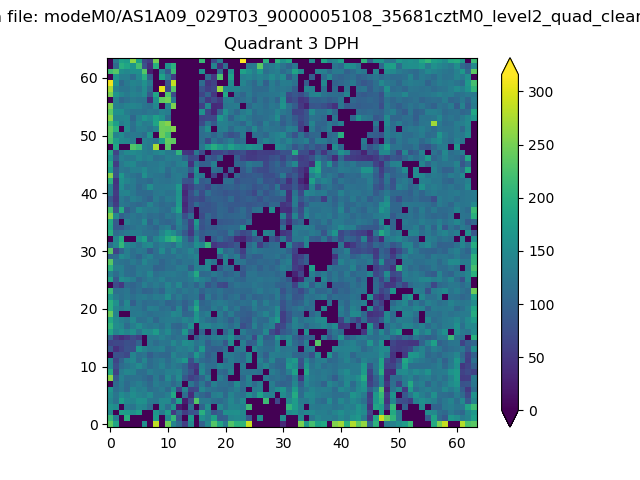 |
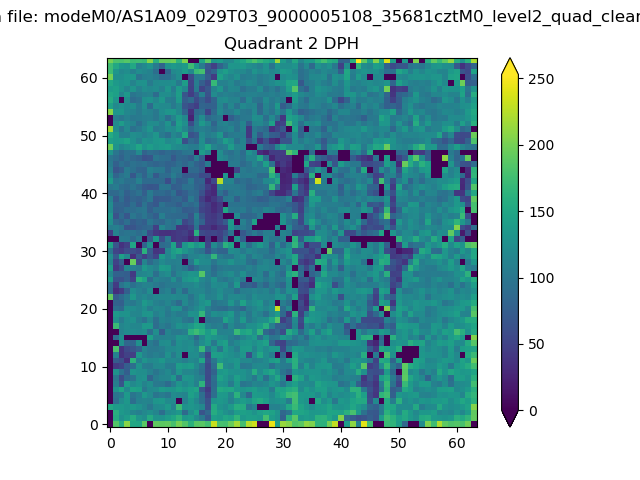 |
Quadrant C |
| Plot type | Count rate plots | Images |
|---|---|---|
| Comparison with Poisson distribution Blue bars denote a histogram of data divided into 1 sec bins. Red curve is a Poisson curve with rate = median count rate of data. |
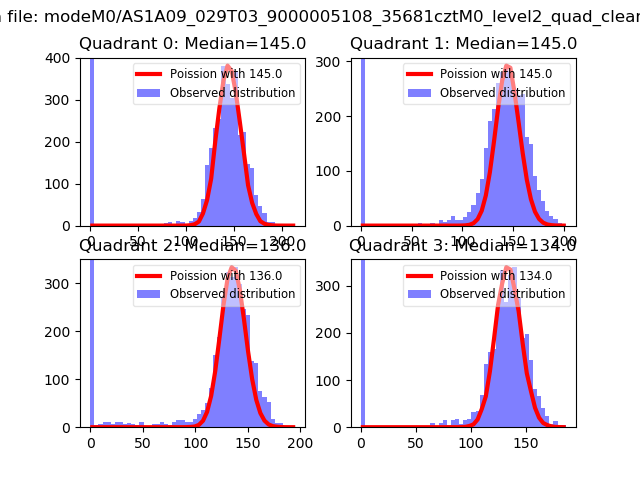 |
 |
| Quadrant-wise count rates Data is divided into 100 sec bins |
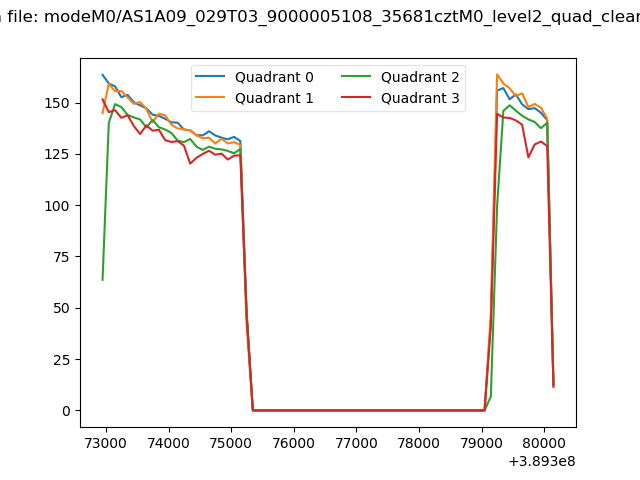 |
|
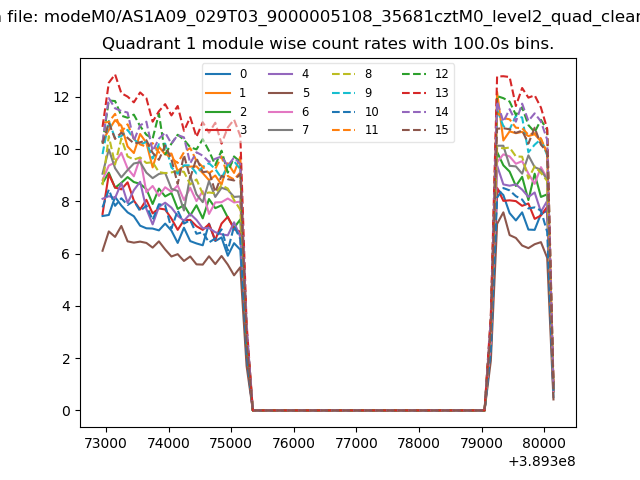
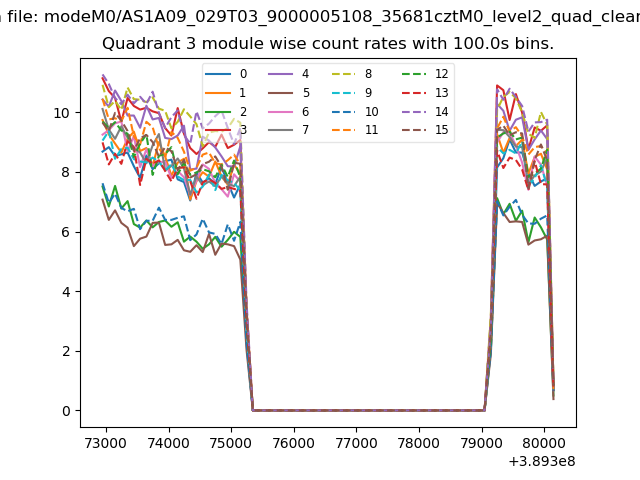
| Module-wise count rates for Quadrant A Data is divided into 100 sec bins |
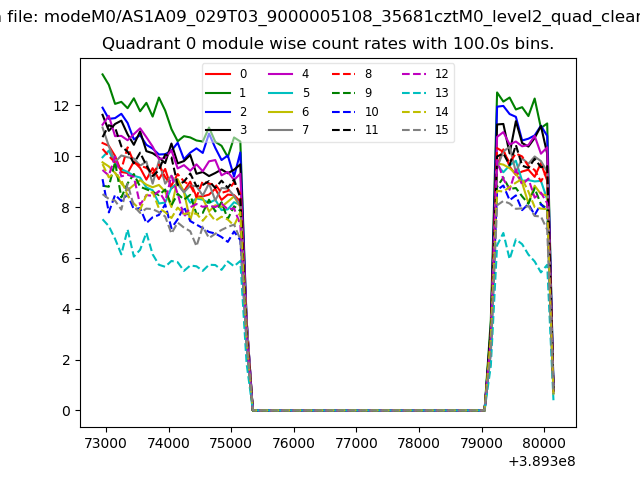 |
 |
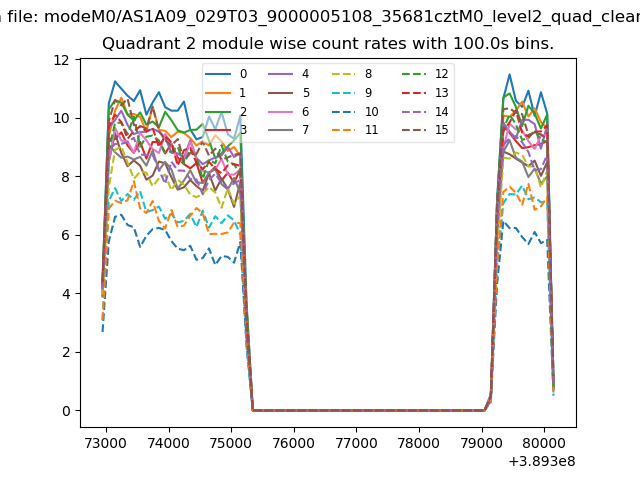
| Module-wise count rates for Quadrant B Data is divided into 100 sec bins |
 |
 |
| Module-wise count rates for Quadrant C Data is divided into 100 sec bins |
 |
 |
| Module-wise count rates for Quadrant D Data is divided into 100 sec bins |
 |
 |
| Parameter | Plot |
|---|---|
| CZT HV Monitor |  |
| D_VDD | 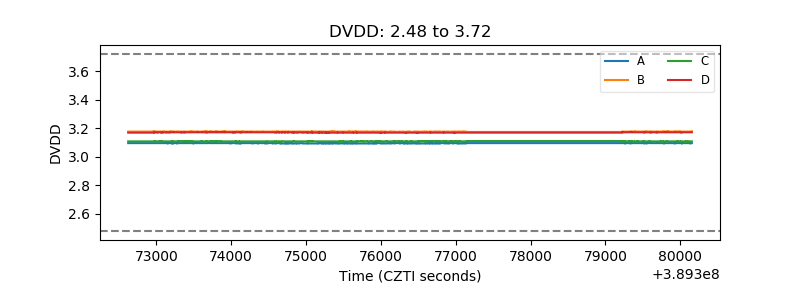 |
| Temperature 1 | 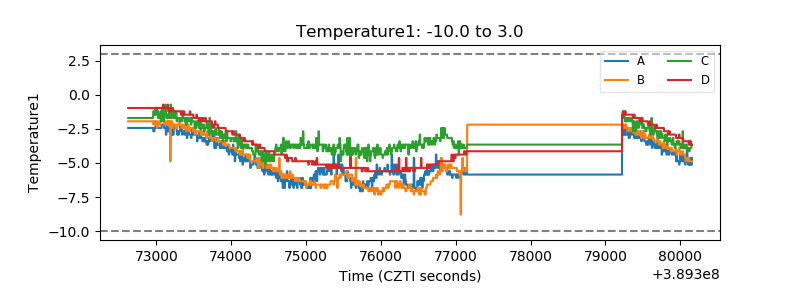 |
| Veto HV Monitor | 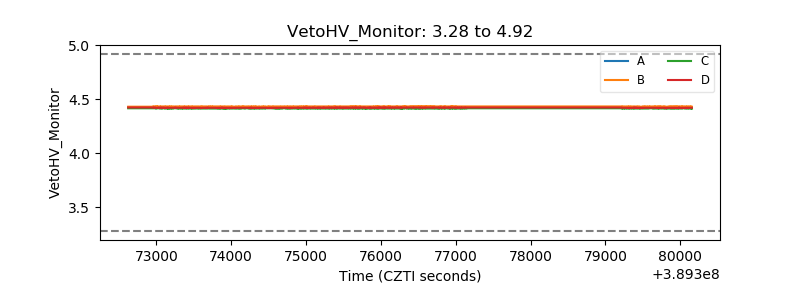 |
| Veto LLD | 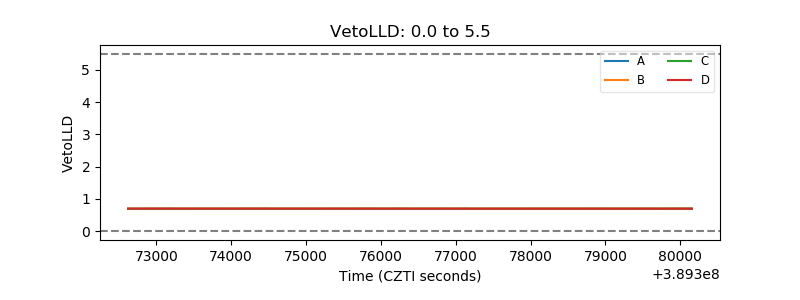 |
| Alpha Counter | 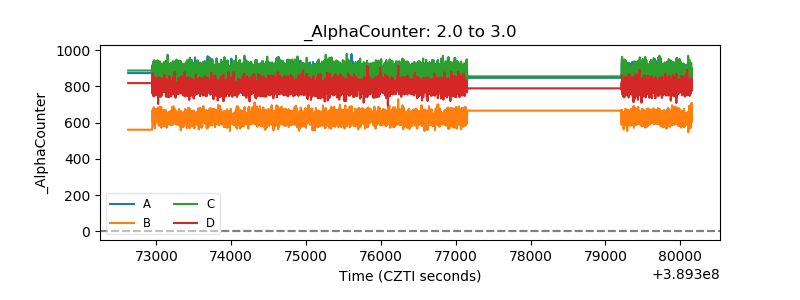 |
| _CPM_Rate | 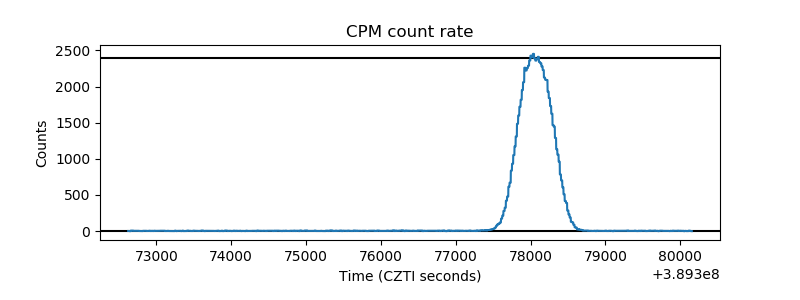 |
| CZT Counter | 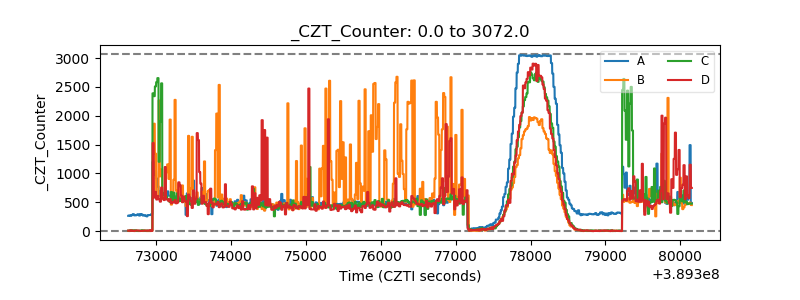 |
| +2.5 Volts monitor | 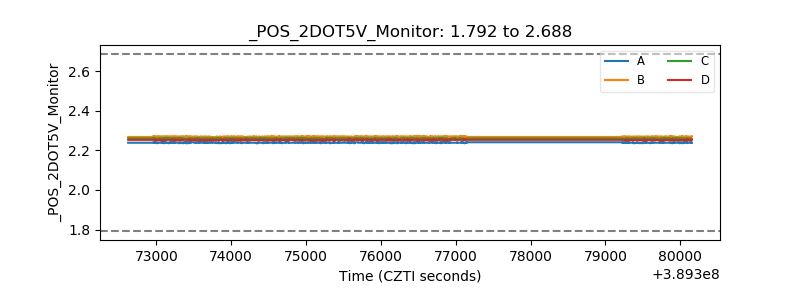 |
| +5 Volts monitor | 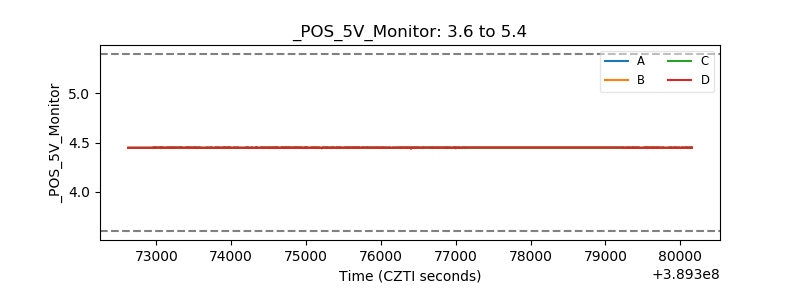 |
| _ROLL_ROT | 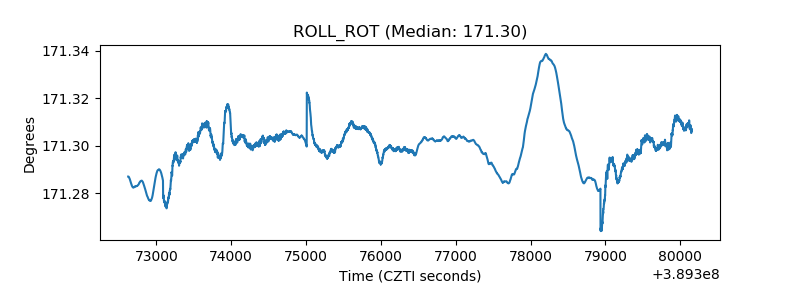 |
| _Roll_DEC | 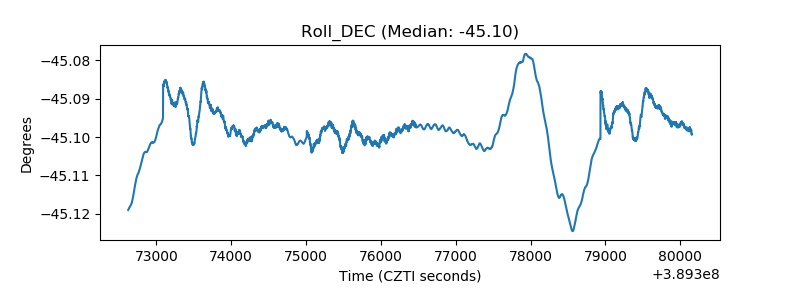 |
| _Roll_RA | 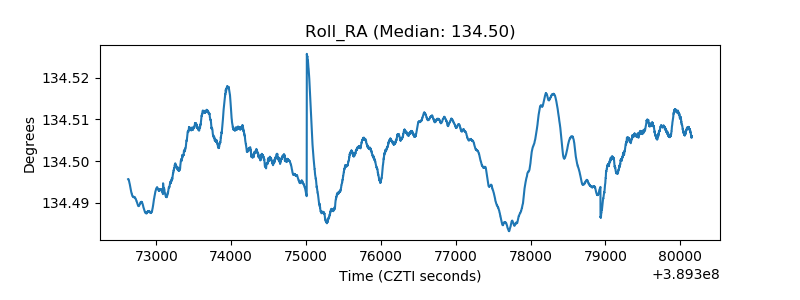 |
| Veto Counter | 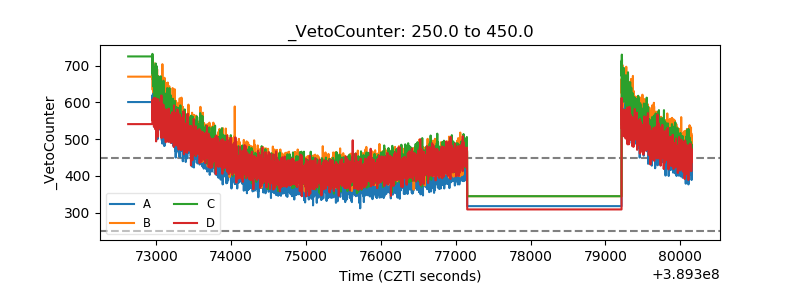 |