| Param | Original file | Final file |
|---|---|---|
| Filename | modeM0/AS1A09_029T02_9000005106_35676cztM0_level2.evt | modeM0/AS1A09_029T02_9000005106_35676cztM0_level2_quad_clean.evt |
| Size (bytes) | 612,008,640 | 115,531,200 |
| Size | 583.7 MB | 110.2 MB |
| Events in quadrant A | 3,332,061 | 776,547 |
| Events in quadrant B | 6,896,615 | 727,857 |
| Events in quadrant C | 3,639,491 | 771,095 |
| Events in quadrant D | 4,193,303 | 736,506 |
| Mode SS | |||
|---|---|---|---|
| Quadrant | BADHDUFLAG | Total packets | Discarded packets |
| A | 0 | 142 | 0 |
| B | 0 | 142 | 0 |
| C | 0 | 142 | 0 |
| D | 0 | 142 | 0 |
| Mode M0 | |||
|---|---|---|---|
| Quadrant | BADHDUFLAG | Total packets | Discarded packets |
| A | 0 | 14413 | 1 |
| B | 0 | 25149 | 1 |
| C | 0 | 15154 | 1 |
| D | 0 | 17191 | 1 |
| Mode M9 | |||
|---|---|---|---|
| Quadrant | BADHDUFLAG | Total packets | Discarded packets |
| A | 0 | 14 | 0 |
| B | 0 | 14 | 0 |
| C | 0 | 14 | 0 |
| D | 0 | 14 | 0 |
| Quadrant | Total seconds | Saturated seconds | Saturation percentage |
|---|---|---|---|
| A | 6983 | 14 | 0.200487% |
| B | 6983 | 1144 | 16.382644% |
| C | 6983 | 121 | 1.732780% |
| D | 6983 | 214 | 3.064585% |
Noise dominated data is calculated using 1-second bins in cleaned event files. If a bin has >2000 counts, and if more than 50% of those come from <1% of pixels, then it is considered to be noise-dominated and hence unusable.
| Quadrant | # 1 sec bins | Bins with >0 counts | Bins with >2000 counts | High rate bins dominated by noise | Noise dominated (total time) | Noise dominated (detector-on time) | Marked lightcurve |
|---|---|---|---|---|---|---|---|
| A | 8416 | 6984 | 8 | 8 | 0.10% | 0.11% | 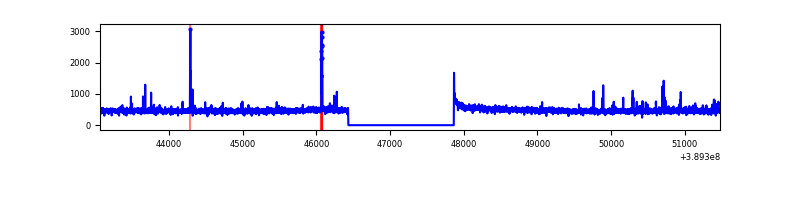 |
| B | 8416 | 6984 | 953 | 953 | 11.32% | 13.65% | 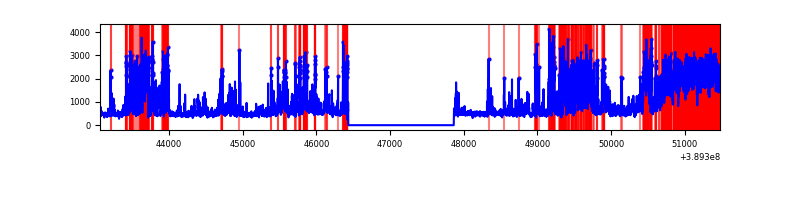 |
| C | 8416 | 6984 | 94 | 94 | 1.12% | 1.35% | 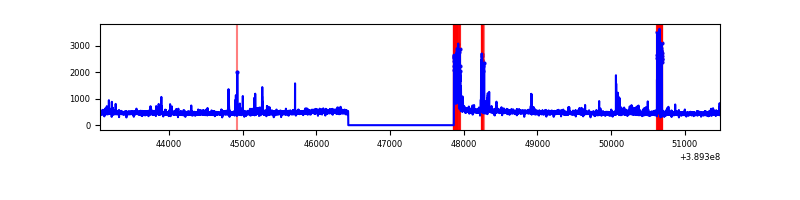 |
| D | 8416 | 6984 | 163 | 163 | 1.94% | 2.33% | 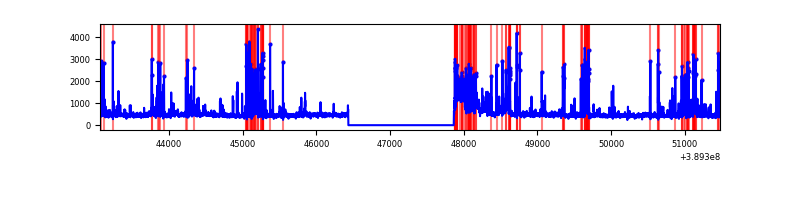 |
Top three noisy pixels from each quadrant. If the there are fewer than three noisy pixels in the level2.evt file, extra rows are filled as -1
| Pixel properties | Quadrant properties | ||||||
|---|---|---|---|---|---|---|---|
| Quadrant | DetID | PixID | Counts | Sigma | Mean | Median | Sigma |
| A | 10 | 83 | 132717 | 829.58 | 788 | 772 | 159.1 |
| A | 15 | 169 | 89085 | 555.25 | 788 | 772 | 159.1 |
| A | 13 | 6 | 28913 | 176.93 | 788 | 772 | 159.1 |
| B | 5 | 31 | 1911301 | 13286.78 | 739 | 717 | 143.8 |
| B | 5 | 172 | 1205093 | 8375.6 | 739 | 717 | 143.8 |
| B | 5 | 15 | 443618 | 3080.07 | 739 | 717 | 143.8 |
| C | 15 | 214 | 282107 | 1615.85 | 750 | 755 | 174.1 |
| C | 0 | 10 | 236166 | 1352.0 | 750 | 755 | 174.1 |
| C | 1 | 23 | 147633 | 843.54 | 750 | 755 | 174.1 |
| D | 13 | 249 | 435688 | 2352.17 | 755 | 733 | 184.9 |
| D | 10 | 118 | 310506 | 1675.2 | 755 | 733 | 184.9 |
| D | 8 | 195 | 156956 | 844.83 | 755 | 733 | 184.9 |
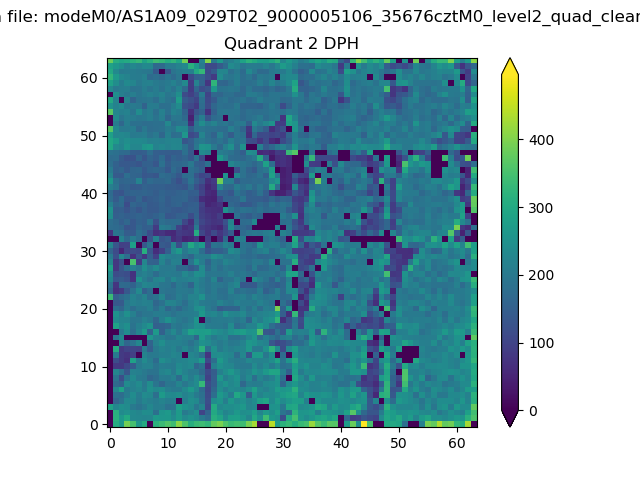
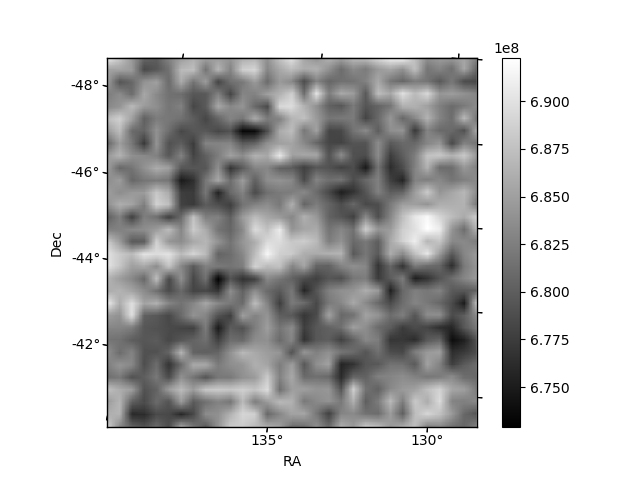
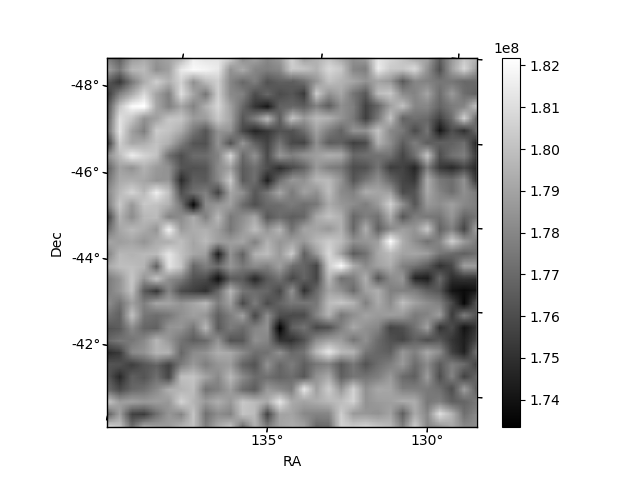
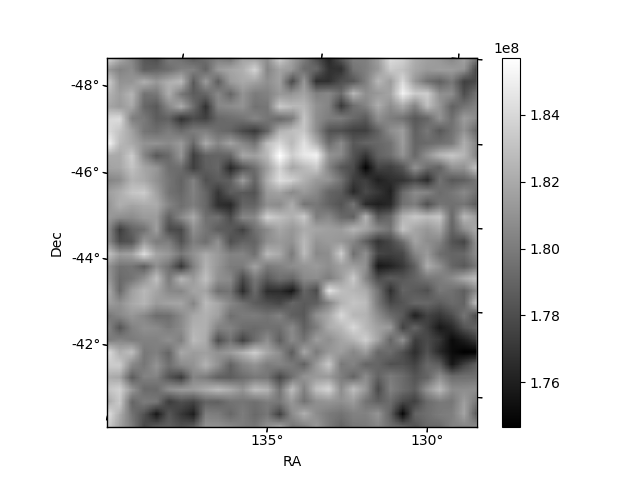
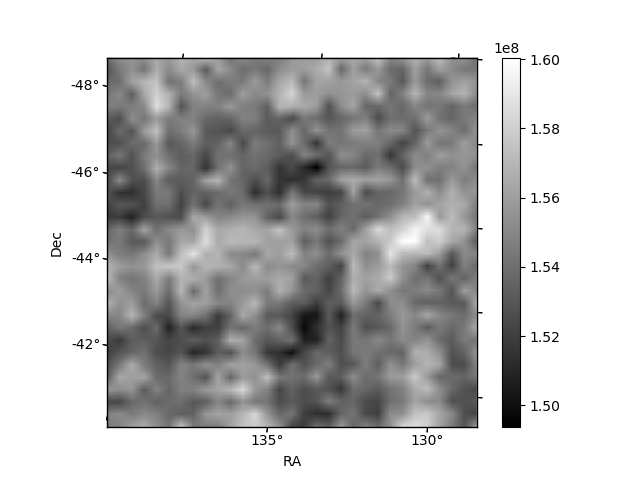
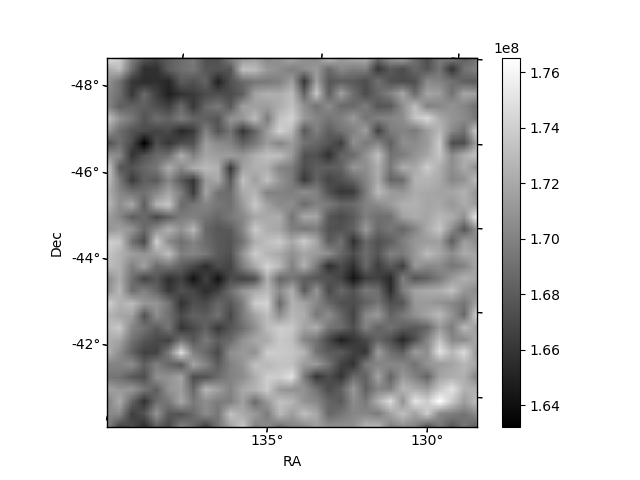
Histogram calculated using DETX and DETY for each event in the final _common_clean file
| Quadrant A | 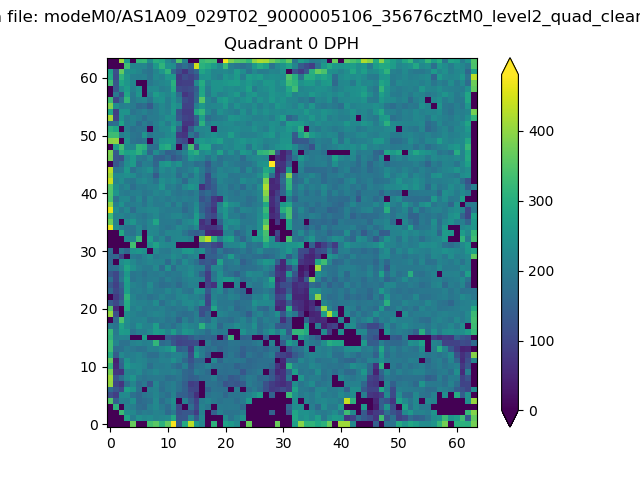 |
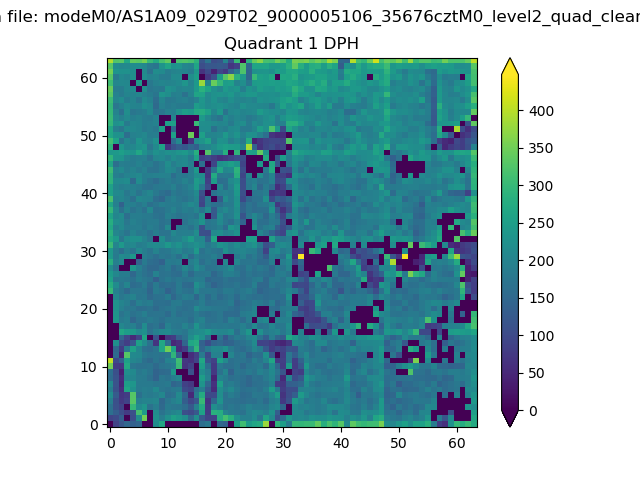 |
Quadrant B |
|---|---|---|---|
| Quadrant D | 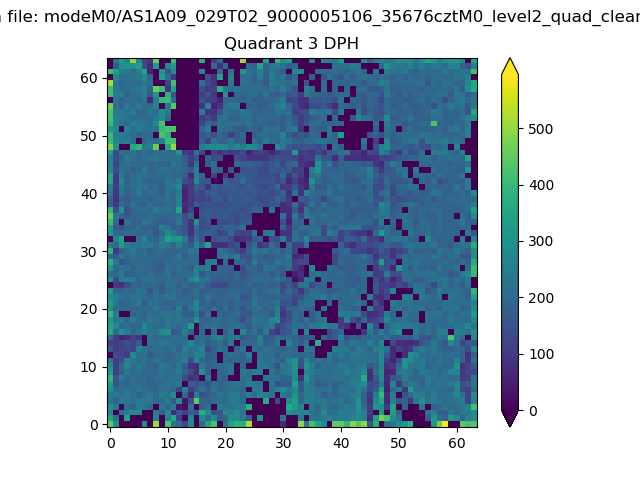 |
 |
Quadrant C |
| Plot type | Count rate plots | Images |
|---|---|---|
| Comparison with Poisson distribution Blue bars denote a histogram of data divided into 1 sec bins. Red curve is a Poisson curve with rate = median count rate of data. |
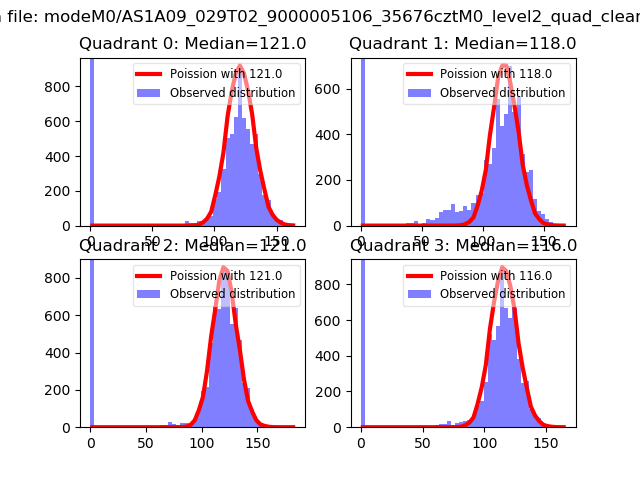 |
 |
| Quadrant-wise count rates Data is divided into 100 sec bins |
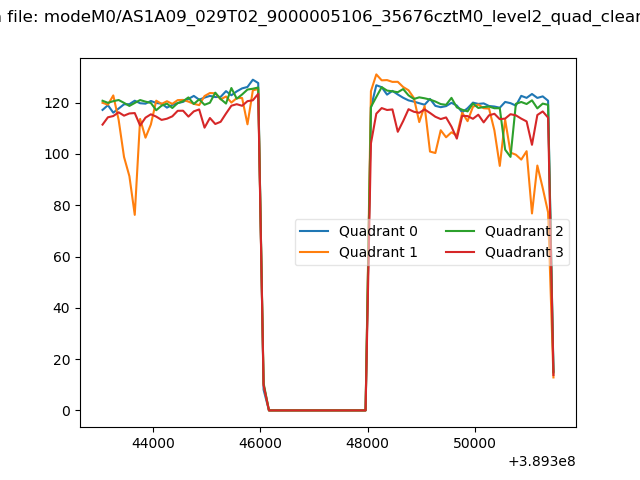 |
|
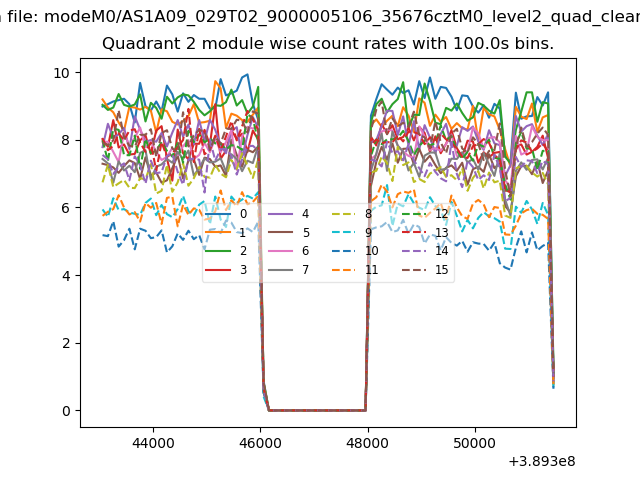
| Module-wise count rates for Quadrant A Data is divided into 100 sec bins |
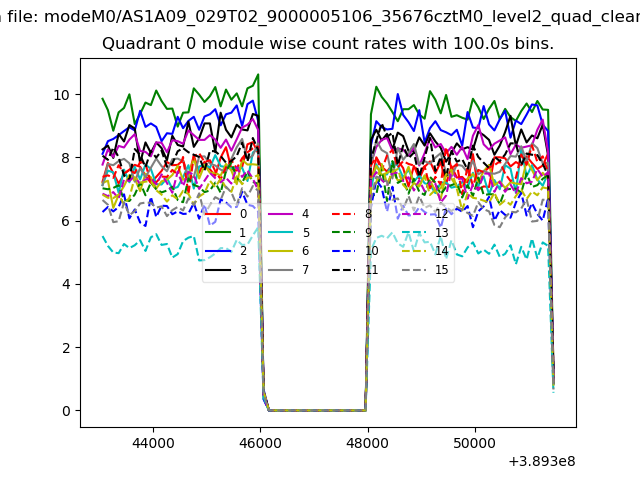 |
 |
| Module-wise count rates for Quadrant B Data is divided into 100 sec bins |
 |
 |
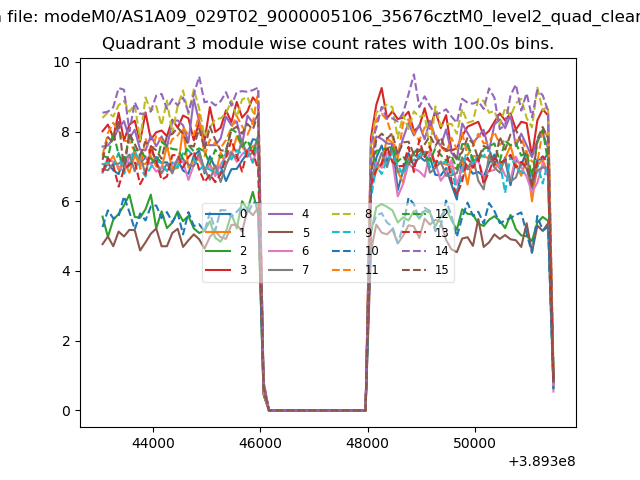
| Module-wise count rates for Quadrant C Data is divided into 100 sec bins |
 |
 |
| Module-wise count rates for Quadrant D Data is divided into 100 sec bins |
 |
 |
| Parameter | Plot |
|---|---|
| CZT HV Monitor | 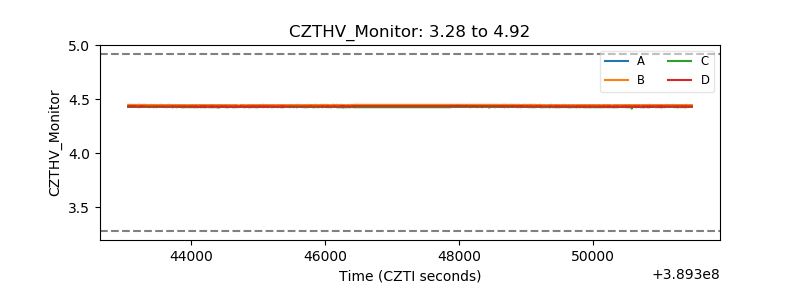 |
| D_VDD | 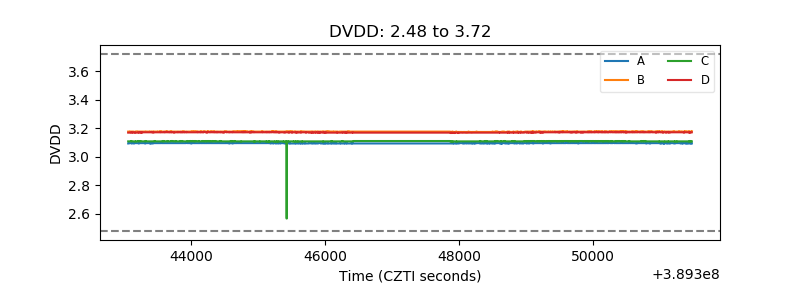 |
| Temperature 1 | 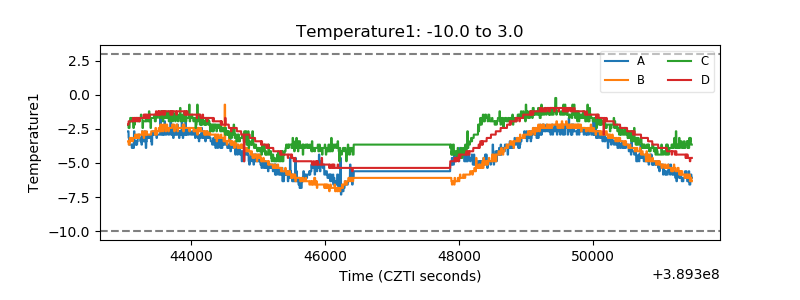 |
| Veto HV Monitor | 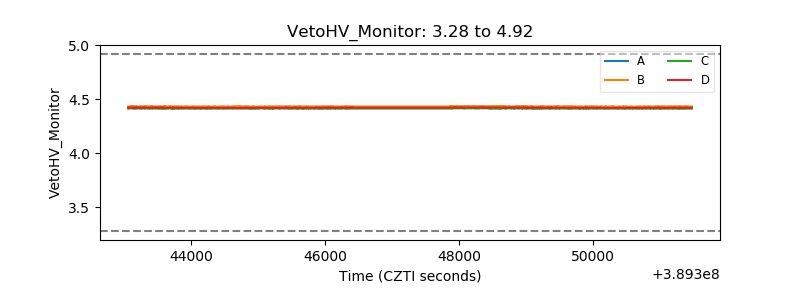 |
| Veto LLD | 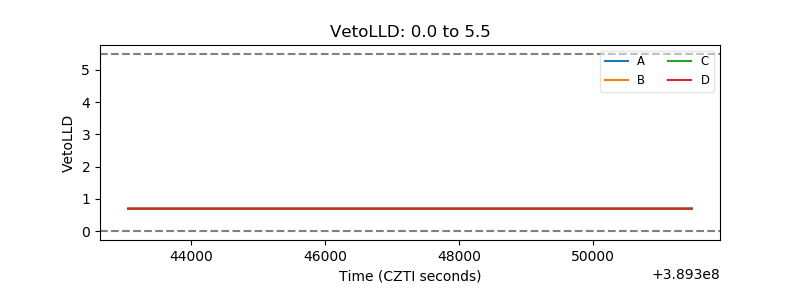 |
| Alpha Counter | 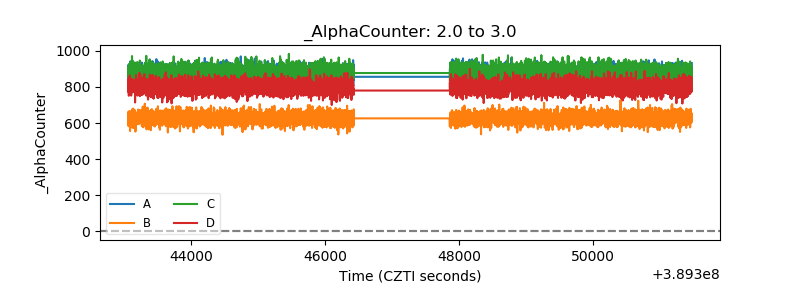 |
| _CPM_Rate | 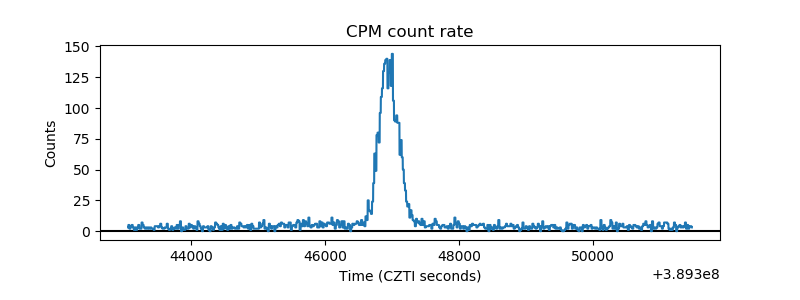 |
| CZT Counter | 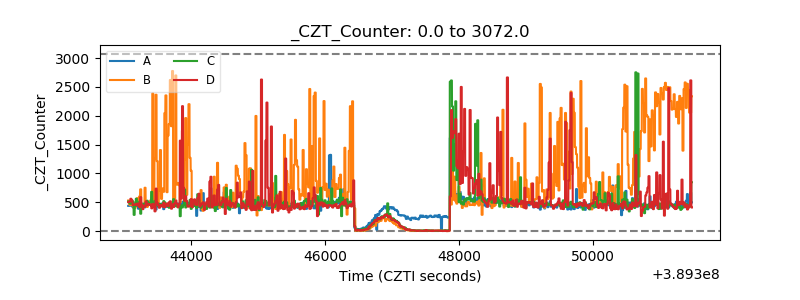 |
| +2.5 Volts monitor | 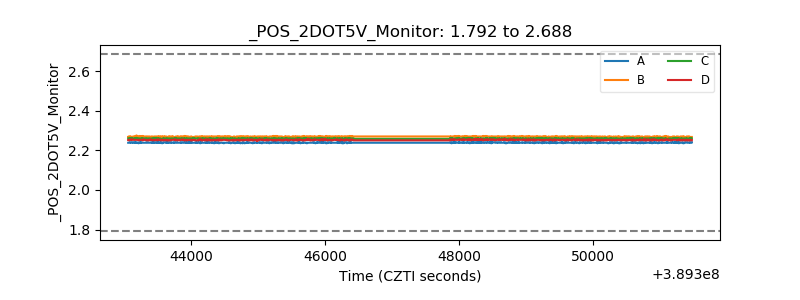 |
| +5 Volts monitor | 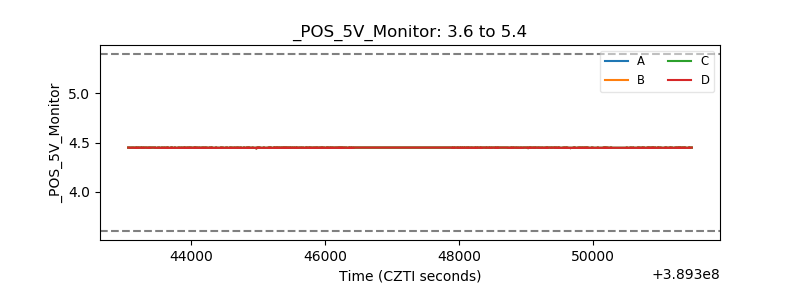 |
| _ROLL_ROT | 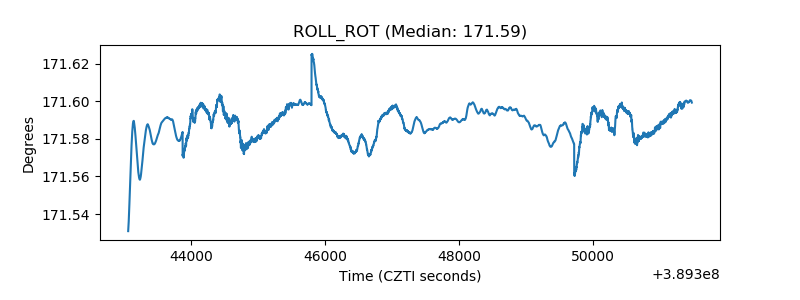 |
| _Roll_DEC | 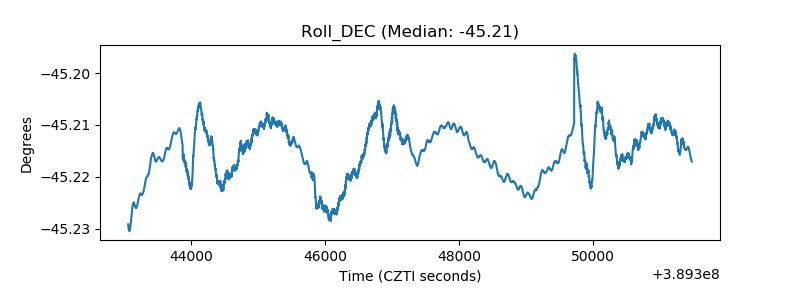 |
| _Roll_RA | 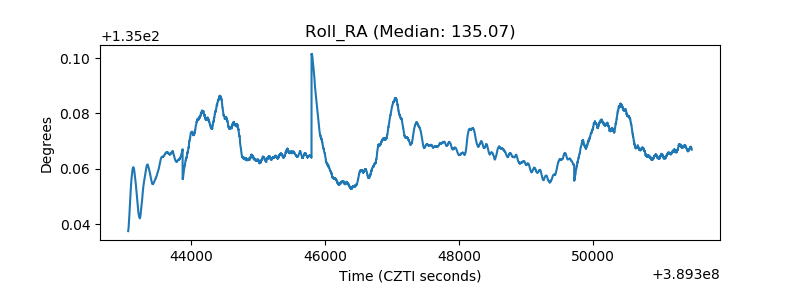 |
| Veto Counter | 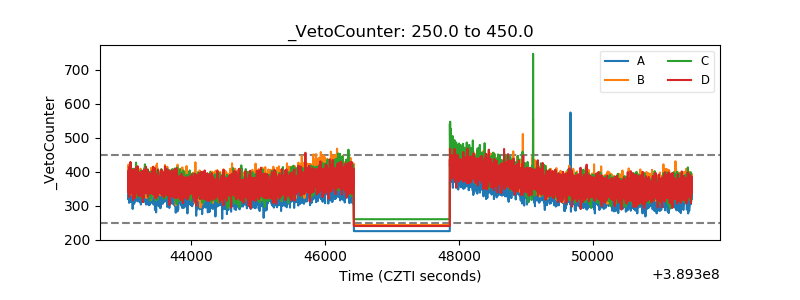 |