| Param | Original file | Final file |
|---|---|---|
| Filename | modeM0/AS1A09_029T02_9000005106_35675cztM0_level2.evt | modeM0/AS1A09_029T02_9000005106_35675cztM0_level2_quad_clean.evt |
| Size (bytes) | 572,299,200 | 101,039,040 |
| Size | 545.8 MB | 96.4 MB |
| Events in quadrant A | 3,347,648 | 652,429 |
| Events in quadrant B | 5,239,162 | 639,010 |
| Events in quadrant C | 3,826,943 | 653,596 |
| Events in quadrant D | 4,436,994 | 620,248 |
| Mode SS | |||
|---|---|---|---|
| Quadrant | BADHDUFLAG | Total packets | Discarded packets |
| A | 0 | 146 | 0 |
| B | 0 | 146 | 0 |
| C | 0 | 146 | 0 |
| D | 0 | 146 | 0 |
| Mode M0 | |||
|---|---|---|---|
| Quadrant | BADHDUFLAG | Total packets | Discarded packets |
| A | 0 | 14456 | 3 |
| B | 0 | 20222 | 2 |
| C | 0 | 15510 | 2 |
| D | 0 | 17901 | 2 |
| Mode M9 | |||
|---|---|---|---|
| Quadrant | BADHDUFLAG | Total packets | Discarded packets |
| A | 0 | 26 | 0 |
| B | 0 | 26 | 0 |
| C | 0 | 26 | 0 |
| D | 0 | 26 | 0 |
| Quadrant | Total seconds | Saturated seconds | Saturation percentage |
|---|---|---|---|
| A | 7100 | 11 | 0.154930% |
| B | 7100 | 501 | 7.056338% |
| C | 7100 | 145 | 2.042254% |
| D | 7100 | 227 | 3.197183% |
Noise dominated data is calculated using 1-second bins in cleaned event files. If a bin has >2000 counts, and if more than 50% of those come from <1% of pixels, then it is considered to be noise-dominated and hence unusable.
| Quadrant | # 1 sec bins | Bins with >0 counts | Bins with >2000 counts | High rate bins dominated by noise | Noise dominated (total time) | Noise dominated (detector-on time) | Marked lightcurve |
|---|---|---|---|---|---|---|---|
| A | 9725 | 7102 | 0 | 0 | 0.00% | 0.00% | 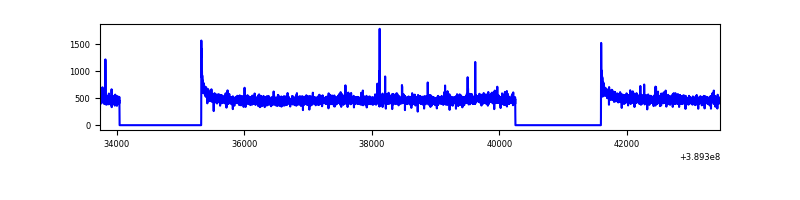 |
| B | 9725 | 7102 | 360 | 360 | 3.70% | 5.07% | 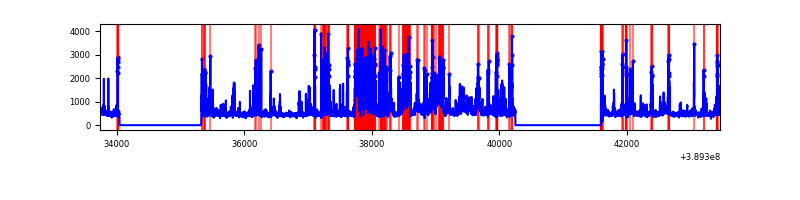 |
| C | 9725 | 7102 | 92 | 92 | 0.95% | 1.30% | 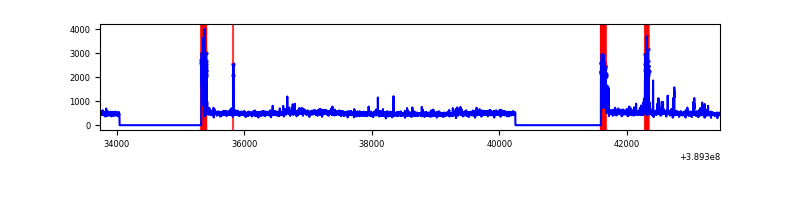 |
| D | 9725 | 7102 | 179 | 179 | 1.84% | 2.52% | 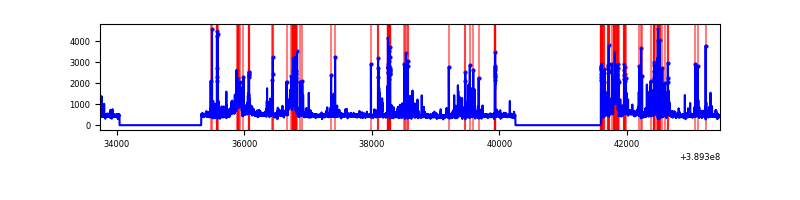 |
Top three noisy pixels from each quadrant. If the there are fewer than three noisy pixels in the level2.evt file, extra rows are filled as -1
| Pixel properties | Quadrant properties | ||||||
|---|---|---|---|---|---|---|---|
| Quadrant | DetID | PixID | Counts | Sigma | Mean | Median | Sigma |
| A | 10 | 83 | 163624 | 988.01 | 812 | 795 | 164.8 |
| A | 15 | 169 | 30555 | 180.57 | 812 | 795 | 164.8 |
| A | 13 | 6 | 11927 | 67.54 | 812 | 795 | 164.8 |
| B | 5 | 172 | 1448172 | 9485.47 | 786 | 766 | 152.6 |
| B | 5 | 31 | 450252 | 2945.67 | 786 | 766 | 152.6 |
| B | 5 | 255 | 136902 | 892.16 | 786 | 766 | 152.6 |
| C | 15 | 214 | 290804 | 1597.93 | 784 | 789 | 181.5 |
| C | 0 | 10 | 286081 | 1571.91 | 784 | 789 | 181.5 |
| C | 9 | 187 | 171265 | 939.29 | 784 | 789 | 181.5 |
| D | 13 | 249 | 951515 | 4996.35 | 784 | 761 | 190.3 |
| D | 10 | 118 | 70888 | 368.52 | 784 | 761 | 190.3 |
| D | 1 | 47 | 70136 | 364.57 | 784 | 761 | 190.3 |
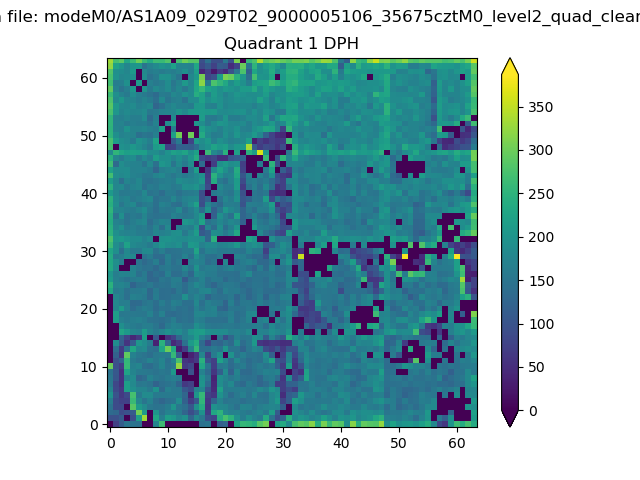
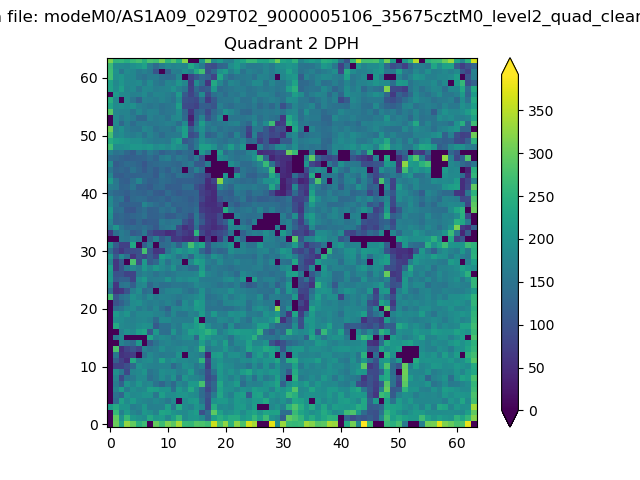
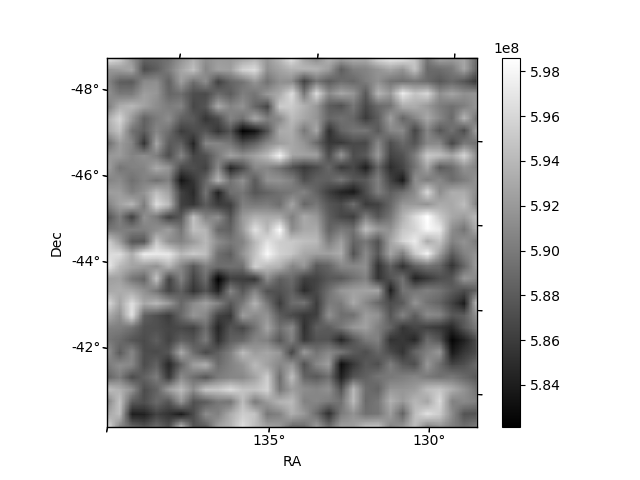
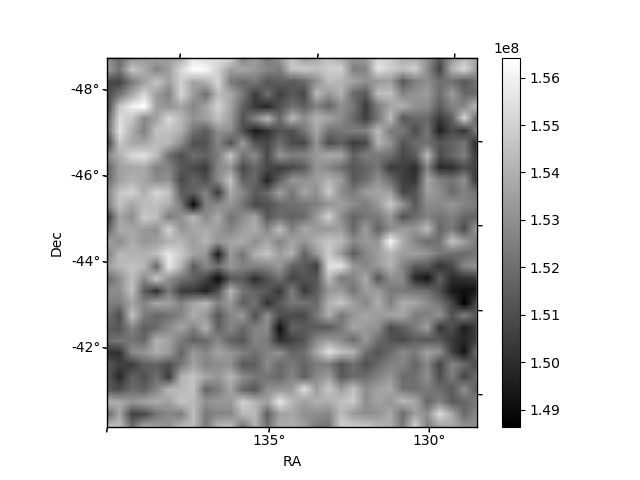
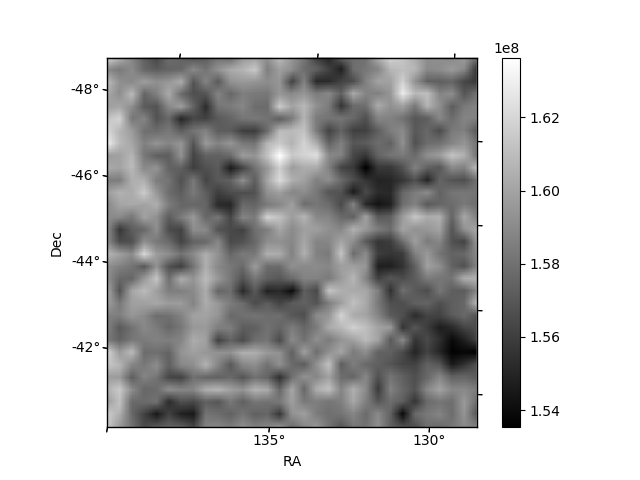
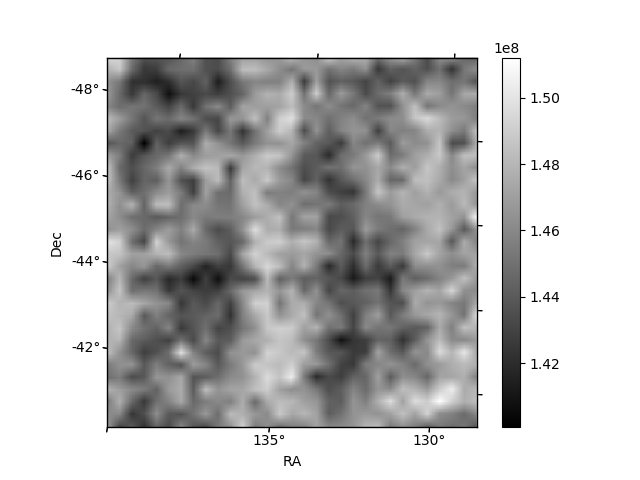
Histogram calculated using DETX and DETY for each event in the final _common_clean file
| Quadrant A |  |
 |
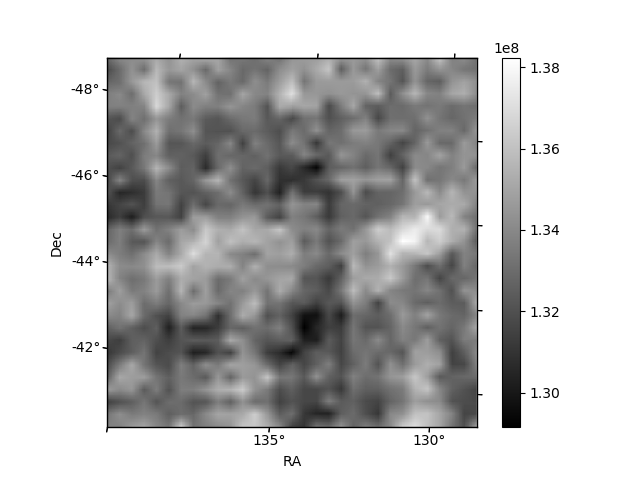
Quadrant B |
|---|---|---|---|
| Quadrant D | 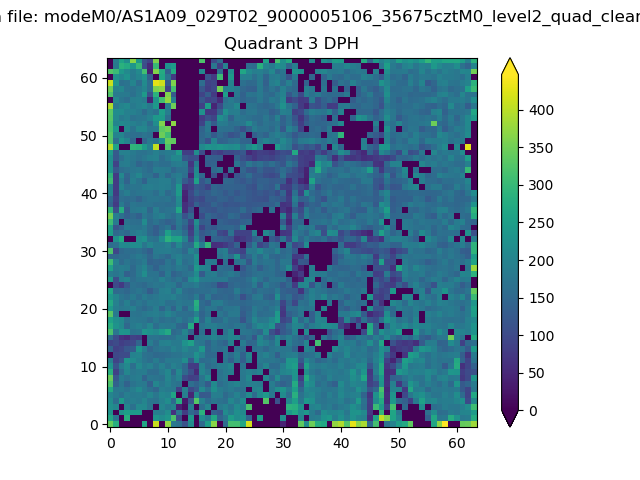 |
 |
Quadrant C |
| Plot type | Count rate plots | Images |
|---|---|---|
| Comparison with Poisson distribution Blue bars denote a histogram of data divided into 1 sec bins. Red curve is a Poisson curve with rate = median count rate of data. |
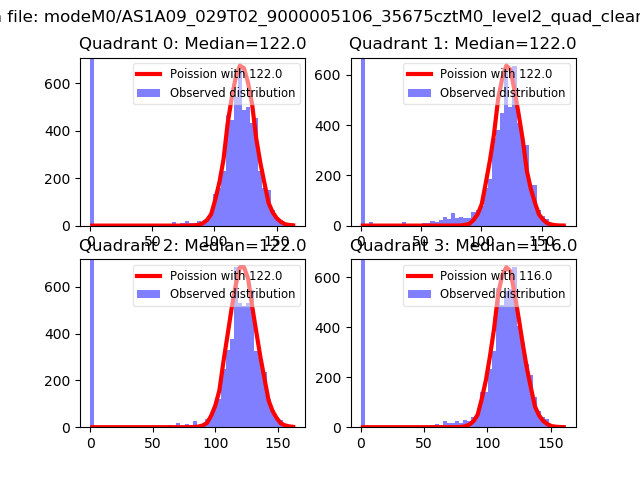 |
 |
| Quadrant-wise count rates Data is divided into 100 sec bins |
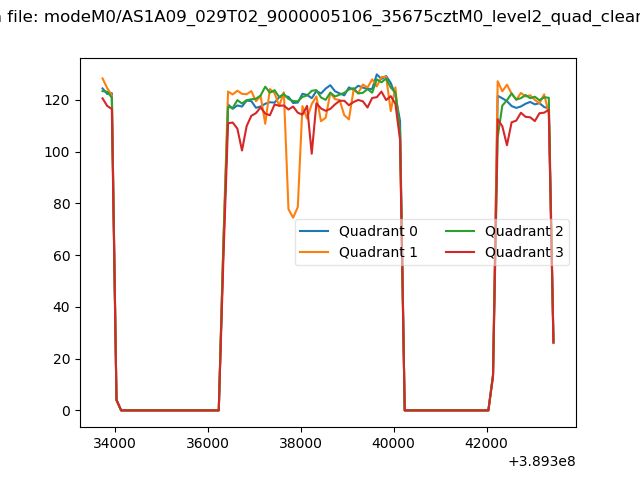 |
|
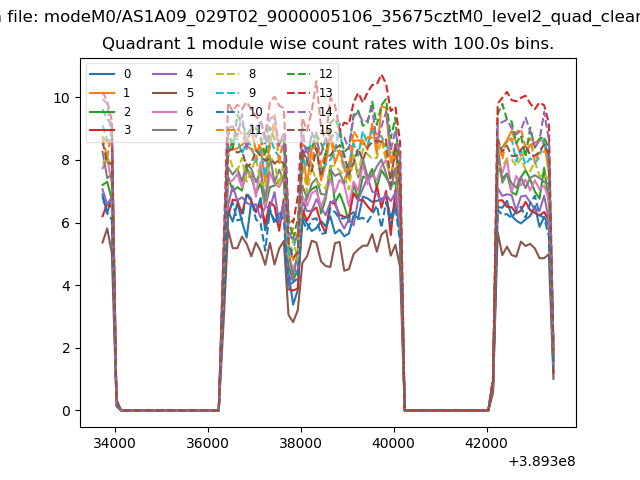
| Module-wise count rates for Quadrant A Data is divided into 100 sec bins |
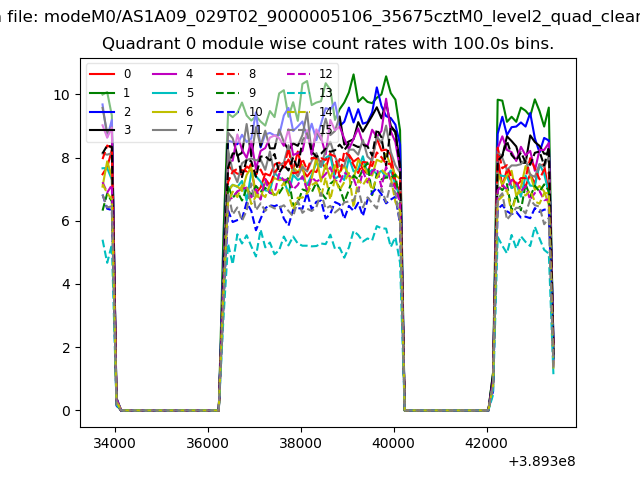 |
 |
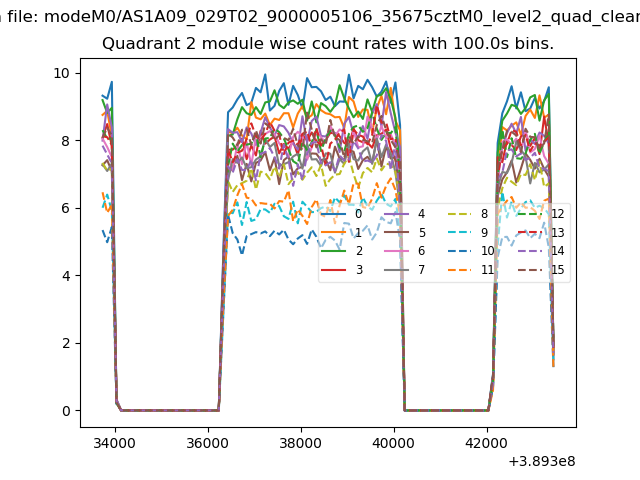
| Module-wise count rates for Quadrant B Data is divided into 100 sec bins |
 |
 |
| Module-wise count rates for Quadrant C Data is divided into 100 sec bins |
 |
 |
| Module-wise count rates for Quadrant D Data is divided into 100 sec bins |
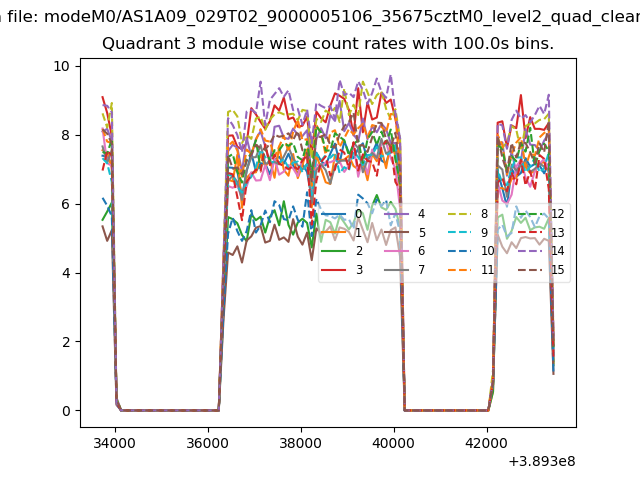 |
 |
| Parameter | Plot |
|---|---|
| CZT HV Monitor | 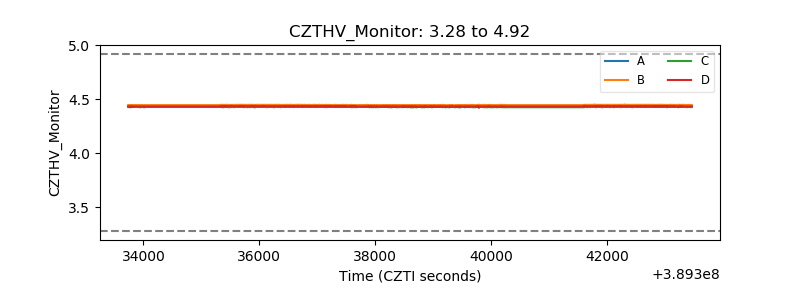 |
| D_VDD | 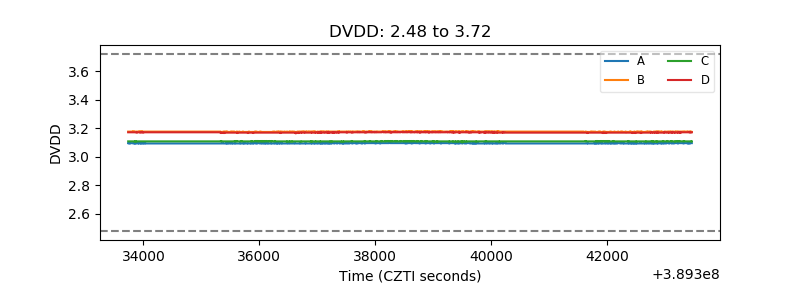 |
| Temperature 1 | 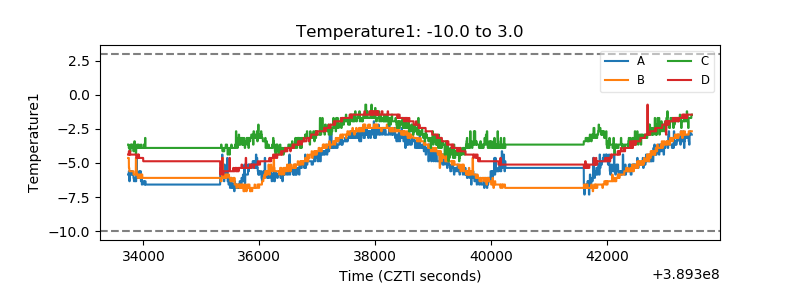 |
| Veto HV Monitor | 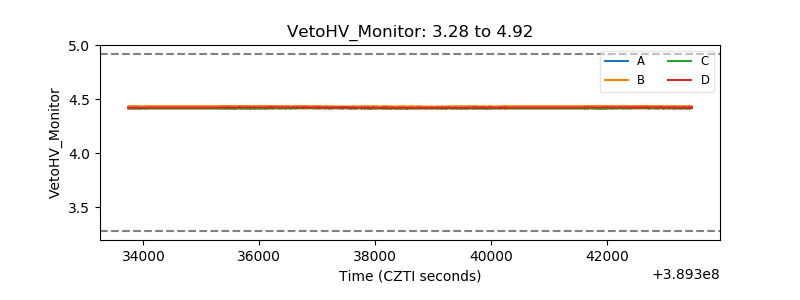 |
| Veto LLD | 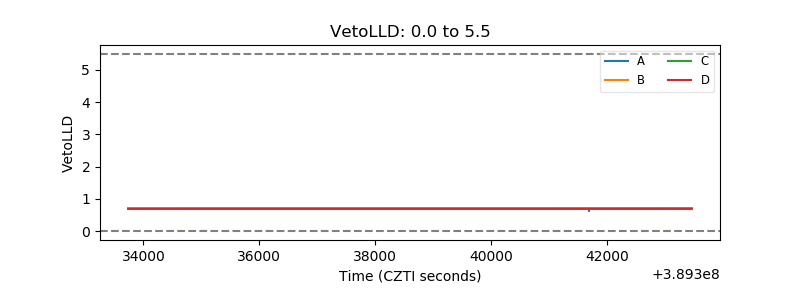 |
| Alpha Counter | 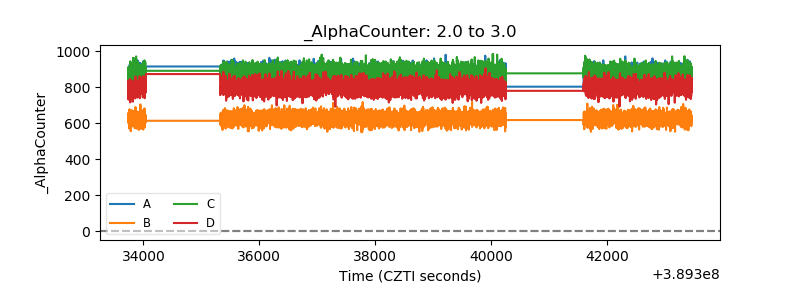 |
| _CPM_Rate | 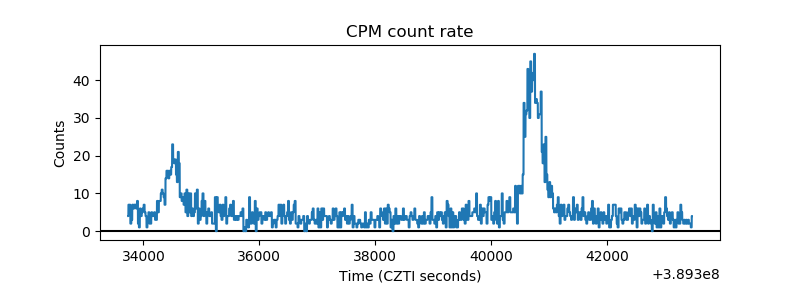 |
| CZT Counter | 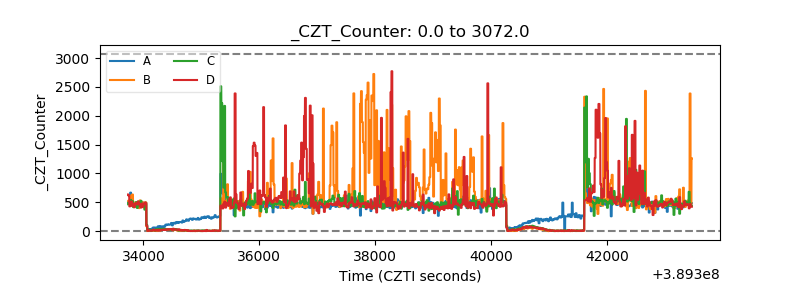 |
| +2.5 Volts monitor | 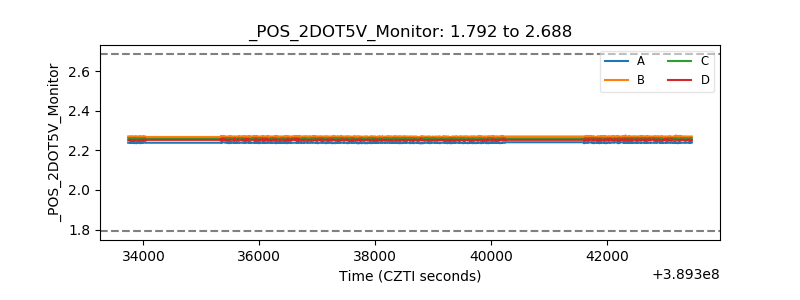 |
| +5 Volts monitor | 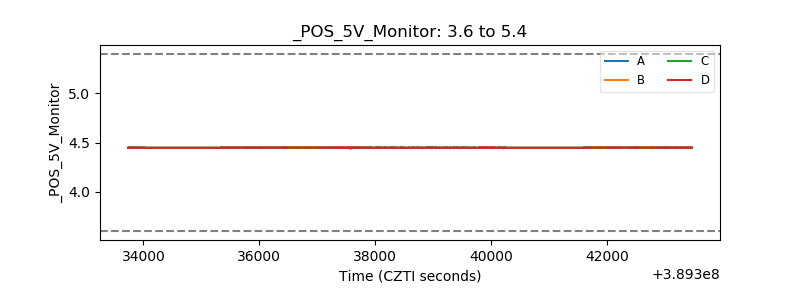 |
| _ROLL_ROT | 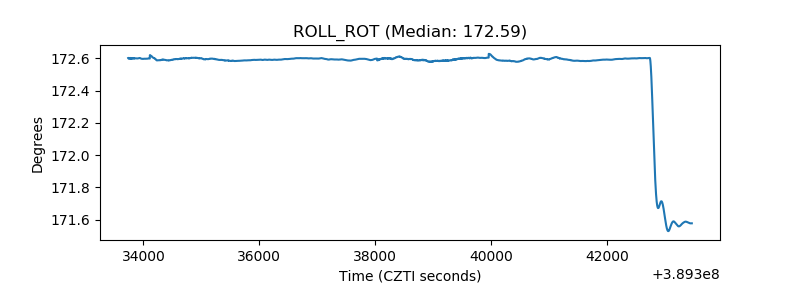 |
| _Roll_DEC | 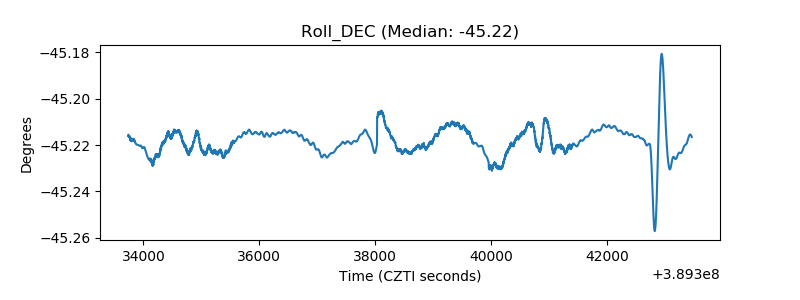 |
| _Roll_RA | 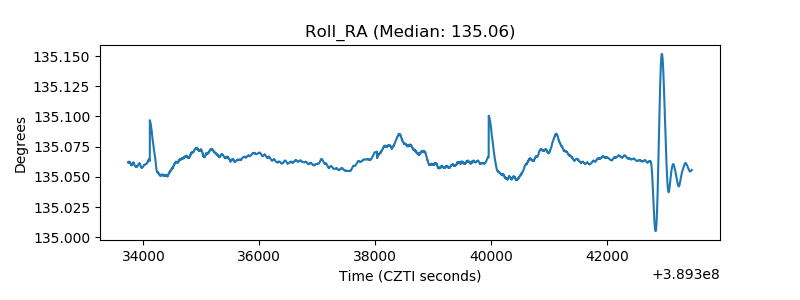 |
| Veto Counter | 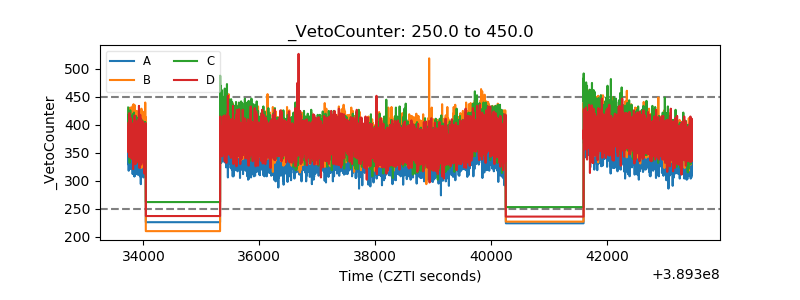 |