| Param | Original file | Final file |
|---|---|---|
| Filename | modeM0/AS1A09_029T02_9000005106_35673cztM0_level2.evt | modeM0/AS1A09_029T02_9000005106_35673cztM0_level2_quad_clean.evt |
| Size (bytes) | 478,336,320 | 69,837,120 |
| Size | 456.2 MB | 66.6 MB |
| Events in quadrant A | 2,854,263 | 432,209 |
| Events in quadrant B | 4,679,837 | 412,842 |
| Events in quadrant C | 3,204,794 | 432,698 |
| Events in quadrant D | 3,338,360 | 415,932 |
| Mode SS | |||
|---|---|---|---|
| Quadrant | BADHDUFLAG | Total packets | Discarded packets |
| A | 0 | 122 | 0 |
| B | 0 | 122 | 0 |
| C | 0 | 122 | 0 |
| D | 0 | 122 | 0 |
| Mode M0 | |||
|---|---|---|---|
| Quadrant | BADHDUFLAG | Total packets | Discarded packets |
| A | 0 | 12320 | 3 |
| B | 0 | 17923 | 2 |
| C | 0 | 13089 | 2 |
| D | 0 | 13945 | 2 |
| Mode M9 | |||
|---|---|---|---|
| Quadrant | BADHDUFLAG | Total packets | Discarded packets |
| A | 0 | 16 | 0 |
| B | 0 | 16 | 0 |
| C | 0 | 16 | 0 |
| D | 0 | 17 | 0 |
| Quadrant | Total seconds | Saturated seconds | Saturation percentage |
|---|---|---|---|
| A | 6026 | 7 | 0.116163% |
| B | 6026 | 562 | 9.326253% |
| C | 6026 | 105 | 1.742449% |
| D | 6026 | 83 | 1.377365% |
Noise dominated data is calculated using 1-second bins in cleaned event files. If a bin has >2000 counts, and if more than 50% of those come from <1% of pixels, then it is considered to be noise-dominated and hence unusable.
| Quadrant | # 1 sec bins | Bins with >0 counts | Bins with >2000 counts | High rate bins dominated by noise | Noise dominated (total time) | Noise dominated (detector-on time) | Marked lightcurve |
|---|---|---|---|---|---|---|---|
| A | 7308 | 6027 | 0 | 0 | 0.00% | 0.00% | 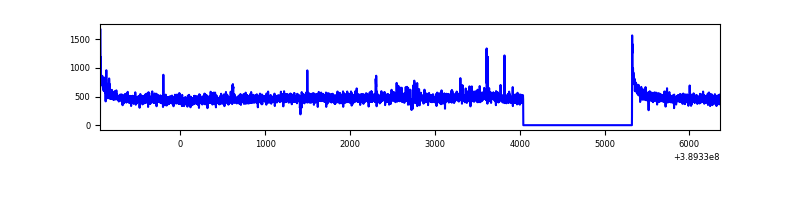 |
| B | 7308 | 6027 | 426 | 426 | 5.83% | 7.07% | 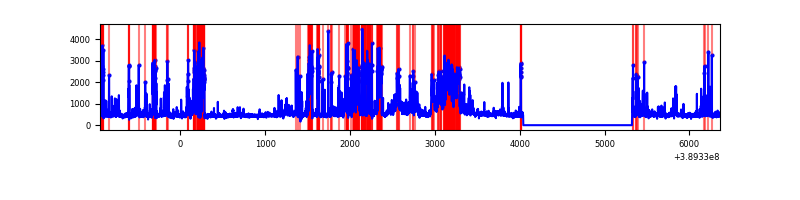 |
| C | 7308 | 6027 | 84 | 84 | 1.15% | 1.39% | 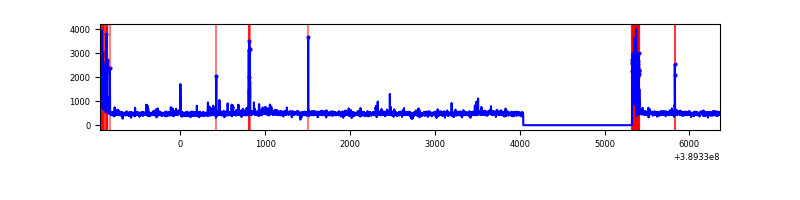 |
| D | 7308 | 6027 | 61 | 61 | 0.83% | 1.01% | 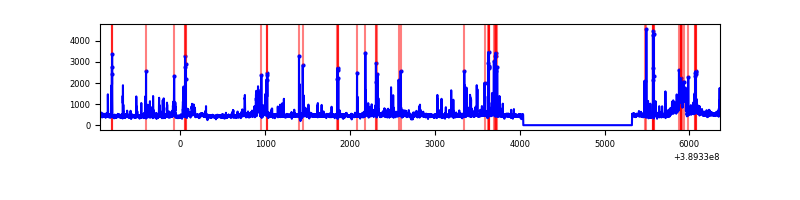 |
Top three noisy pixels from each quadrant. If the there are fewer than three noisy pixels in the level2.evt file, extra rows are filled as -1
| Pixel properties | Quadrant properties | ||||||
|---|---|---|---|---|---|---|---|
| Quadrant | DetID | PixID | Counts | Sigma | Mean | Median | Sigma |
| A | 10 | 83 | 153171 | 1092.92 | 684 | 669 | 139.5 |
| A | 15 | 169 | 30669 | 214.99 | 684 | 669 | 139.5 |
| A | 13 | 6 | 11911 | 80.56 | 684 | 669 | 139.5 |
| B | 5 | 172 | 1255403 | 9815.19 | 656 | 639 | 127.8 |
| B | 5 | 31 | 582449 | 4551.11 | 656 | 639 | 127.8 |
| B | 5 | 255 | 126686 | 985.98 | 656 | 639 | 127.8 |
| C | 0 | 10 | 280578 | 1797.66 | 663 | 666 | 155.7 |
| C | 15 | 214 | 252751 | 1618.95 | 663 | 666 | 155.7 |
| C | 9 | 187 | 35452 | 223.4 | 663 | 666 | 155.7 |
| D | 13 | 249 | 449756 | 2756.99 | 664 | 646 | 162.9 |
| D | 10 | 118 | 45114 | 272.98 | 664 | 646 | 162.9 |
| D | 10 | 199 | 44555 | 269.55 | 664 | 646 | 162.9 |
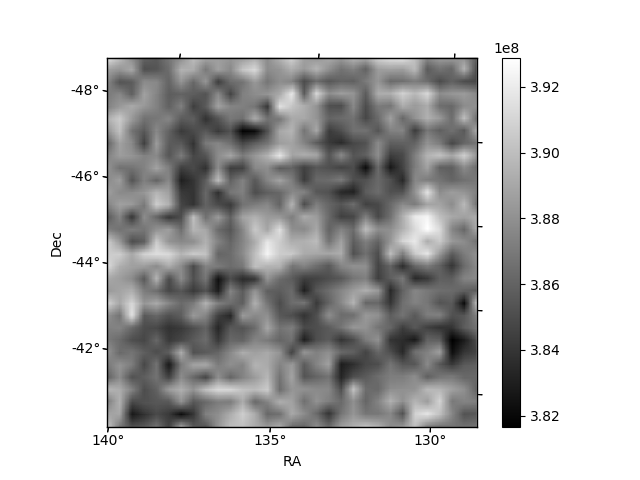
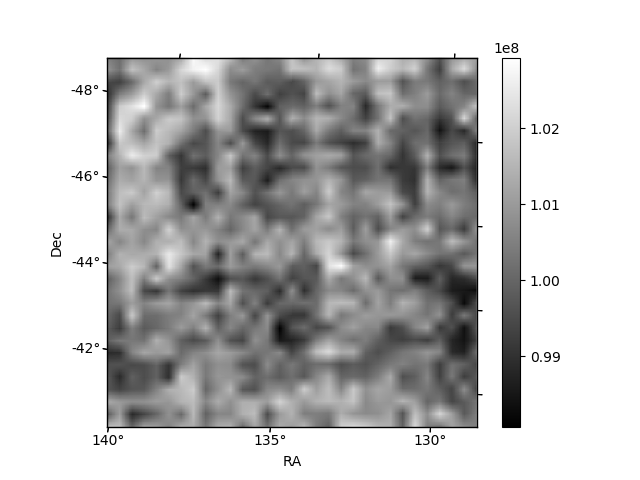
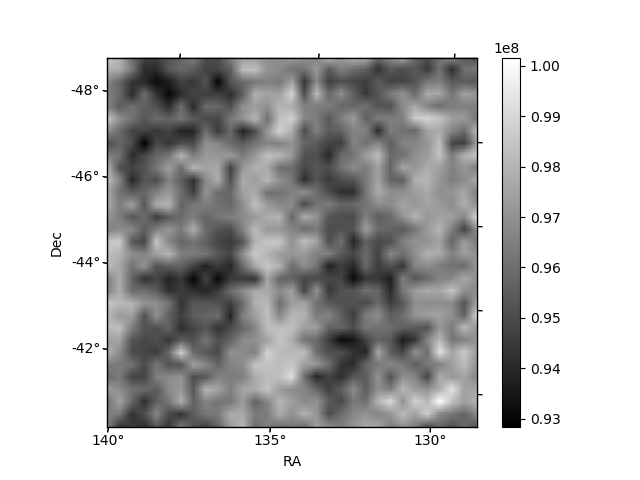
Histogram calculated using DETX and DETY for each event in the final _common_clean file
| Quadrant A | 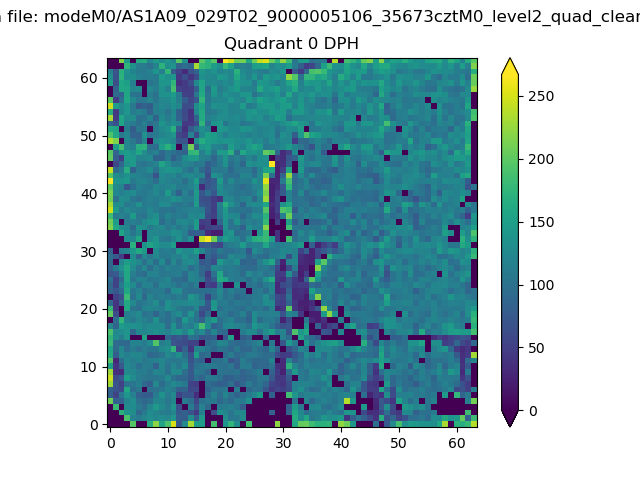 |
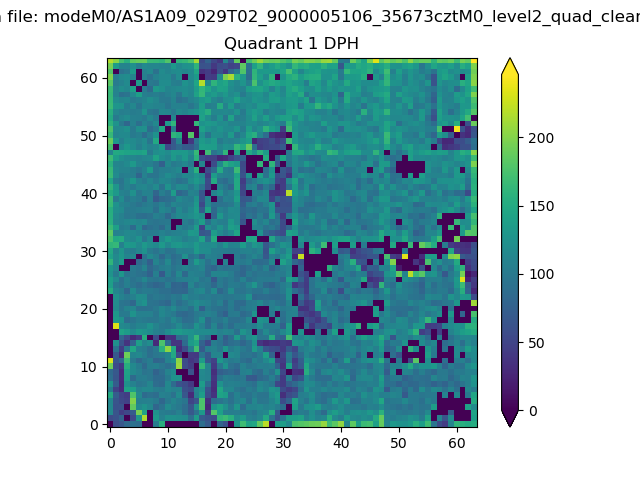 |
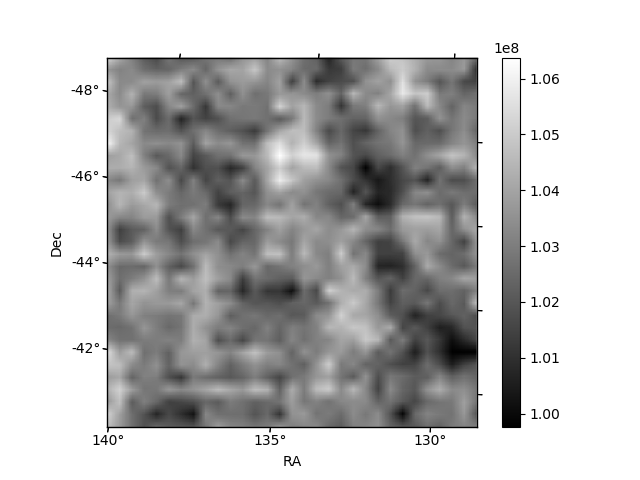
Quadrant B |
|---|---|---|---|
| Quadrant D | 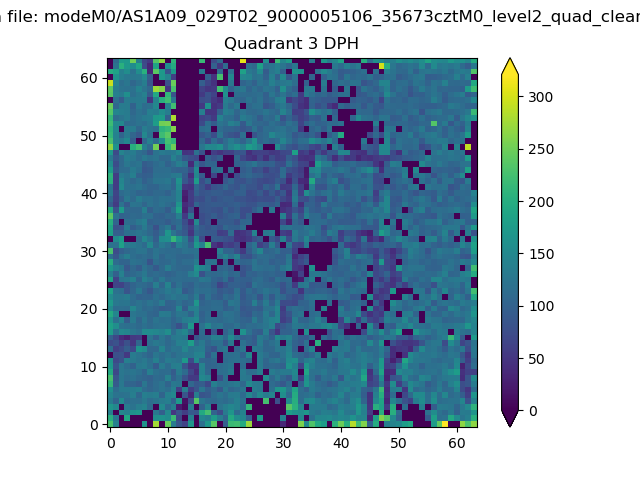 |
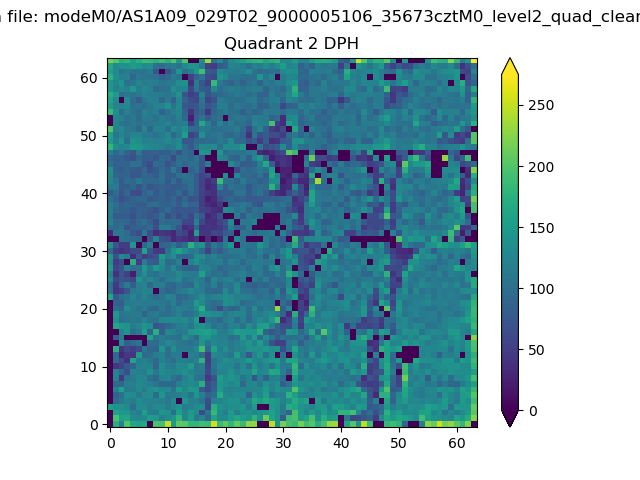 |
Quadrant C |
| Plot type | Count rate plots | Images |
|---|---|---|
| Comparison with Poisson distribution Blue bars denote a histogram of data divided into 1 sec bins. Red curve is a Poisson curve with rate = median count rate of data. |
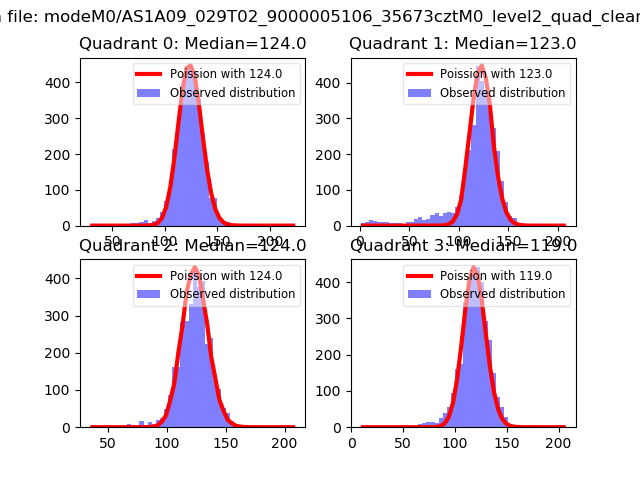 |
 |
| Quadrant-wise count rates Data is divided into 100 sec bins |
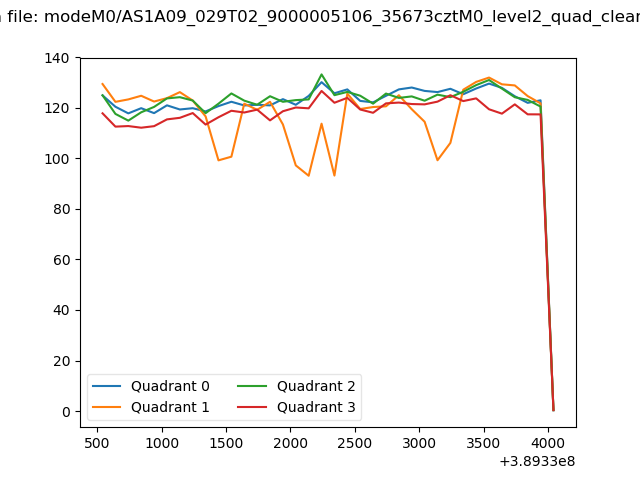 |
|
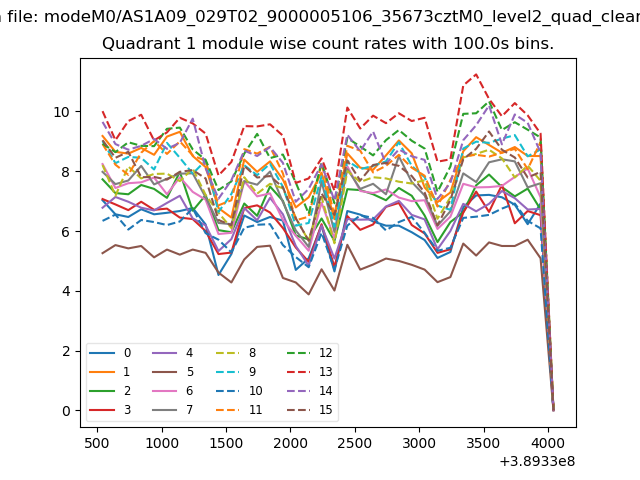
| Module-wise count rates for Quadrant A Data is divided into 100 sec bins |
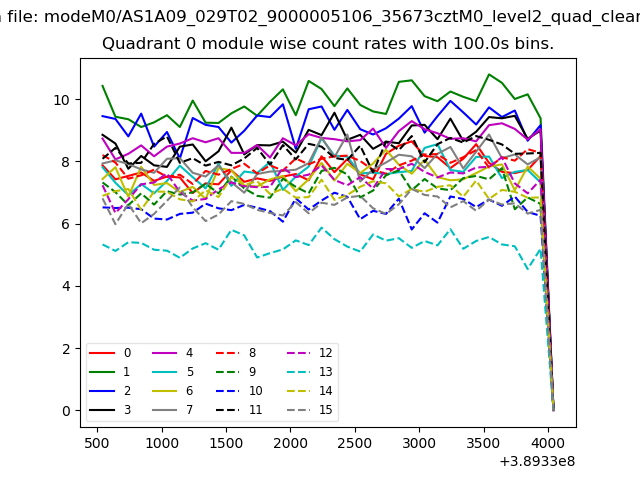 |
 |
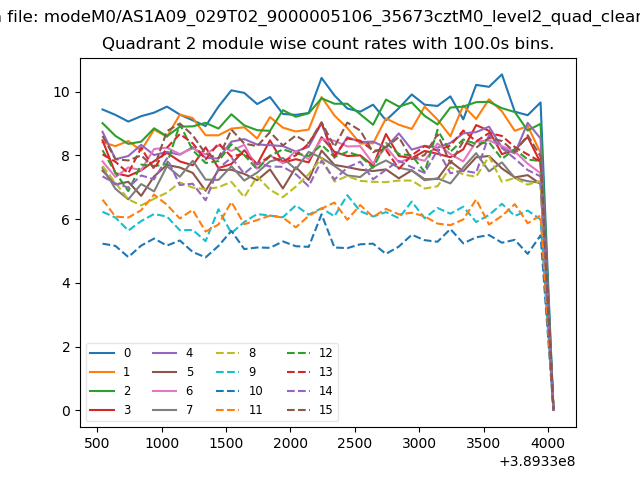
| Module-wise count rates for Quadrant B Data is divided into 100 sec bins |
 |
 |
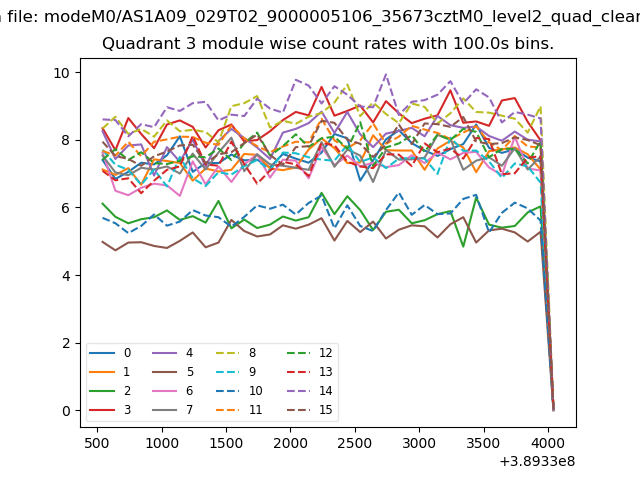
| Module-wise count rates for Quadrant C Data is divided into 100 sec bins |
 |
 |
| Module-wise count rates for Quadrant D Data is divided into 100 sec bins |
 |
 |
| Parameter | Plot |
|---|---|
| CZT HV Monitor | 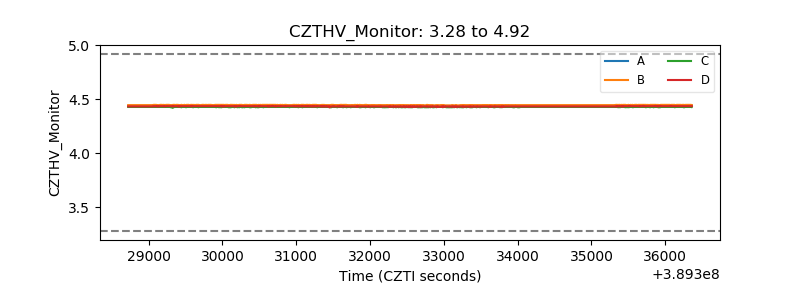 |
| D_VDD | 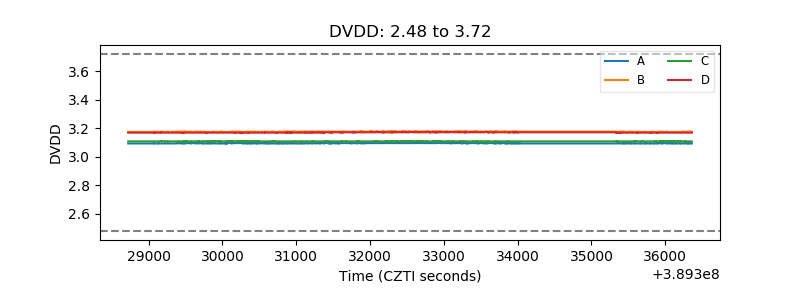 |
| Temperature 1 | 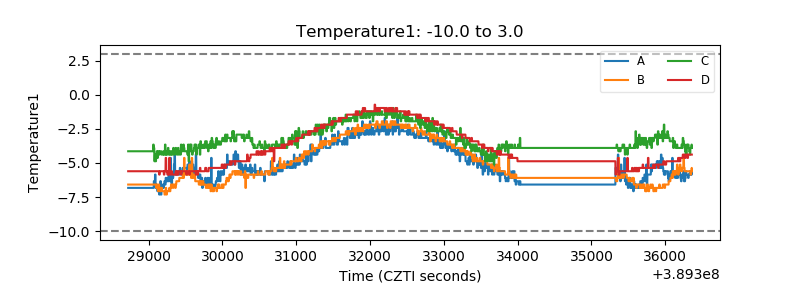 |
| Veto HV Monitor | 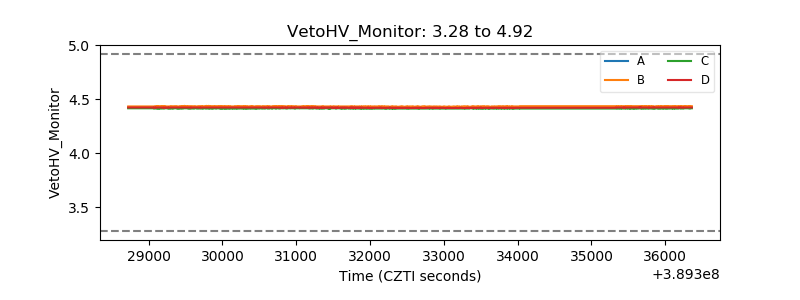 |
| Veto LLD | 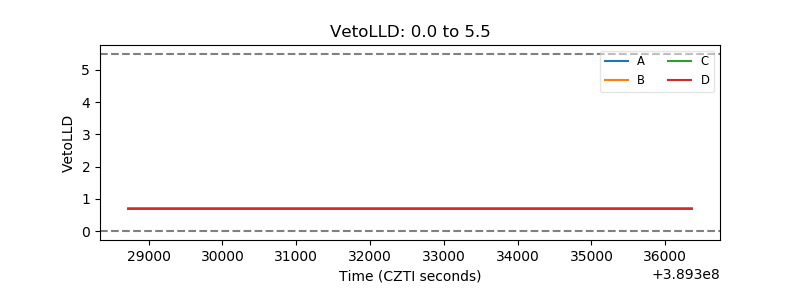 |
| Alpha Counter | 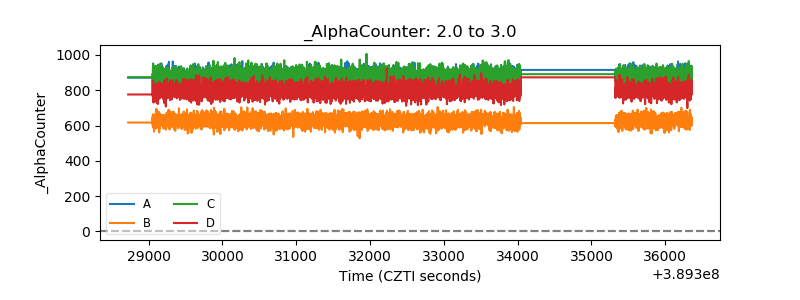 |
| _CPM_Rate | 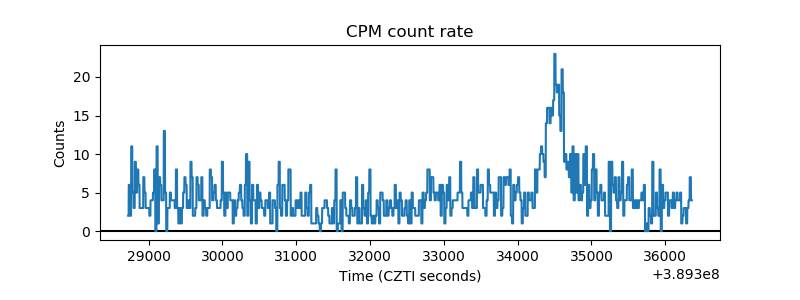 |
| CZT Counter | 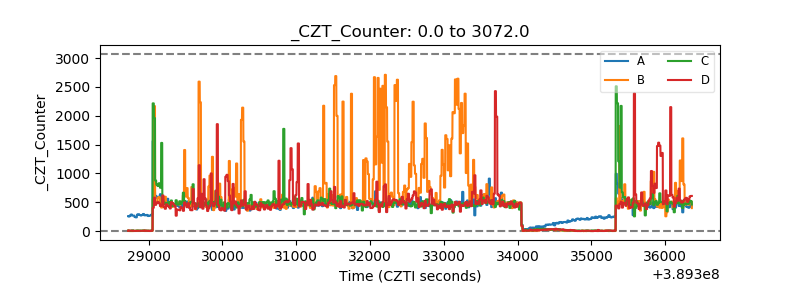 |
| +2.5 Volts monitor | 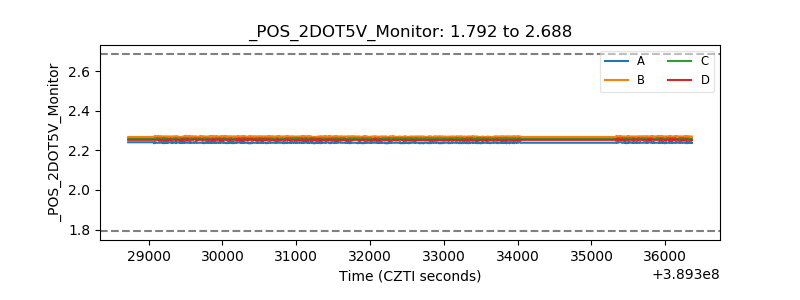 |
| +5 Volts monitor |  |
| _ROLL_ROT | 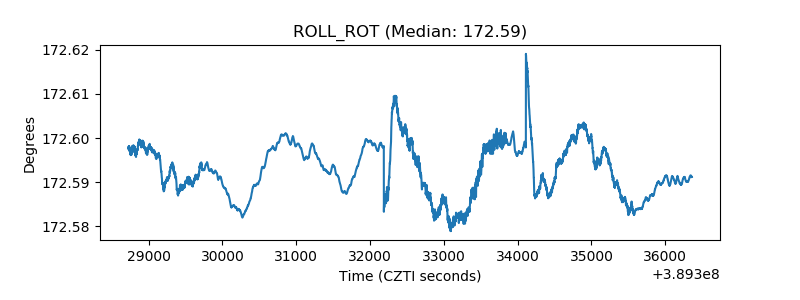 |
| _Roll_DEC | 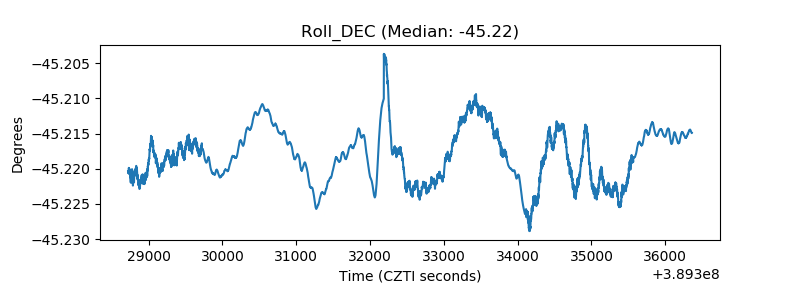 |
| _Roll_RA | 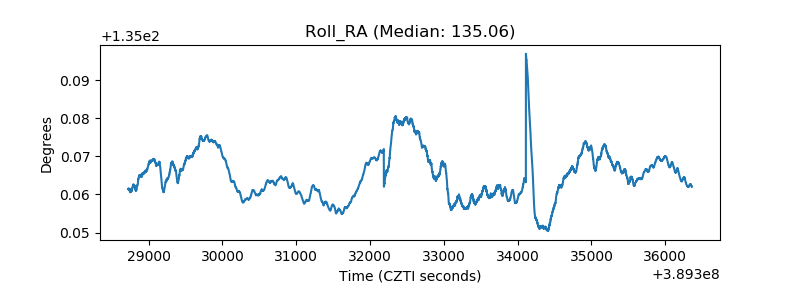 |
| Veto Counter | 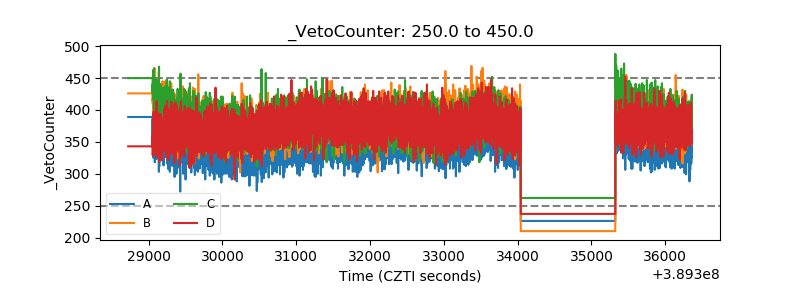 |