| Param | Original file | Final file |
|---|---|---|
| Filename | modeM0/AS1A09_029T02_9000005106_35670cztM0_level2.evt | modeM0/AS1A09_029T02_9000005106_35670cztM0_level2_quad_clean.evt |
| Size (bytes) | 424,033,920 | 57,312,000 |
| Size | 404.4 MB | 54.7 MB |
| Events in quadrant A | 2,564,879 | 350,114 |
| Events in quadrant B | 3,946,922 | 347,521 |
| Events in quadrant C | 3,085,774 | 339,610 |
| Events in quadrant D | 2,890,636 | 333,121 |
| Mode SS | |||
|---|---|---|---|
| Quadrant | BADHDUFLAG | Total packets | Discarded packets |
| A | 0 | 106 | 0 |
| B | 0 | 106 | 0 |
| C | 0 | 106 | 0 |
| D | 0 | 106 | 0 |
| Mode M0 | |||
|---|---|---|---|
| Quadrant | BADHDUFLAG | Total packets | Discarded packets |
| A | 0 | 10870 | 3 |
| B | 0 | 15085 | 2 |
| C | 0 | 12196 | 2 |
| D | 0 | 12090 | 2 |
| Mode M9 | |||
|---|---|---|---|
| Quadrant | BADHDUFLAG | Total packets | Discarded packets |
| A | 0 | 34 | 0 |
| B | 0 | 34 | 0 |
| C | 0 | 34 | 0 |
| D | 0 | 35 | 0 |
| Quadrant | Total seconds | Saturated seconds | Saturation percentage |
|---|---|---|---|
| A | 5203 | 9 | 0.172977% |
| B | 5203 | 483 | 9.283106% |
| C | 5203 | 162 | 3.113588% |
| D | 5203 | 103 | 1.979627% |
Noise dominated data is calculated using 1-second bins in cleaned event files. If a bin has >2000 counts, and if more than 50% of those come from <1% of pixels, then it is considered to be noise-dominated and hence unusable.
| Quadrant | # 1 sec bins | Bins with >0 counts | Bins with >2000 counts | High rate bins dominated by noise | Noise dominated (total time) | Noise dominated (detector-on time) | Marked lightcurve |
|---|---|---|---|---|---|---|---|
| A | 7115 | 5204 | 0 | 0 | 0.00% | 0.00% | 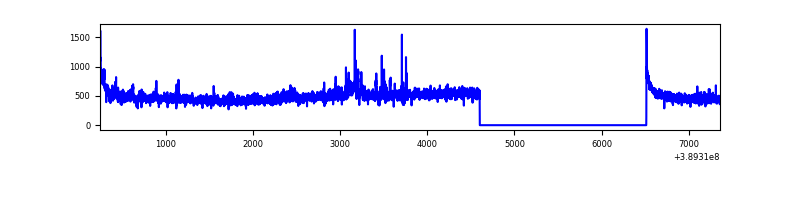 |
| B | 7115 | 5204 | 355 | 355 | 4.99% | 6.82% | 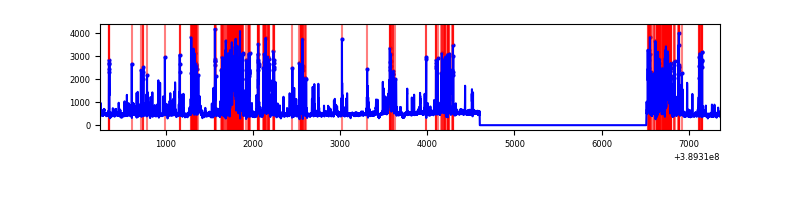 |
| C | 7115 | 5204 | 131 | 131 | 1.84% | 2.52% | 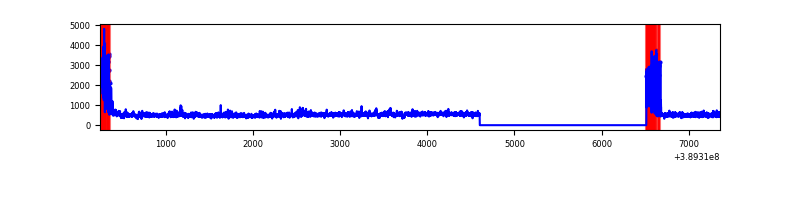 |
| D | 7115 | 5204 | 89 | 89 | 1.25% | 1.71% | 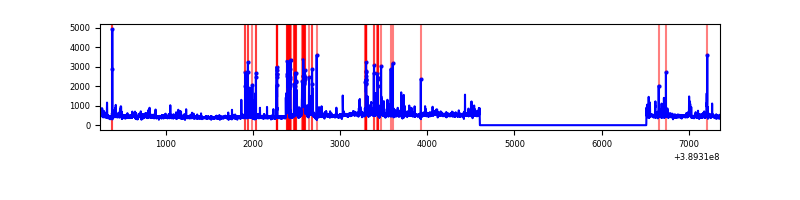 |
Top three noisy pixels from each quadrant. If the there are fewer than three noisy pixels in the level2.evt file, extra rows are filled as -1
| Pixel properties | Quadrant properties | ||||||
|---|---|---|---|---|---|---|---|
| Quadrant | DetID | PixID | Counts | Sigma | Mean | Median | Sigma |
| A | 10 | 83 | 139505 | 1144.7 | 596 | 584 | 121.4 |
| A | 15 | 169 | 79943 | 653.91 | 596 | 584 | 121.4 |
| A | 7 | 16 | 29501 | 238.27 | 596 | 584 | 121.4 |
| B | 5 | 172 | 1496439 | 13434.95 | 575 | 561 | 111.3 |
| B | 5 | 255 | 99206 | 885.96 | 575 | 561 | 111.3 |
| B | 5 | 31 | 29763 | 262.27 | 575 | 561 | 111.3 |
| C | 0 | 10 | 473274 | 3559.15 | 572 | 577 | 132.8 |
| C | 15 | 214 | 214340 | 1609.52 | 572 | 577 | 132.8 |
| C | 9 | 187 | 164145 | 1231.58 | 572 | 577 | 132.8 |
| D | 13 | 249 | 404666 | 2839.76 | 575 | 558 | 142.3 |
| D | 8 | 195 | 84874 | 592.51 | 575 | 558 | 142.3 |
| D | 7 | 80 | 56266 | 391.47 | 575 | 558 | 142.3 |
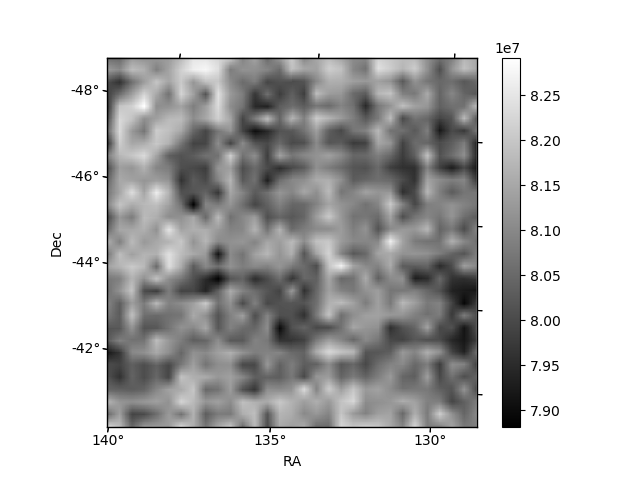
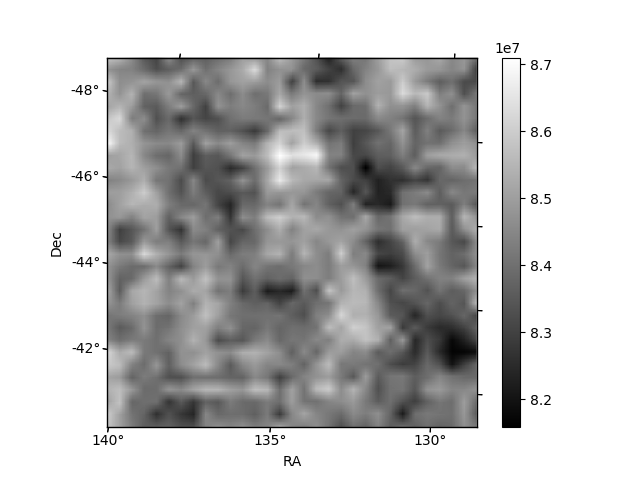
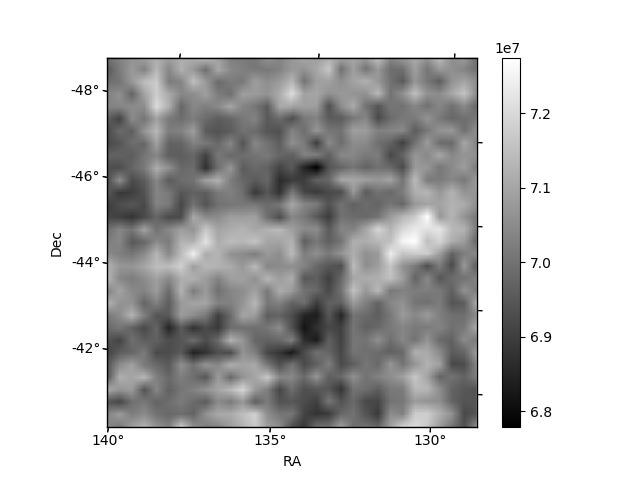
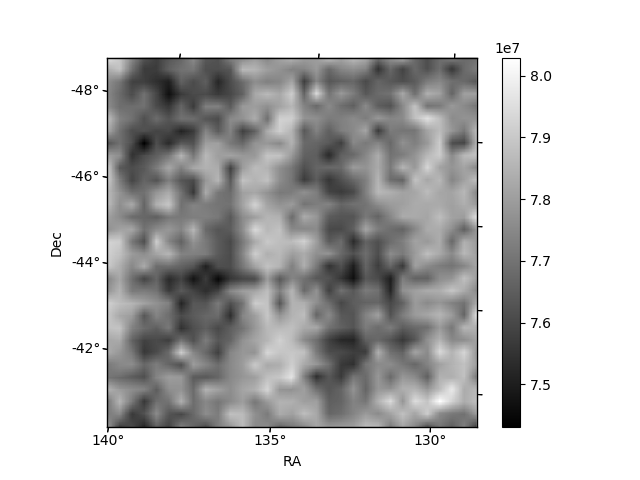
Histogram calculated using DETX and DETY for each event in the final _common_clean file
| Quadrant A | 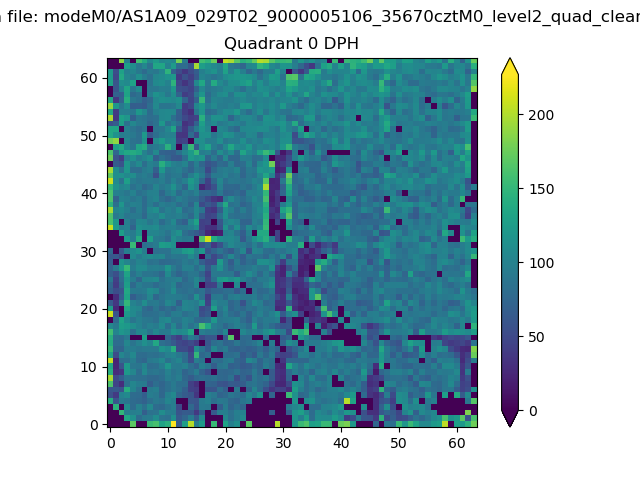 |
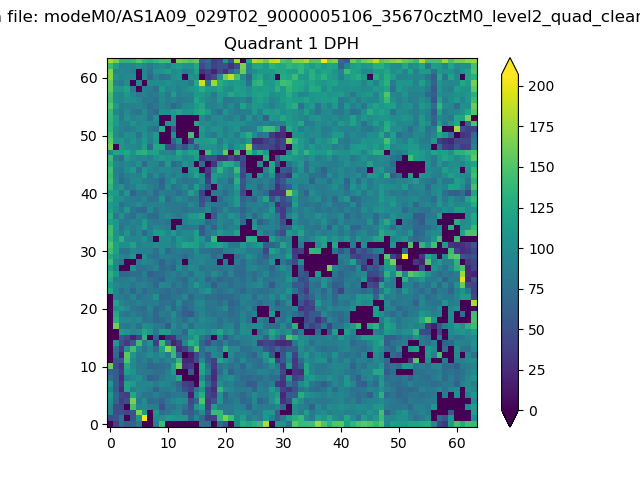 |
Quadrant B |
|---|---|---|---|
| Quadrant D | 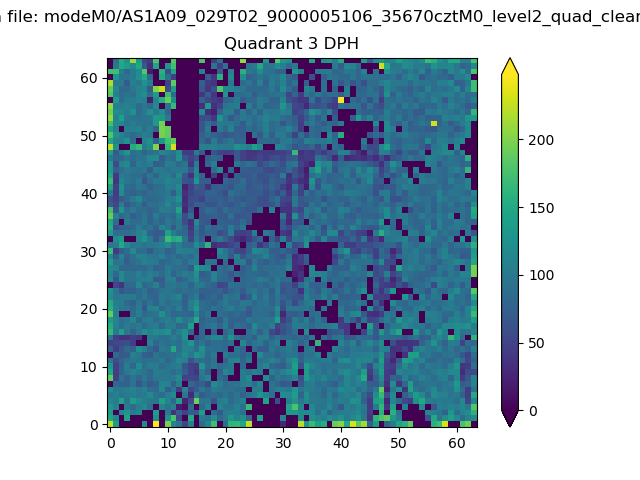 |
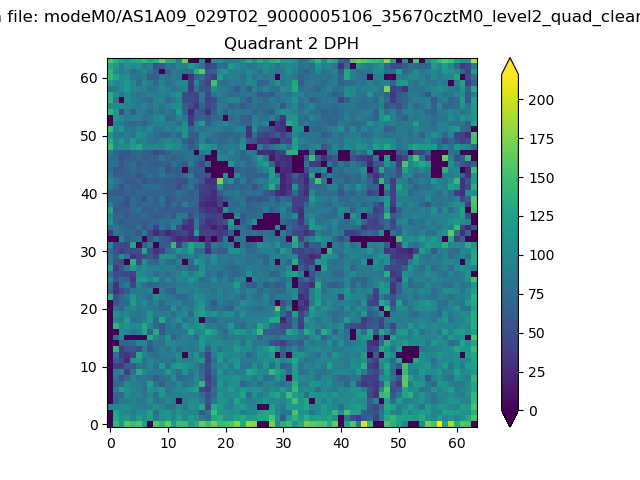 |
Quadrant C |
| Plot type | Count rate plots | Images |
|---|---|---|
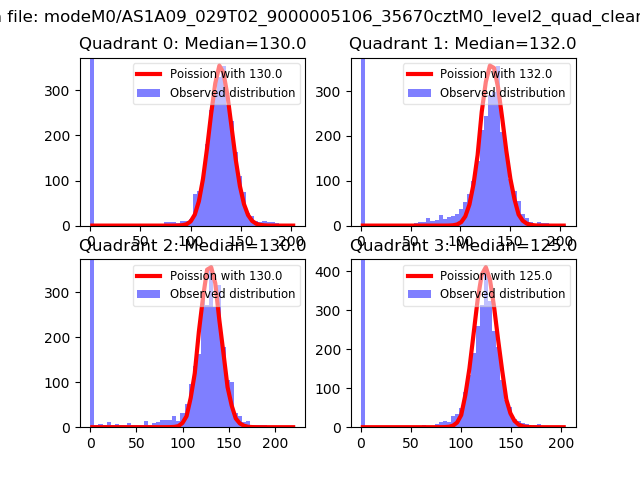
| Comparison with Poisson distribution Blue bars denote a histogram of data divided into 1 sec bins. Red curve is a Poisson curve with rate = median count rate of data. |
 |
 |
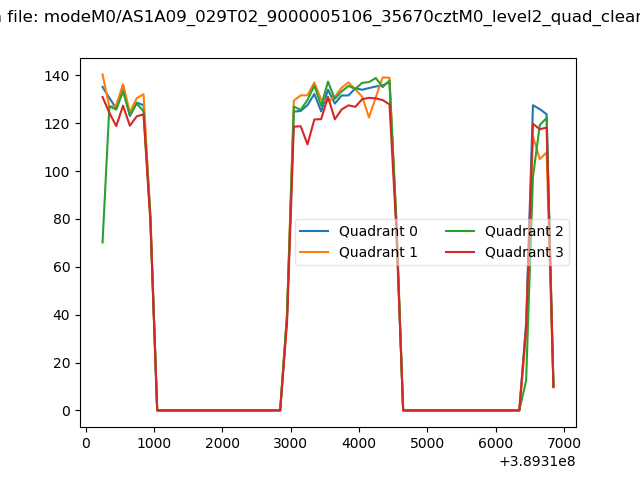
| Quadrant-wise count rates Data is divided into 100 sec bins |
 |
|
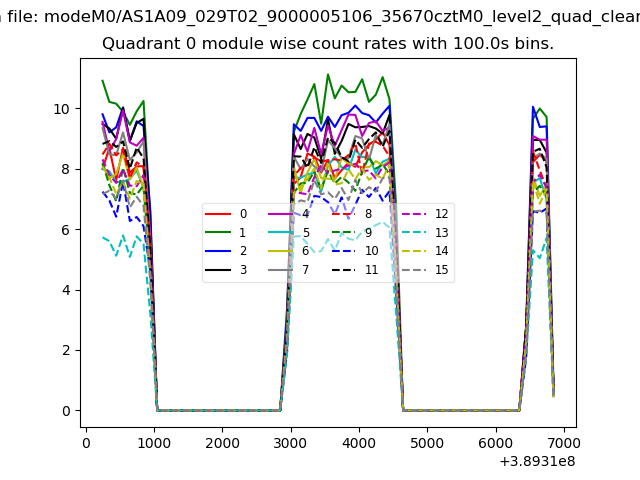
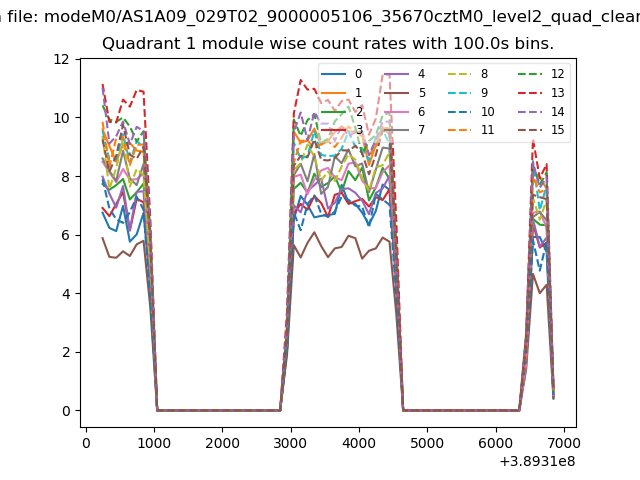
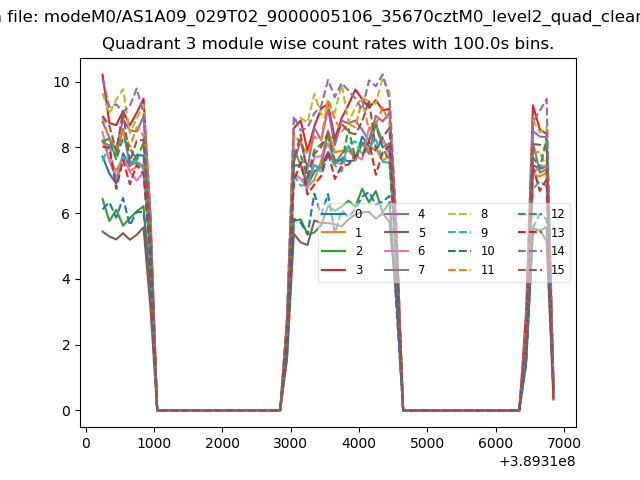
| Module-wise count rates for Quadrant A Data is divided into 100 sec bins |
 |
 |
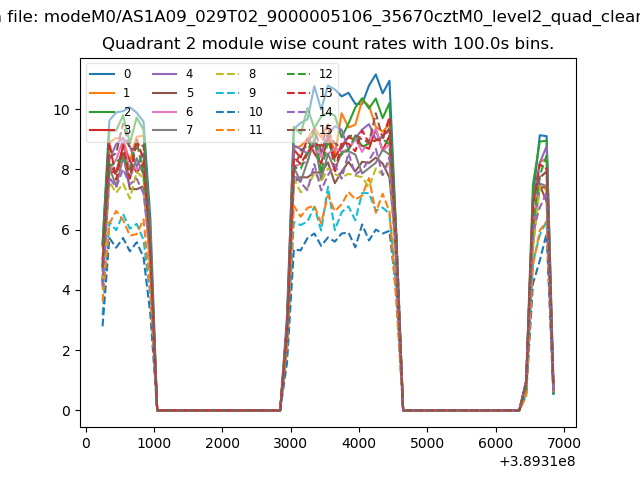
| Module-wise count rates for Quadrant B Data is divided into 100 sec bins |
 |
 |
| Module-wise count rates for Quadrant C Data is divided into 100 sec bins |
 |
 |
| Module-wise count rates for Quadrant D Data is divided into 100 sec bins |
 |
 |
| Parameter | Plot |
|---|---|
| CZT HV Monitor | 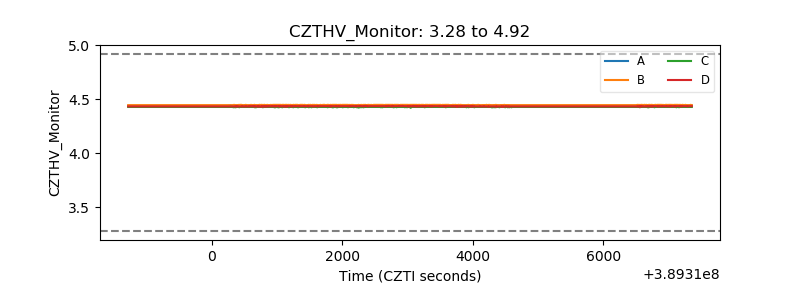 |
| D_VDD | 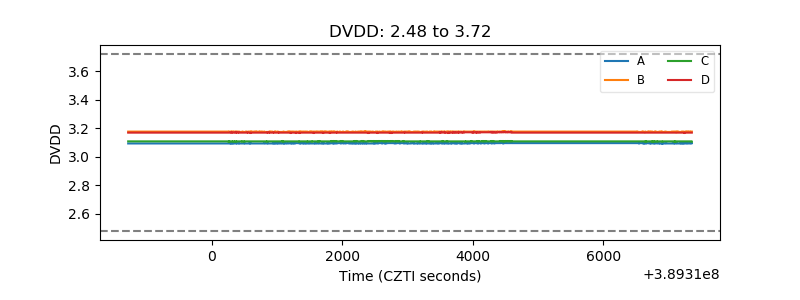 |
| Temperature 1 | 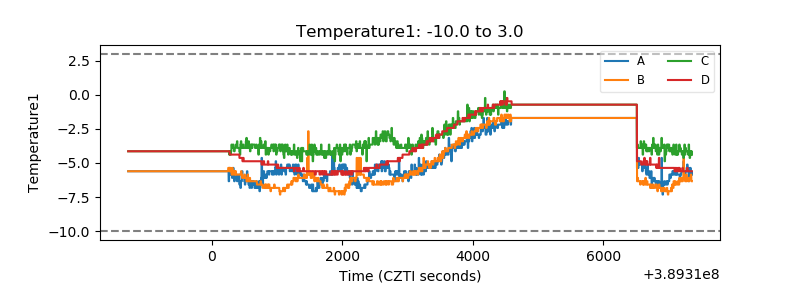 |
| Veto HV Monitor | 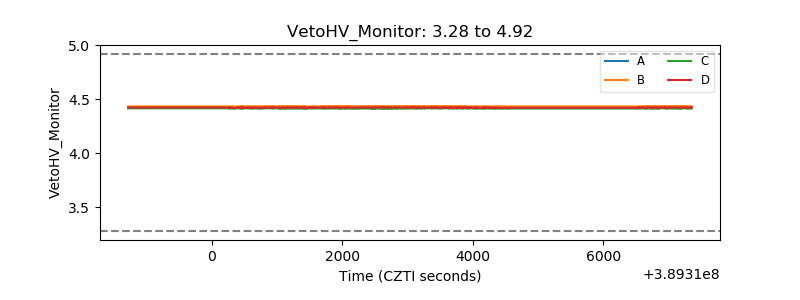 |
| Veto LLD | 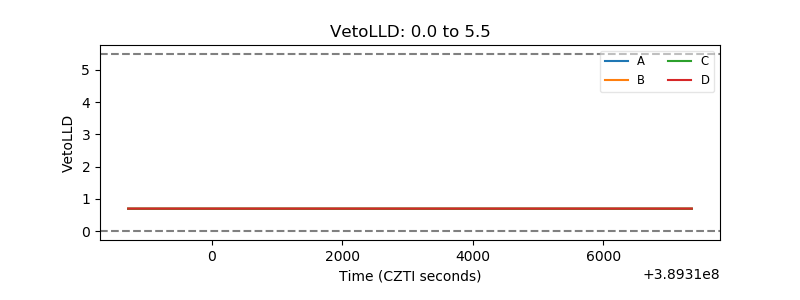 |
| Alpha Counter | 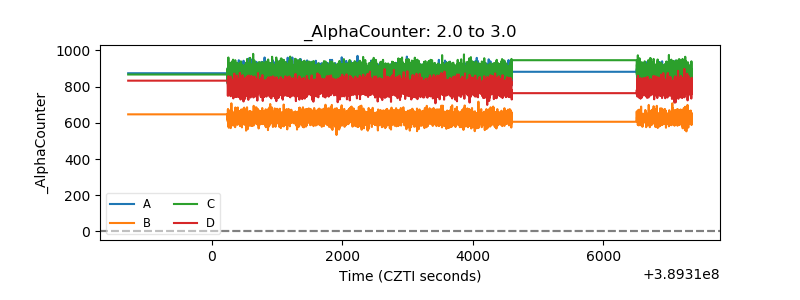 |
| _CPM_Rate | 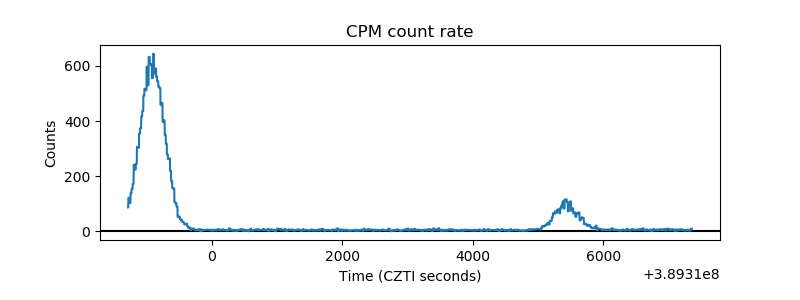 |
| CZT Counter | 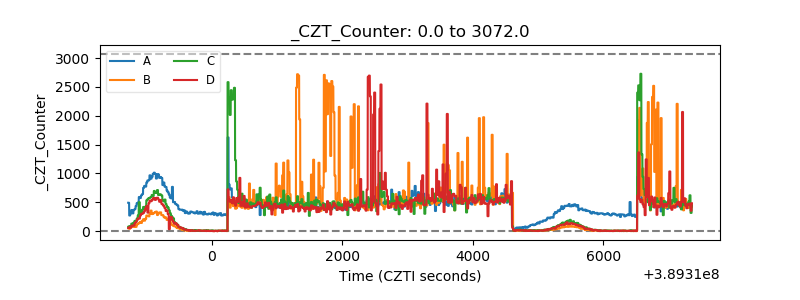 |
| +2.5 Volts monitor |  |
| +5 Volts monitor |  |
| _ROLL_ROT | 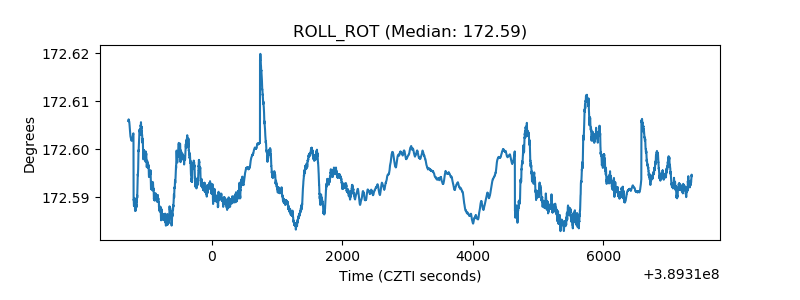 |
| _Roll_DEC | 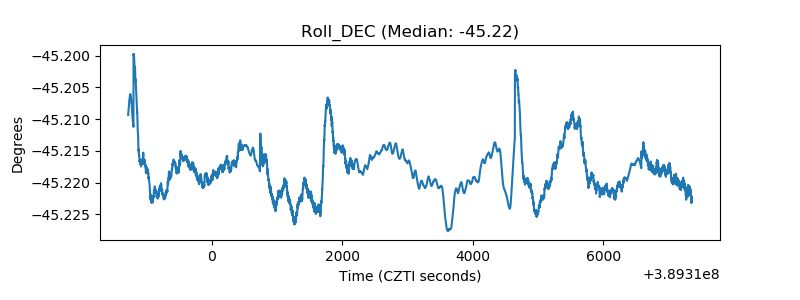 |
| _Roll_RA | 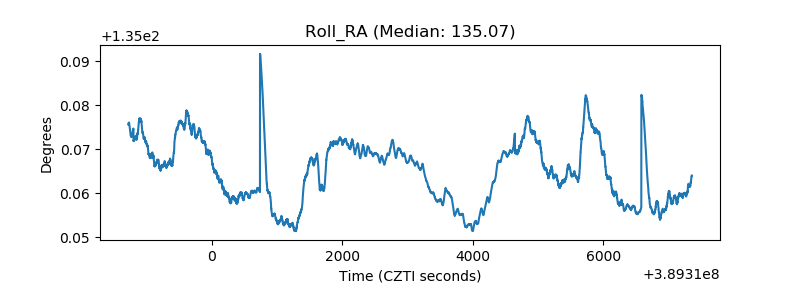 |
| Veto Counter | 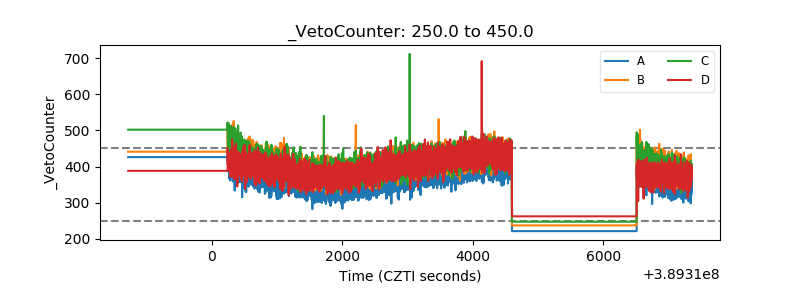 |