| Param | Original file | Final file |
|---|---|---|
| Filename | modeM0/AS1C07_001T07_9000005104_35664cztM0_level2.evt | modeM0/AS1C07_001T07_9000005104_35664cztM0_level2_quad_clean.evt |
| Size (bytes) | 467,530,560 | 83,280,960 |
| Size | 445.9 MB | 79.4 MB |
| Events in quadrant A | 2,677,750 | 545,248 |
| Events in quadrant B | 4,797,248 | 513,200 |
| Events in quadrant C | 3,253,770 | 549,106 |
| Events in quadrant D | 3,052,938 | 525,453 |
| Mode SS | |||
|---|---|---|---|
| Quadrant | BADHDUFLAG | Total packets | Discarded packets |
| A | 0 | 112 | 0 |
| B | 0 | 112 | 0 |
| C | 0 | 112 | 0 |
| D | 0 | 112 | 0 |
| Mode M9 | |||
|---|---|---|---|
| Quadrant | BADHDUFLAG | Total packets | Discarded packets |
| A | 0 | 26 | 0 |
| B | 0 | 26 | 0 |
| C | 0 | 26 | 0 |
| D | 0 | 27 | 0 |
| Mode M0 | |||
|---|---|---|---|
| Quadrant | BADHDUFLAG | Total packets | Discarded packets |
| A | 0 | 11594 | 3 |
| B | 0 | 17906 | 2 |
| C | 0 | 12924 | 2 |
| D | 0 | 12652 | 2 |
| Quadrant | Total seconds | Saturated seconds | Saturation percentage |
|---|---|---|---|
| A | 5560 | 10 | 0.179856% |
| B | 5560 | 738 | 13.273381% |
| C | 5560 | 139 | 2.500000% |
| D | 5560 | 74 | 1.330935% |
Noise dominated data is calculated using 1-second bins in cleaned event files. If a bin has >2000 counts, and if more than 50% of those come from <1% of pixels, then it is considered to be noise-dominated and hence unusable.
| Quadrant | # 1 sec bins | Bins with >0 counts | Bins with >2000 counts | High rate bins dominated by noise | Noise dominated (total time) | Noise dominated (detector-on time) | Marked lightcurve |
|---|---|---|---|---|---|---|---|
| A | 7293 | 5561 | 0 | 0 | 0.00% | 0.00% | 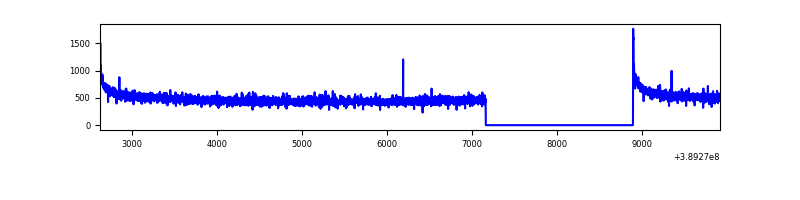 |
| B | 7293 | 5561 | 629 | 629 | 8.62% | 11.31% | 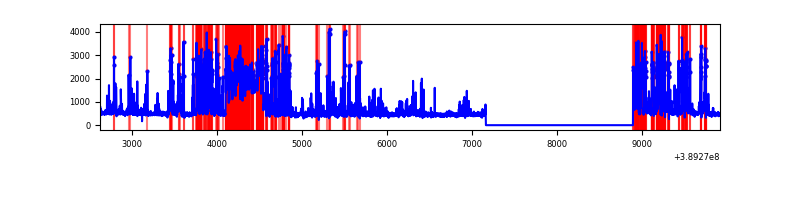 |
| C | 7293 | 5561 | 115 | 115 | 1.58% | 2.07% | 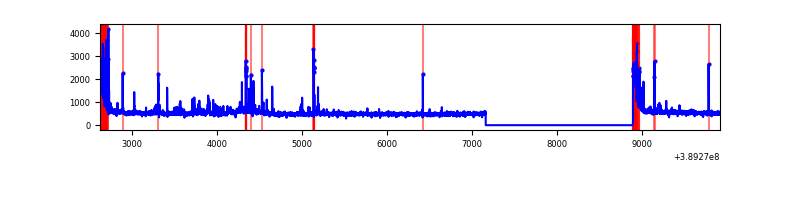 |
| D | 7293 | 5561 | 56 | 56 | 0.77% | 1.01% | 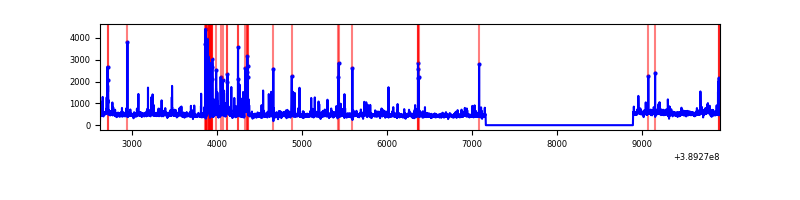 |
Top three noisy pixels from each quadrant. If the there are fewer than three noisy pixels in the level2.evt file, extra rows are filled as -1
| Pixel properties | Quadrant properties | ||||||
|---|---|---|---|---|---|---|---|
| Quadrant | DetID | PixID | Counts | Sigma | Mean | Median | Sigma |
| A | 10 | 83 | 152641 | 1159.12 | 649 | 636 | 131.1 |
| A | 13 | 6 | 13109 | 95.11 | 649 | 636 | 131.1 |
| A | 3 | 137 | 6721 | 46.4 | 649 | 636 | 131.1 |
| B | 5 | 172 | 2152505 | 18427.08 | 605 | 589 | 116.8 |
| B | 5 | 255 | 172563 | 1472.63 | 605 | 589 | 116.8 |
| B | 4 | 81 | 38510 | 324.72 | 605 | 589 | 116.8 |
| C | 0 | 10 | 353445 | 2449.16 | 628 | 632 | 144.1 |
| C | 15 | 214 | 231176 | 1600.39 | 628 | 632 | 144.1 |
| C | 1 | 23 | 110589 | 763.3 | 628 | 632 | 144.1 |
| D | 10 | 118 | 180631 | 1168.0 | 636 | 618 | 154.1 |
| D | 13 | 249 | 72527 | 466.58 | 636 | 618 | 154.1 |
| D | 2 | 249 | 56545 | 362.88 | 636 | 618 | 154.1 |
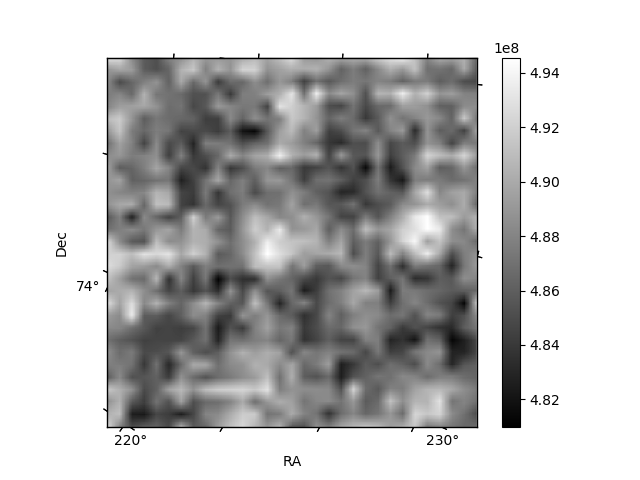
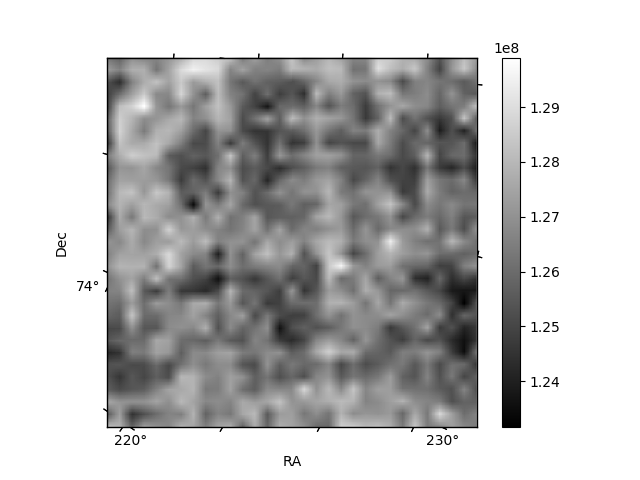
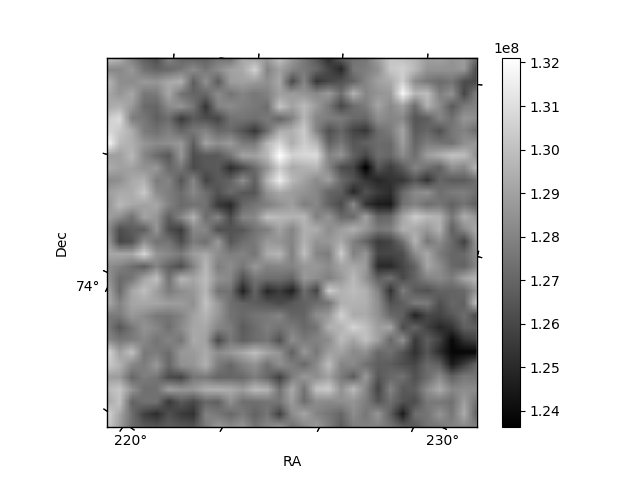
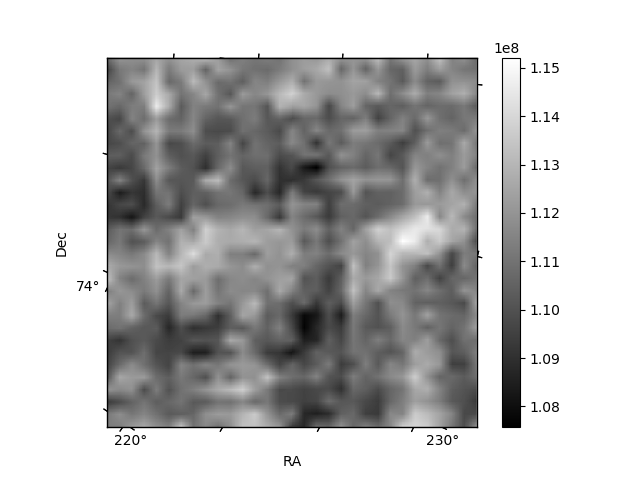
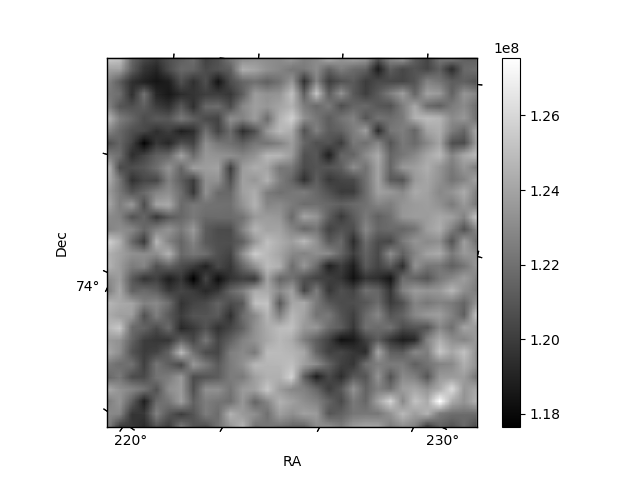
Histogram calculated using DETX and DETY for each event in the final _common_clean file
| Quadrant A | 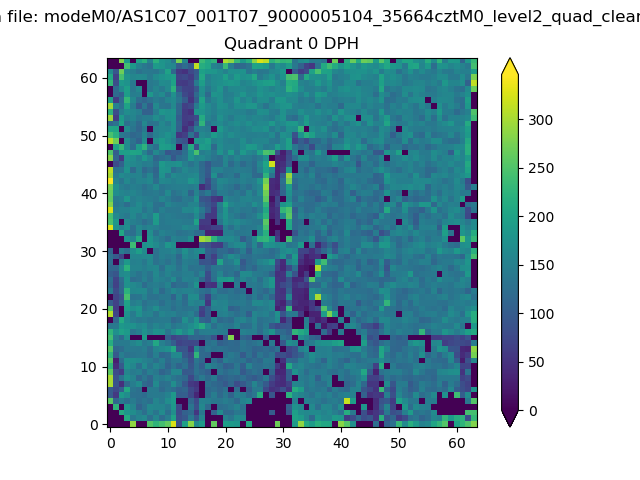 |
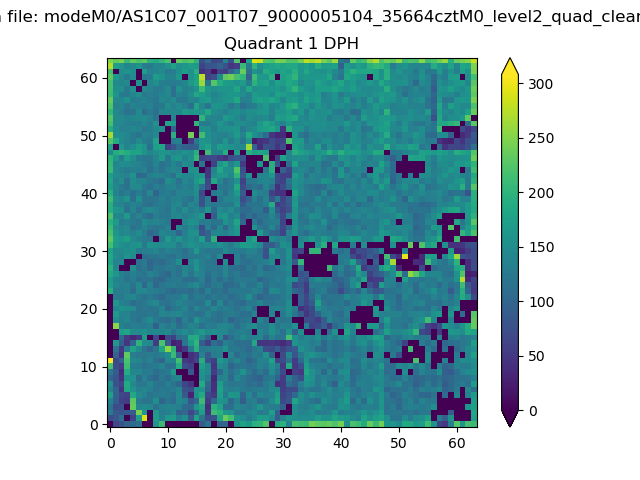 |
Quadrant B |
|---|---|---|---|
| Quadrant D | 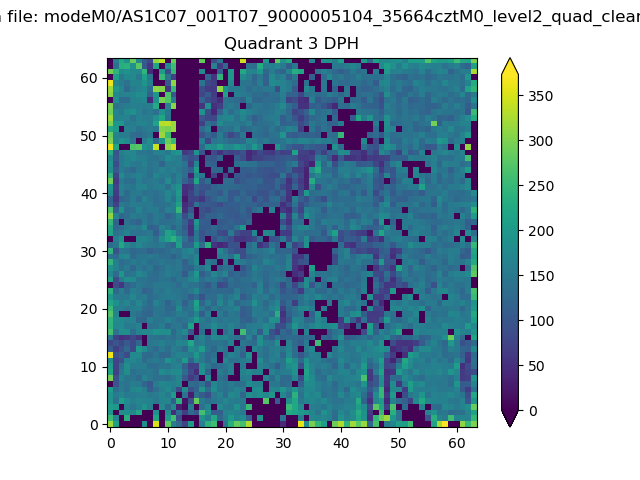 |
 |
Quadrant C |
| Plot type | Count rate plots | Images |
|---|---|---|
| Comparison with Poisson distribution Blue bars denote a histogram of data divided into 1 sec bins. Red curve is a Poisson curve with rate = median count rate of data. |
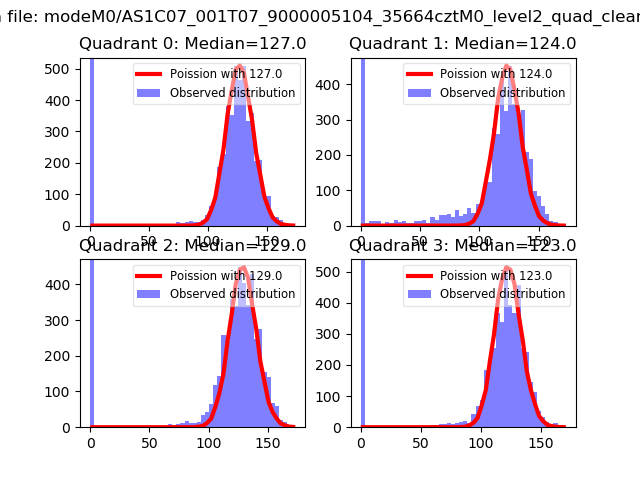 |
 |
| Quadrant-wise count rates Data is divided into 100 sec bins |
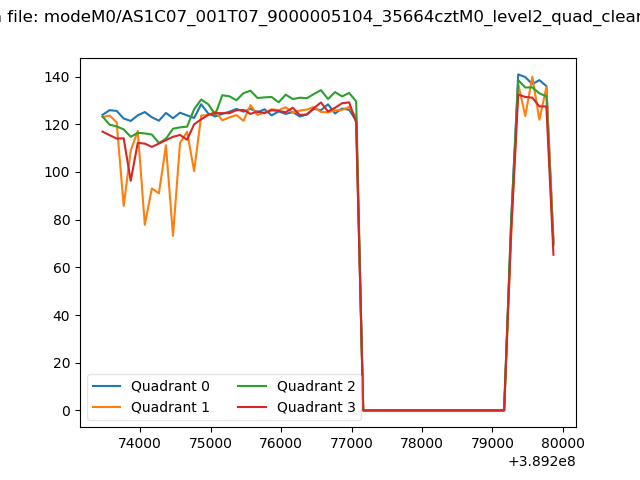 |
|
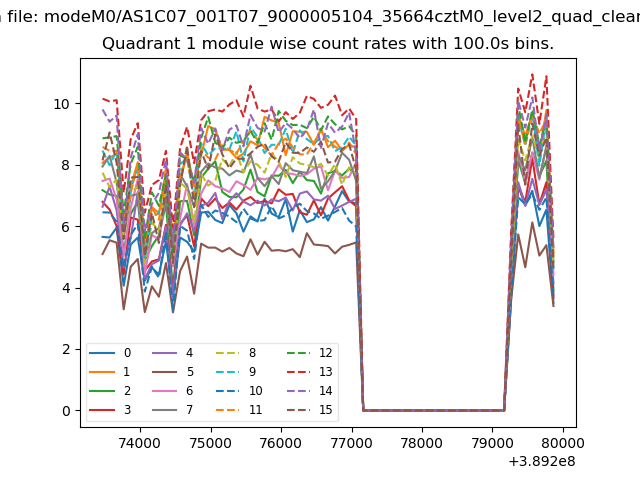
| Module-wise count rates for Quadrant A Data is divided into 100 sec bins |
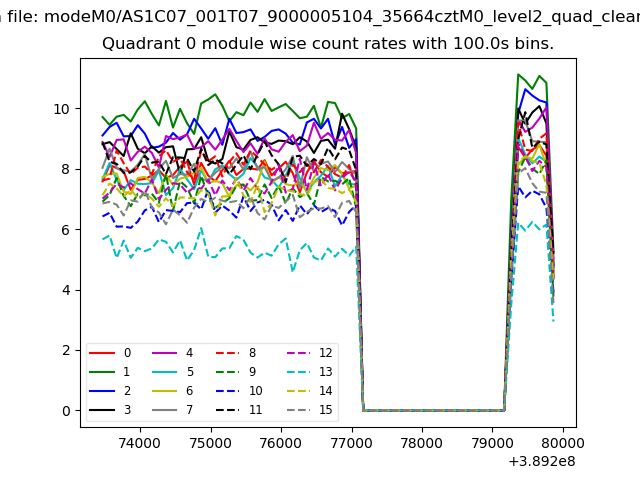 |
 |
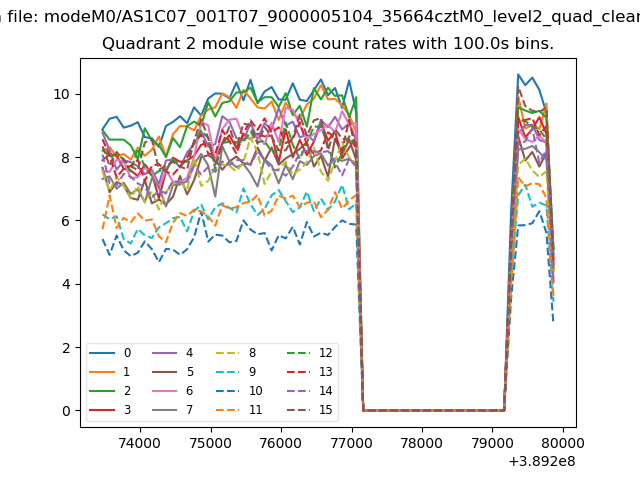
| Module-wise count rates for Quadrant B Data is divided into 100 sec bins |
 |
 |
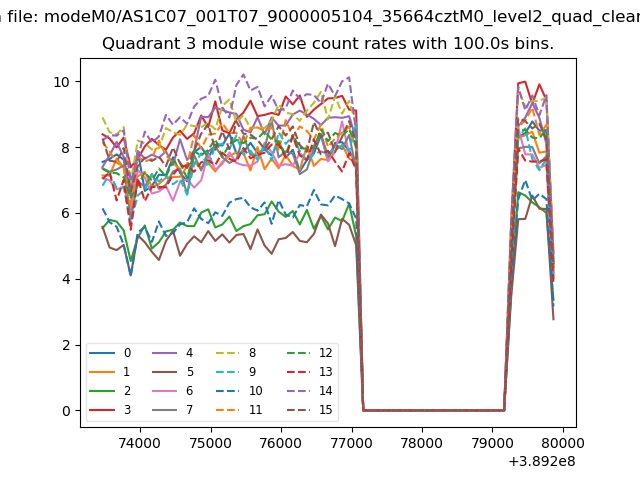
| Module-wise count rates for Quadrant C Data is divided into 100 sec bins |
 |
 |
| Module-wise count rates for Quadrant D Data is divided into 100 sec bins |
 |
 |
| Parameter | Plot |
|---|---|
| CZT HV Monitor | 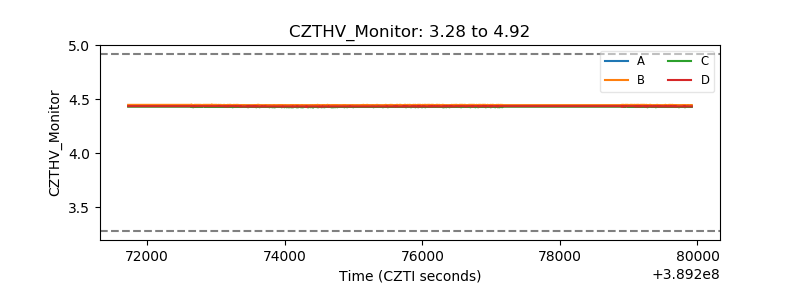 |
| D_VDD | 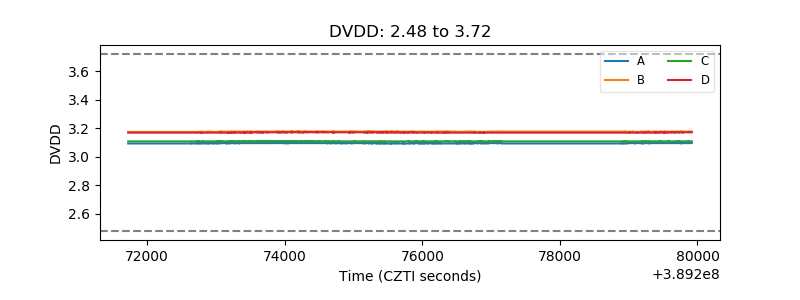 |
| Temperature 1 | 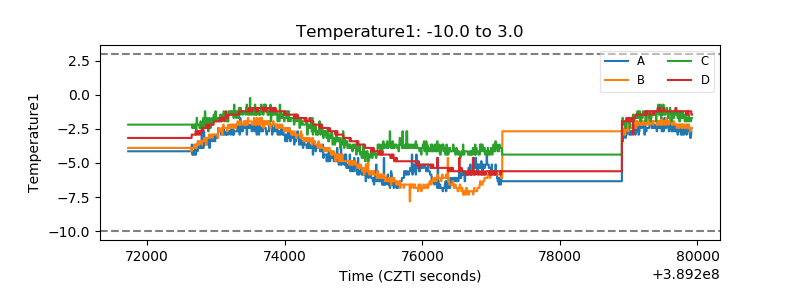 |
| Veto HV Monitor | 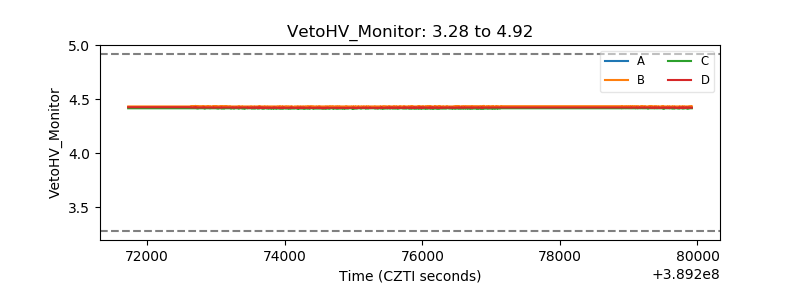 |
| Veto LLD | 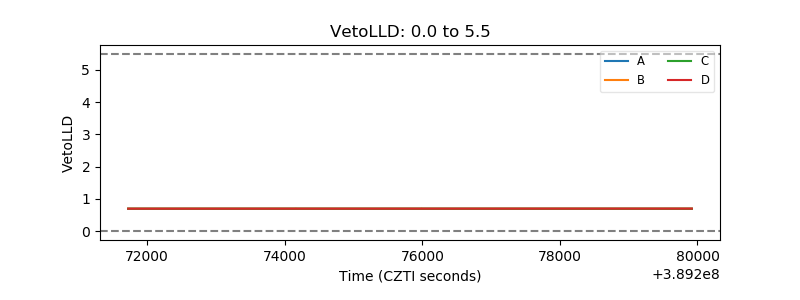 |
| Alpha Counter | 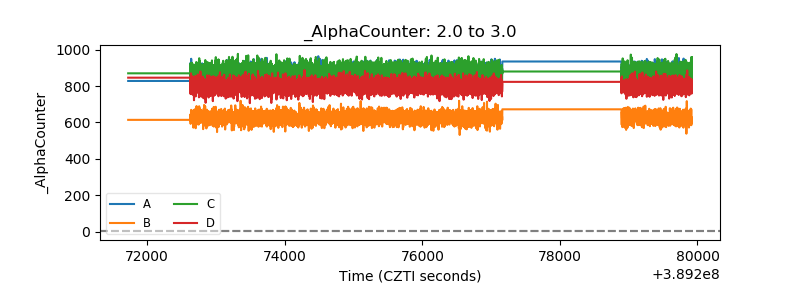 |
| _CPM_Rate | 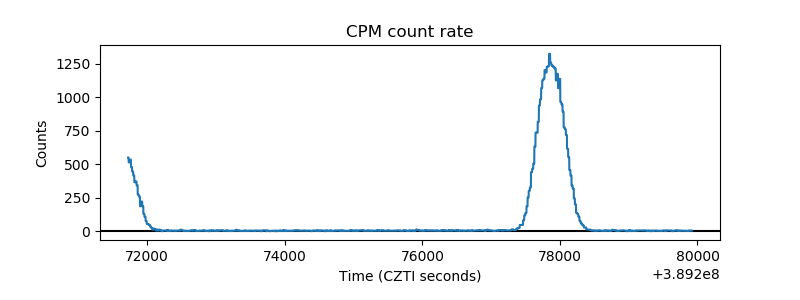 |
| CZT Counter | 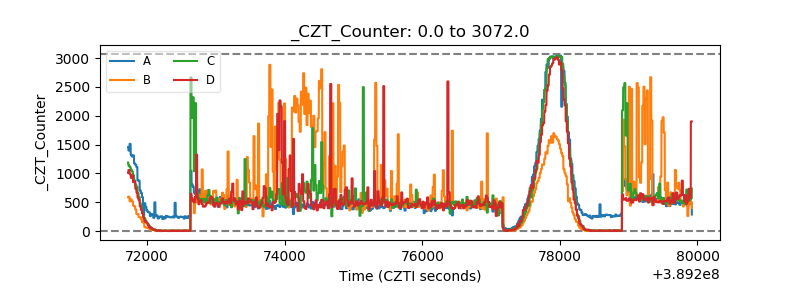 |
| +2.5 Volts monitor | 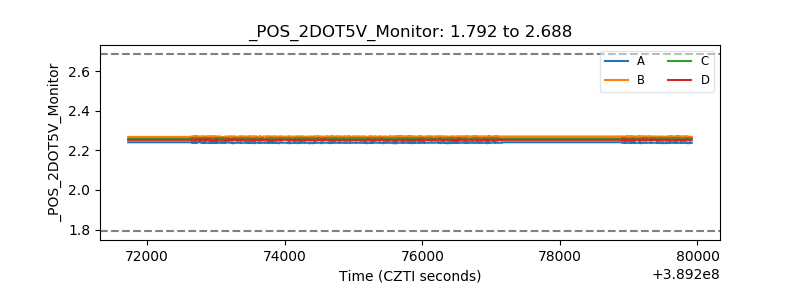 |
| +5 Volts monitor |  |
| _ROLL_ROT | 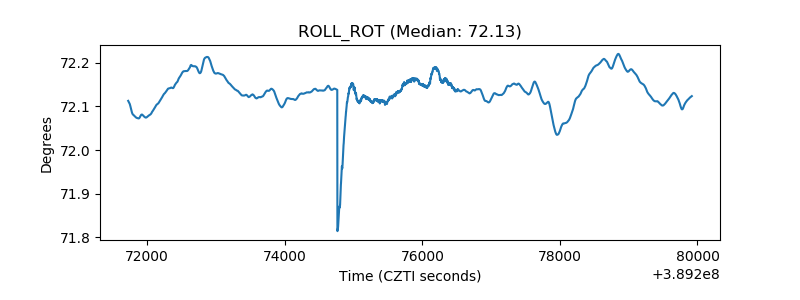 |
| _Roll_DEC | 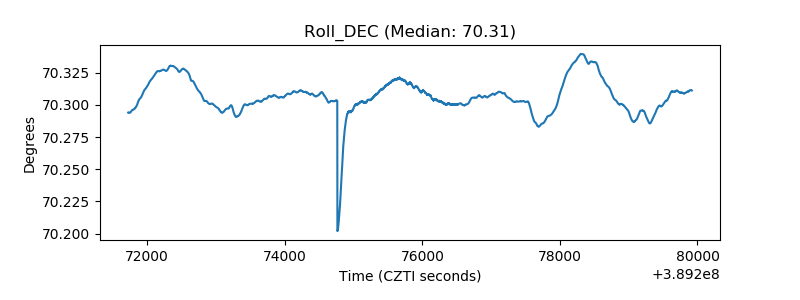 |
| _Roll_RA | 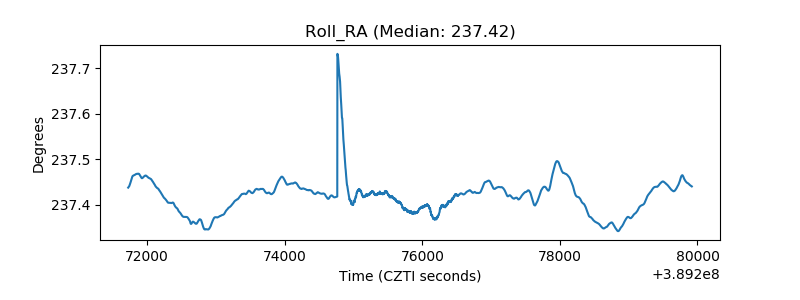 |
| Veto Counter | 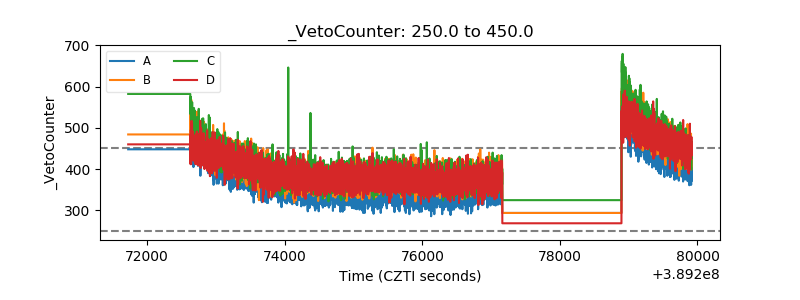 |