| Param | Original file | Final file |
|---|---|---|
| Filename | modeM0/AS1C07_001T07_9000005104_35662cztM0_level2.evt | modeM0/AS1C07_001T07_9000005104_35662cztM0_level2_quad_clean.evt |
| Size (bytes) | 3,618,907,200 | 462,254,400 |
| Size | 3.4 GB | 440.8 MB |
| Events in quadrant A | 42,239,809 | 2,788,504 |
| Events in quadrant B | 21,419,958 | 2,970,605 |
| Events in quadrant C | 19,461,121 | 3,068,729 |
| Events in quadrant D | 24,174,118 | 2,812,059 |
| Mode SS | |||
|---|---|---|---|
| Quadrant | BADHDUFLAG | Total packets | Discarded packets |
| A | 0 | 702 | 0 |
| B | 0 | 702 | 0 |
| C | 0 | 702 | 0 |
| D | 0 | 702 | 0 |
| Mode M9 | |||
|---|---|---|---|
| Quadrant | BADHDUFLAG | Total packets | Discarded packets |
| A | 0 | 103 | 0 |
| B | 0 | 103 | 0 |
| C | 0 | 103 | 0 |
| D | 0 | 103 | 0 |
| Mode M0 | |||
|---|---|---|---|
| Quadrant | BADHDUFLAG | Total packets | Discarded packets |
| A | 0 | 148526 | 8 |
| B | 0 | 86836 | 7 |
| C | 0 | 78598 | 7 |
| D | 0 | 95124 | 7 |
| Quadrant | Total seconds | Saturated seconds | Saturation percentage |
|---|---|---|---|
| A | 34316 | 6628 | 19.314605% |
| B | 34316 | 1678 | 4.889847% |
| C | 34316 | 658 | 1.917473% |
| D | 34316 | 2463 | 7.177410% |
Noise dominated data is calculated using 1-second bins in cleaned event files. If a bin has >2000 counts, and if more than 50% of those come from <1% of pixels, then it is considered to be noise-dominated and hence unusable.
| Quadrant | # 1 sec bins | Bins with >0 counts | Bins with >2000 counts | High rate bins dominated by noise | Noise dominated (total time) | Noise dominated (detector-on time) | Marked lightcurve |
|---|---|---|---|---|---|---|---|
| A | 44643 | 34322 | 6080 | 6080 | 13.62% | 17.71% | 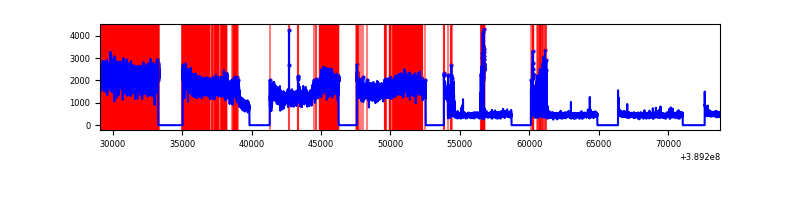 |
| B | 44643 | 34322 | 1109 | 1109 | 2.48% | 3.23% | 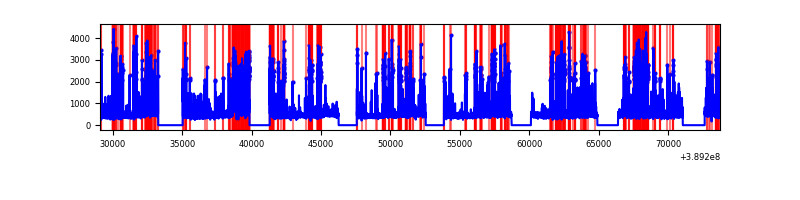 |
| C | 44643 | 34322 | 543 | 543 | 1.22% | 1.58% | 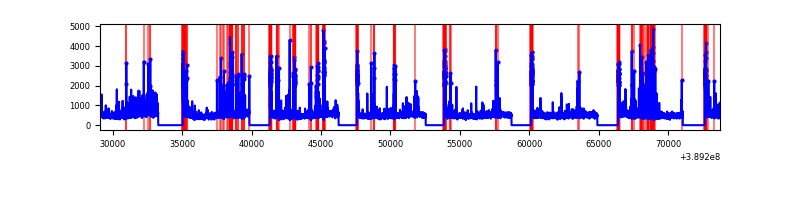 |
| D | 44643 | 34322 | 1975 | 1975 | 4.42% | 5.75% | 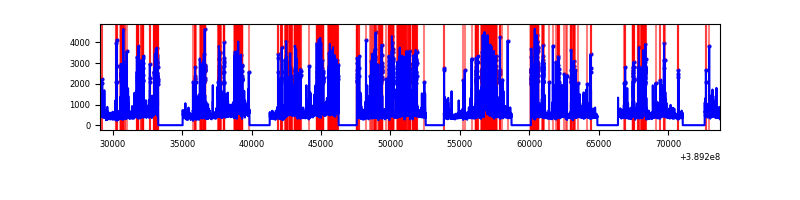 |
Top three noisy pixels from each quadrant. If the there are fewer than three noisy pixels in the level2.evt file, extra rows are filled as -1
| Pixel properties | Quadrant properties | ||||||
|---|---|---|---|---|---|---|---|
| Quadrant | DetID | PixID | Counts | Sigma | Mean | Median | Sigma |
| A | 15 | 169 | 26992181 | 36186.01 | 3736 | 3656 | 745.8 |
| A | 10 | 83 | 689821 | 920.0 | 3736 | 3656 | 745.8 |
| A | 13 | 6 | 65439 | 82.84 | 3736 | 3656 | 745.8 |
| B | 5 | 172 | 5095155 | 7159.09 | 3782 | 3673 | 711.2 |
| B | 5 | 255 | 1019891 | 1428.9 | 3782 | 3673 | 711.2 |
| B | 15 | 85 | 123844 | 168.97 | 3782 | 3673 | 711.2 |
| C | 0 | 10 | 1521092 | 1760.82 | 3785 | 3804 | 861.7 |
| C | 15 | 214 | 1396801 | 1616.58 | 3785 | 3804 | 861.7 |
| C | 1 | 23 | 1081259 | 1250.39 | 3785 | 3804 | 861.7 |
| D | 10 | 118 | 3492546 | 3909.85 | 3678 | 3574 | 892.4 |
| D | 13 | 249 | 2461331 | 2754.24 | 3678 | 3574 | 892.4 |
| D | 2 | 249 | 932800 | 1041.32 | 3678 | 3574 | 892.4 |
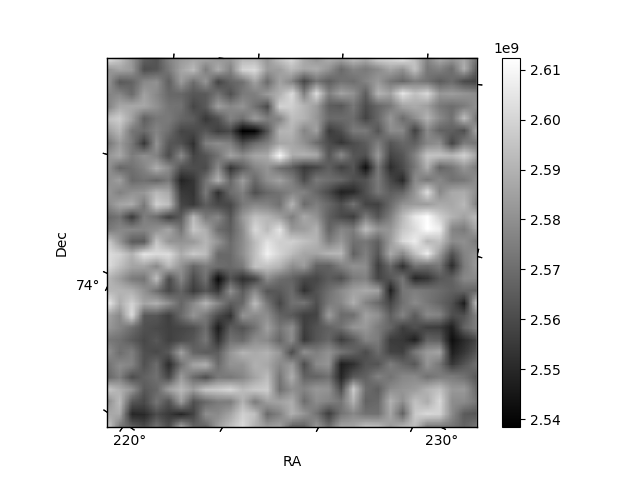
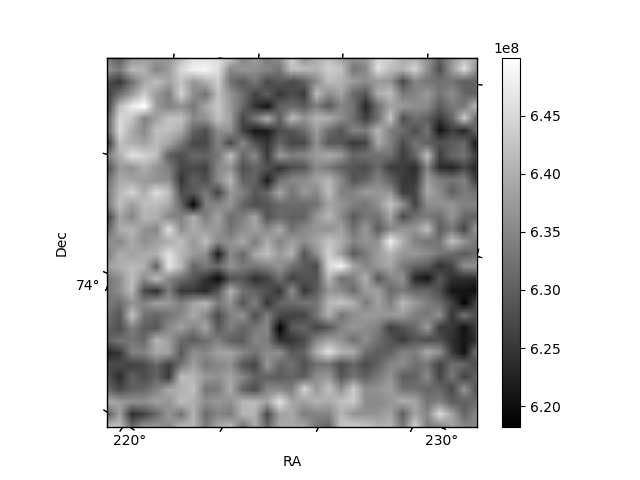
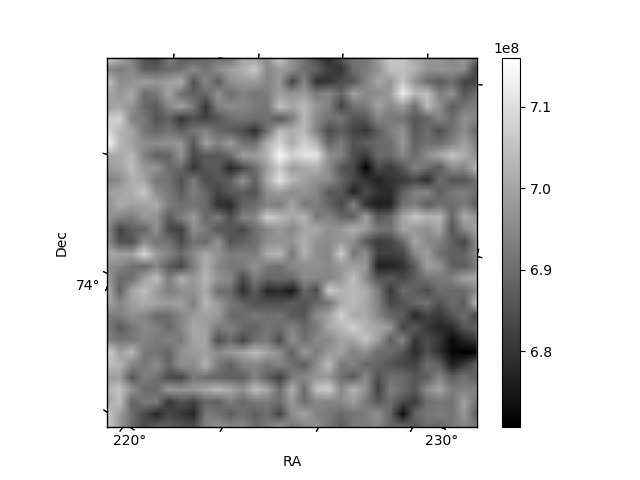
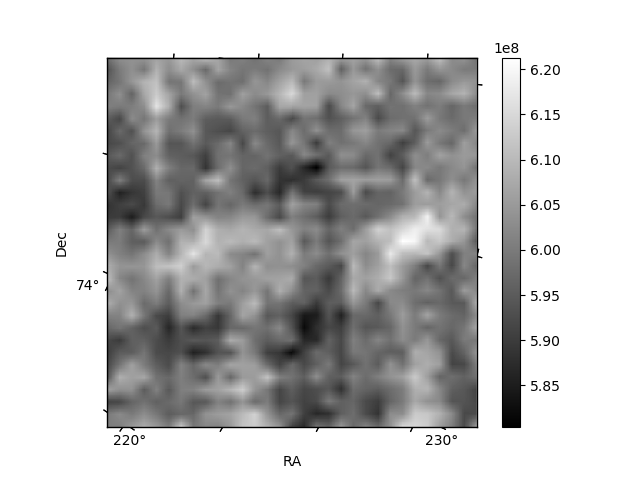
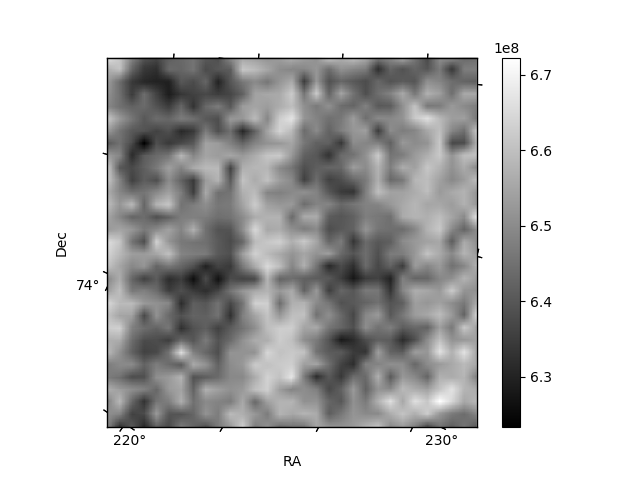
Histogram calculated using DETX and DETY for each event in the final _common_clean file
| Quadrant A | 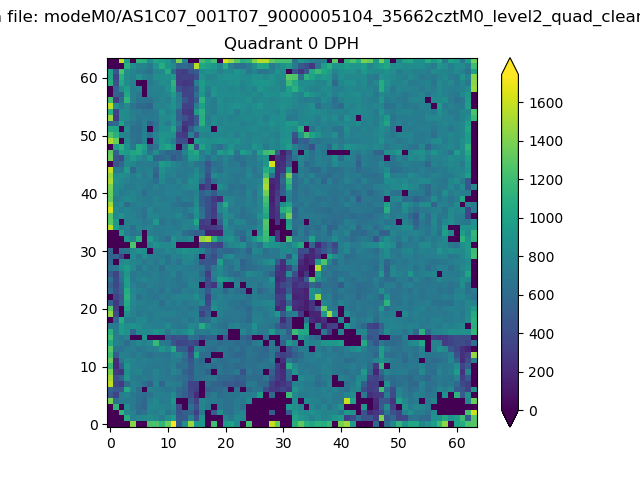 |
 |
Quadrant B |
|---|---|---|---|
| Quadrant D | 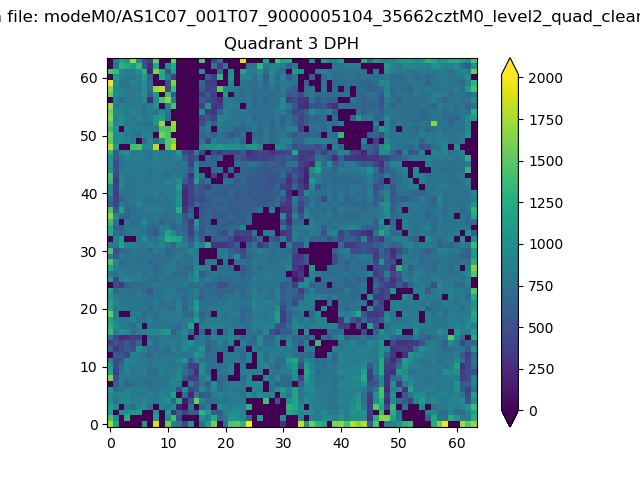 |
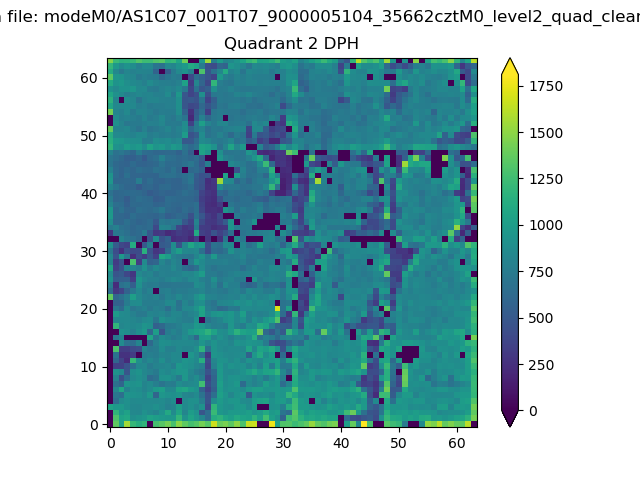 |
Quadrant C |
| Plot type | Count rate plots | Images |
|---|---|---|
| Comparison with Poisson distribution Blue bars denote a histogram of data divided into 1 sec bins. Red curve is a Poisson curve with rate = median count rate of data. |
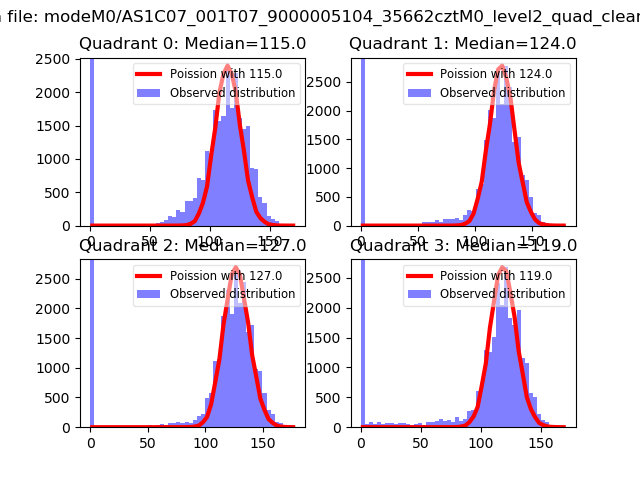 |
 |
| Quadrant-wise count rates Data is divided into 100 sec bins |
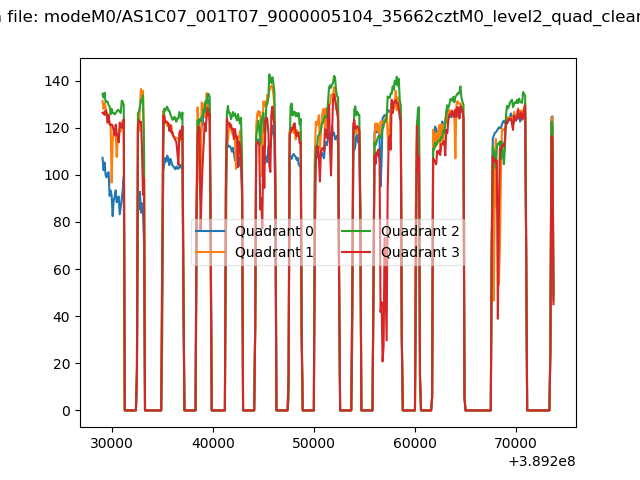 |
|
| Module-wise count rates for Quadrant A Data is divided into 100 sec bins |
 |
 |
| Module-wise count rates for Quadrant B Data is divided into 100 sec bins |
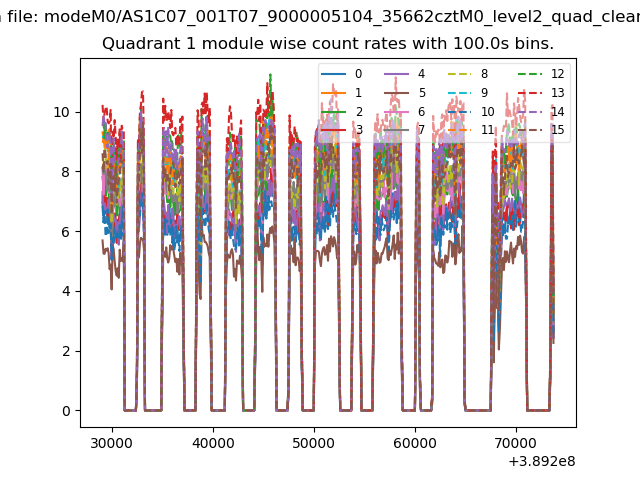 |
 |
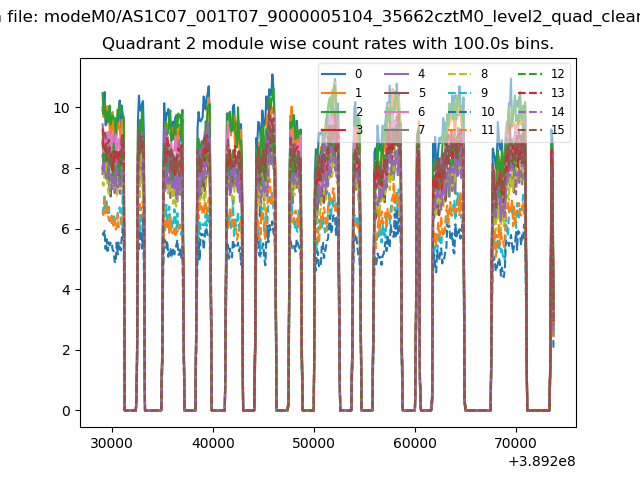
| Module-wise count rates for Quadrant C Data is divided into 100 sec bins |
 |
 |
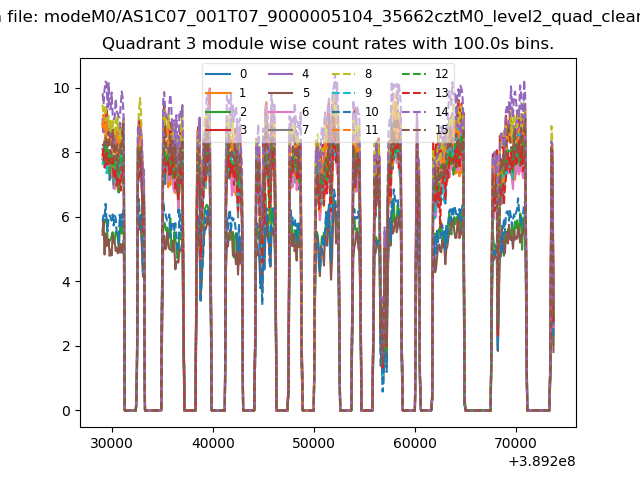
| Module-wise count rates for Quadrant D Data is divided into 100 sec bins |
 |
 |
| Parameter | Plot |
|---|---|
| CZT HV Monitor | 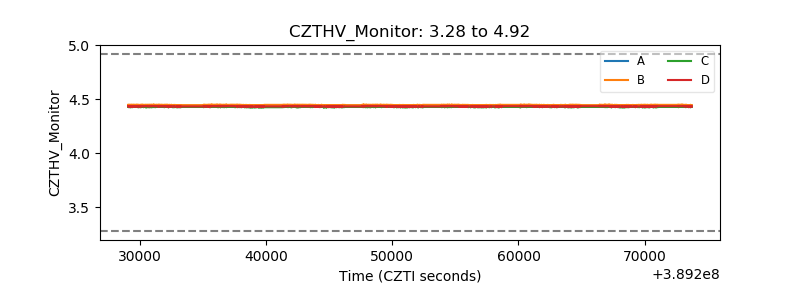 |
| D_VDD | 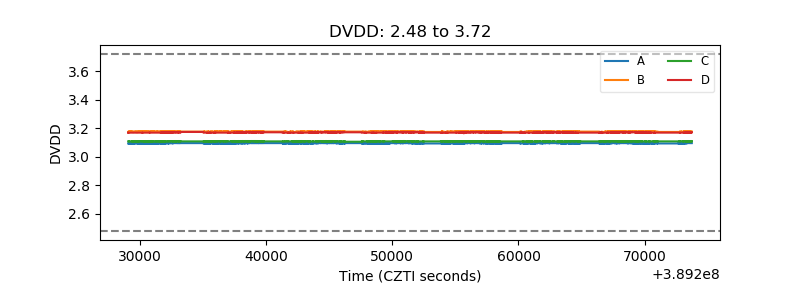 |
| Temperature 1 | 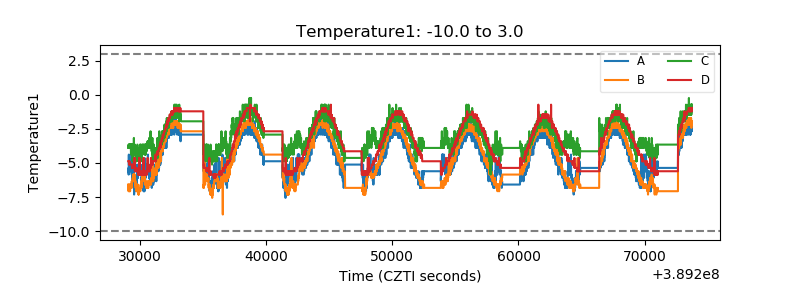 |
| Veto HV Monitor | 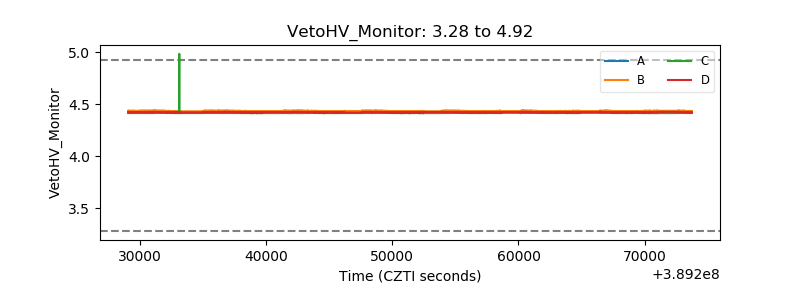 |
| Veto LLD | 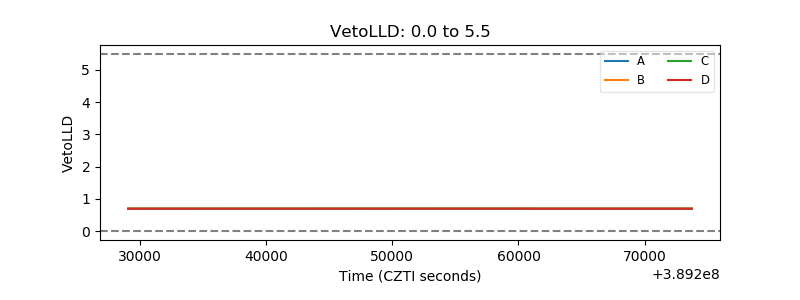 |
| Alpha Counter | 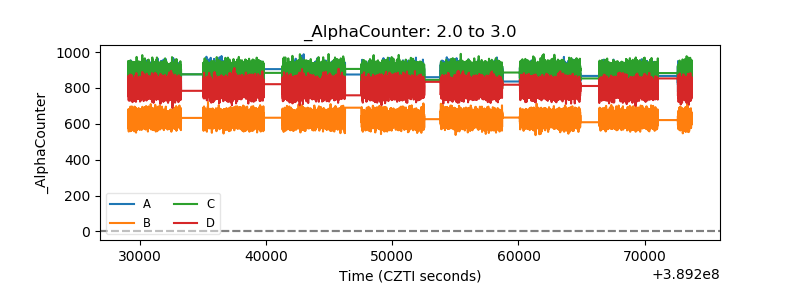 |
| _CPM_Rate | 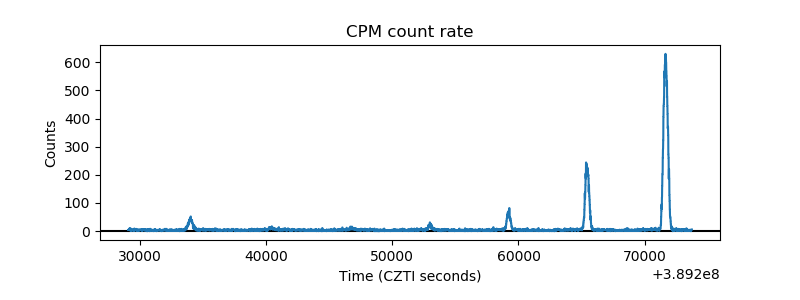 |
| CZT Counter | 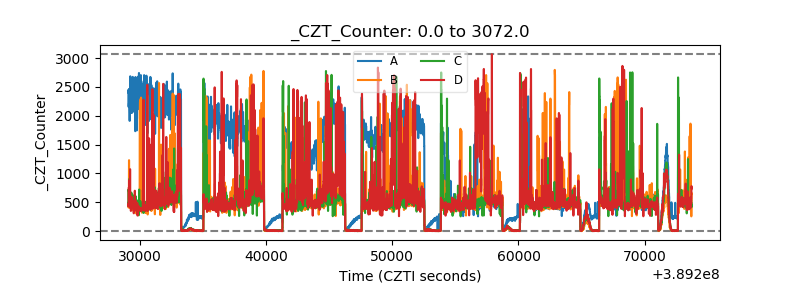 |
| +2.5 Volts monitor | 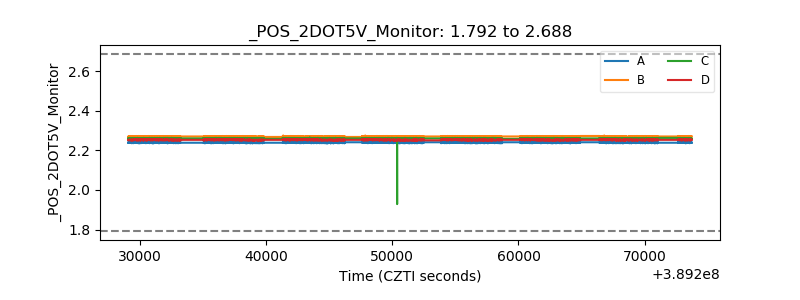 |
| +5 Volts monitor | 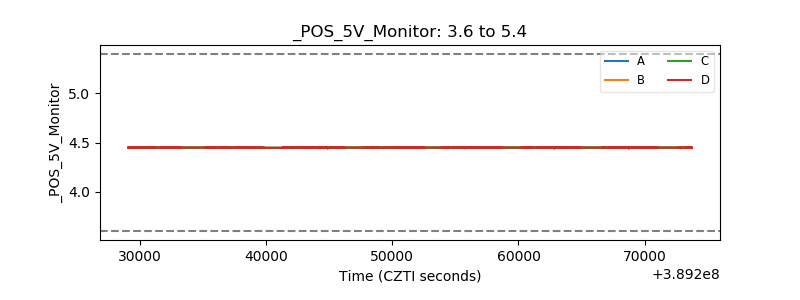 |
| _ROLL_ROT | 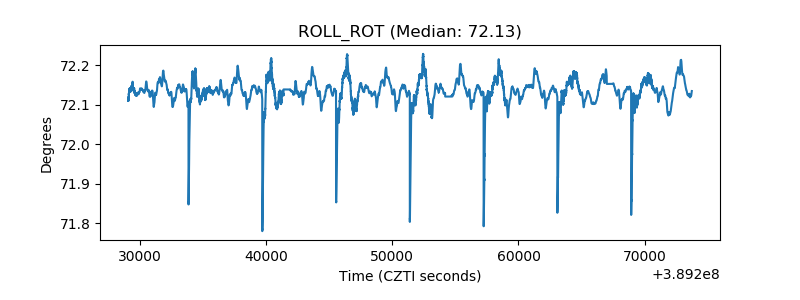 |
| _Roll_DEC | 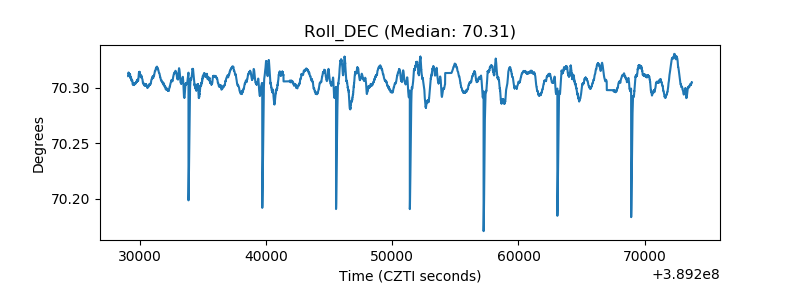 |
| _Roll_RA | 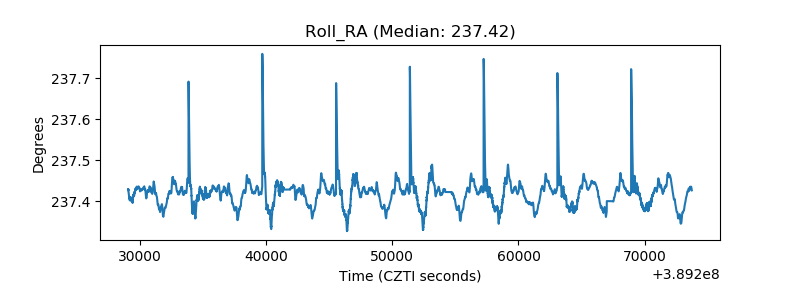 |
| Veto Counter | 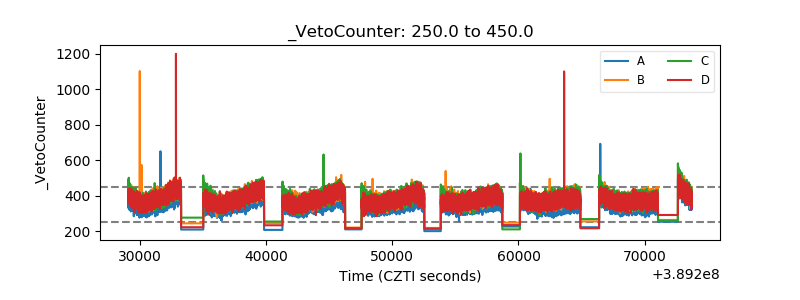 |