| Param | Original file | Final file |
|---|---|---|
| Filename | modeM0/AS1C07_001T07_9000005104_35658cztM0_level2.evt | modeM0/AS1C07_001T07_9000005104_35658cztM0_level2_quad_clean.evt |
| Size (bytes) | 724,299,840 | 91,005,120 |
| Size | 690.7 MB | 86.8 MB |
| Events in quadrant A | 9,421,930 | 545,652 |
| Events in quadrant B | 3,711,971 | 595,543 |
| Events in quadrant C | 3,584,844 | 614,944 |
| Events in quadrant D | 4,800,347 | 567,620 |
| Mode SS | |||
|---|---|---|---|
| Quadrant | BADHDUFLAG | Total packets | Discarded packets |
| A | 0 | 128 | 0 |
| B | 0 | 128 | 0 |
| C | 0 | 128 | 0 |
| D | 0 | 128 | 0 |
| Mode M9 | |||
|---|---|---|---|
| Quadrant | BADHDUFLAG | Total packets | Discarded packets |
| A | 0 | 27 | 0 |
| B | 0 | 27 | 0 |
| C | 0 | 27 | 0 |
| D | 0 | 27 | 0 |
| Mode M0 | |||
|---|---|---|---|
| Quadrant | BADHDUFLAG | Total packets | Discarded packets |
| A | 0 | 32288 | 3 |
| B | 0 | 15238 | 2 |
| C | 0 | 14519 | 2 |
| D | 0 | 18712 | 2 |
| Quadrant | Total seconds | Saturated seconds | Saturation percentage |
|---|---|---|---|
| A | 6180 | 1011 | 16.359223% |
| B | 6180 | 277 | 4.482201% |
| C | 6180 | 161 | 2.605178% |
| D | 6180 | 478 | 7.734628% |
Noise dominated data is calculated using 1-second bins in cleaned event files. If a bin has >2000 counts, and if more than 50% of those come from <1% of pixels, then it is considered to be noise-dominated and hence unusable.
| Quadrant | # 1 sec bins | Bins with >0 counts | Bins with >2000 counts | High rate bins dominated by noise | Noise dominated (total time) | Noise dominated (detector-on time) | Marked lightcurve |
|---|---|---|---|---|---|---|---|
| A | 8956 | 6182 | 731 | 731 | 8.16% | 11.82% | 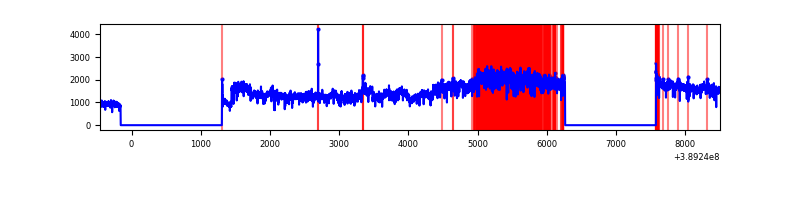 |
| B | 8956 | 6182 | 179 | 179 | 2.00% | 2.90% | 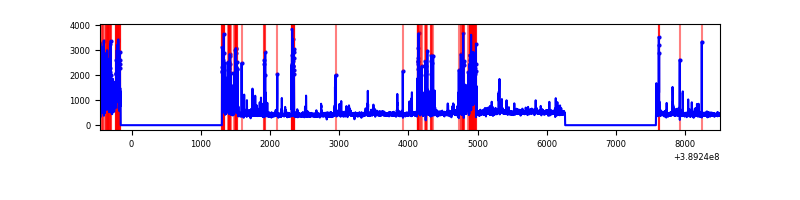 |
| C | 8956 | 6182 | 138 | 138 | 1.54% | 2.23% | 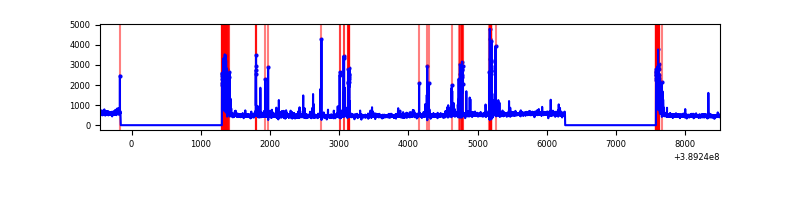 |
| D | 8956 | 6182 | 386 | 386 | 4.31% | 6.24% | 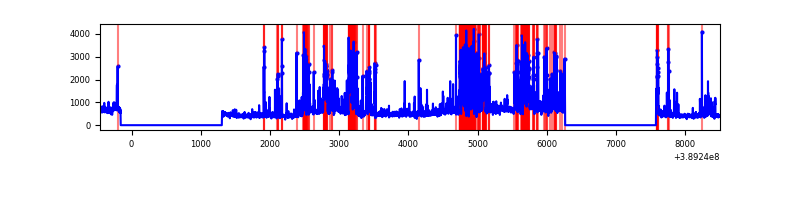 |
Top three noisy pixels from each quadrant. If the there are fewer than three noisy pixels in the level2.evt file, extra rows are filled as -1
| Pixel properties | Quadrant properties | ||||||
|---|---|---|---|---|---|---|---|
| Quadrant | DetID | PixID | Counts | Sigma | Mean | Median | Sigma |
| A | 15 | 169 | 6637172 | 48596.65 | 673 | 656 | 136.6 |
| A | 10 | 83 | 156659 | 1142.35 | 673 | 656 | 136.6 |
| A | 13 | 6 | 11344 | 78.26 | 673 | 656 | 136.6 |
| B | 5 | 172 | 639754 | 4883.59 | 683 | 663 | 130.9 |
| B | 5 | 255 | 324389 | 2473.74 | 683 | 663 | 130.9 |
| B | 5 | 200 | 20829 | 154.1 | 683 | 663 | 130.9 |
| C | 0 | 10 | 357691 | 2286.03 | 680 | 685 | 156.2 |
| C | 1 | 23 | 260438 | 1663.29 | 680 | 685 | 156.2 |
| C | 15 | 214 | 255417 | 1631.14 | 680 | 685 | 156.2 |
| D | 10 | 118 | 694788 | 4305.01 | 661 | 641 | 161.2 |
| D | 13 | 249 | 655803 | 4063.23 | 661 | 641 | 161.2 |
| D | 1 | 52 | 333897 | 2066.81 | 661 | 641 | 161.2 |
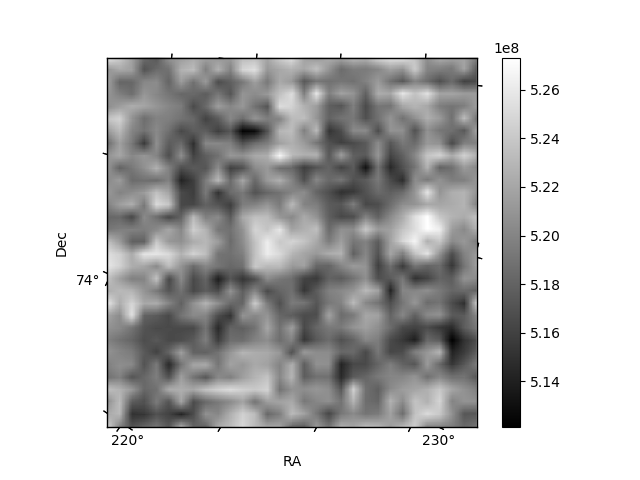
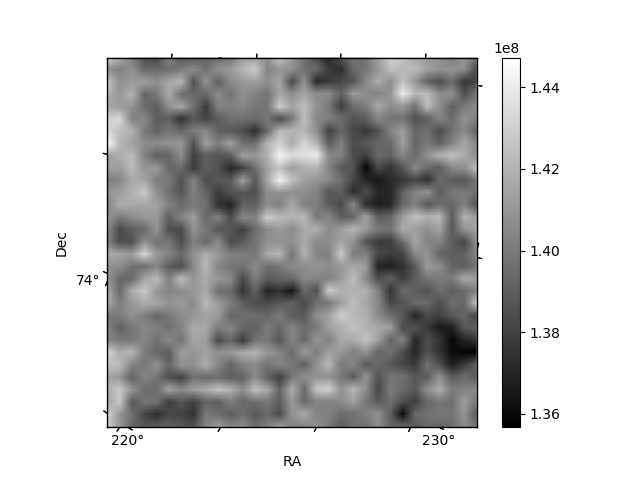
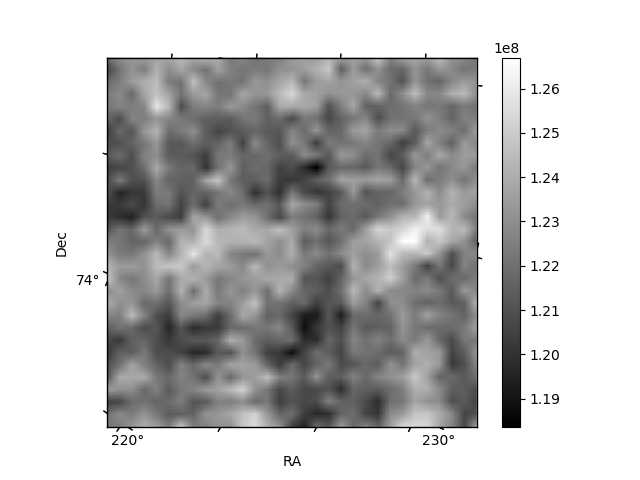
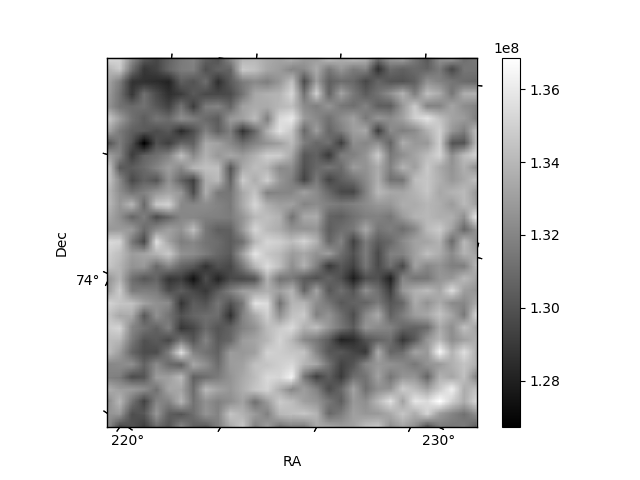
Histogram calculated using DETX and DETY for each event in the final _common_clean file
| Quadrant A | 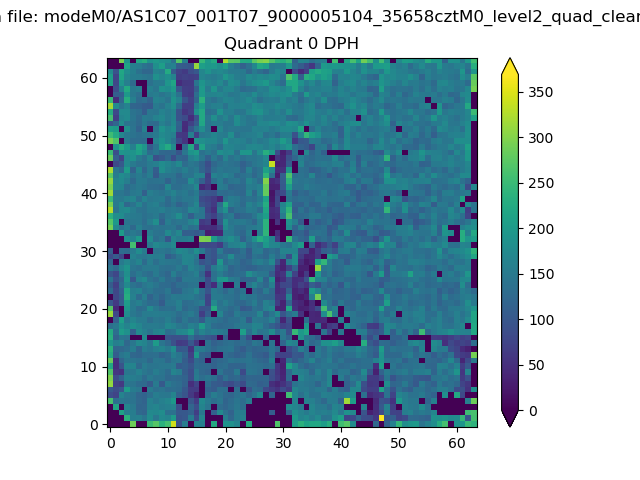 |
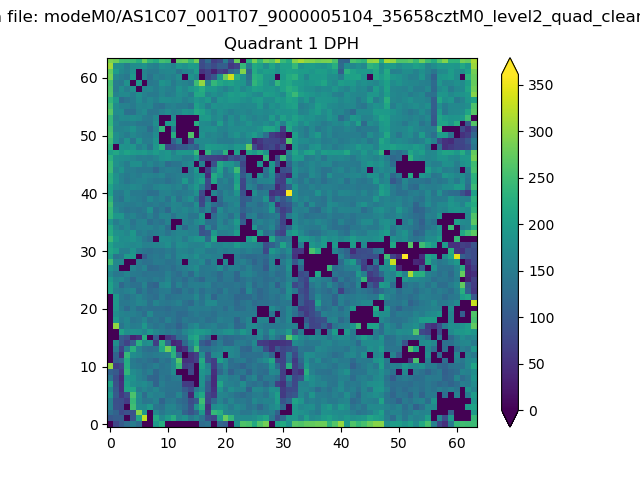 |
Quadrant B |
|---|---|---|---|
| Quadrant D | 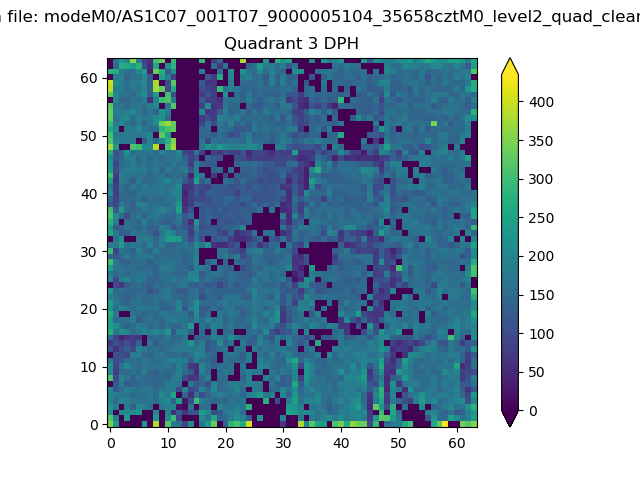 |
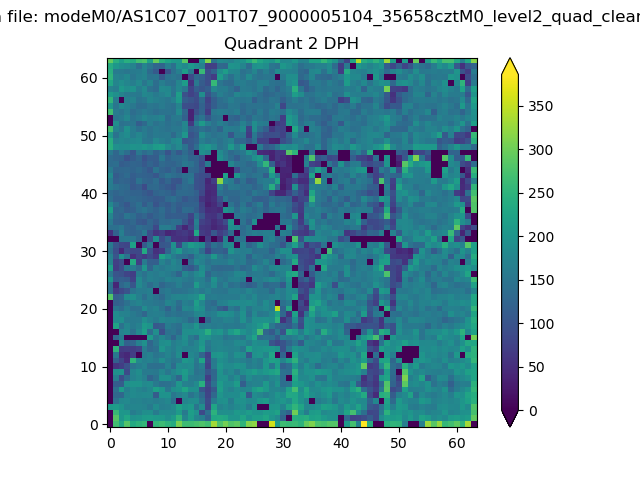 |
Quadrant C |
| Plot type | Count rate plots | Images |
|---|---|---|
| Comparison with Poisson distribution Blue bars denote a histogram of data divided into 1 sec bins. Red curve is a Poisson curve with rate = median count rate of data. |
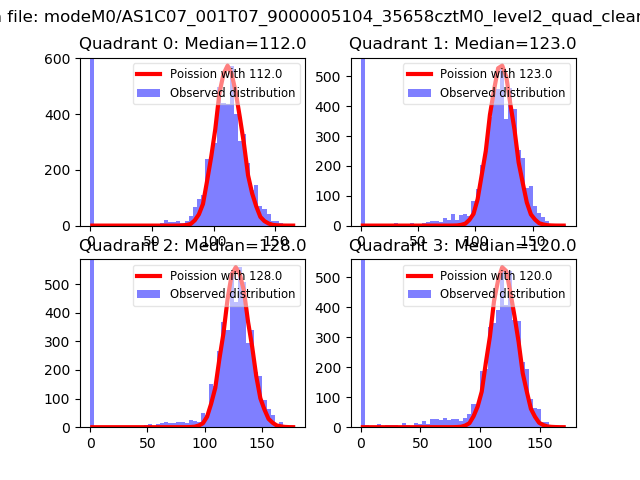 |
 |
| Quadrant-wise count rates Data is divided into 100 sec bins |
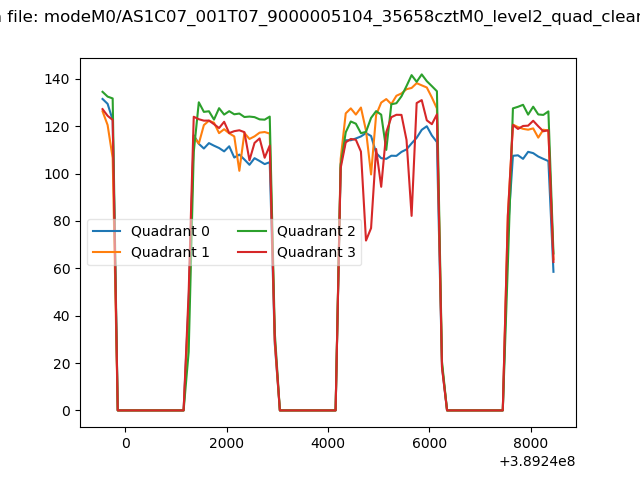 |
|
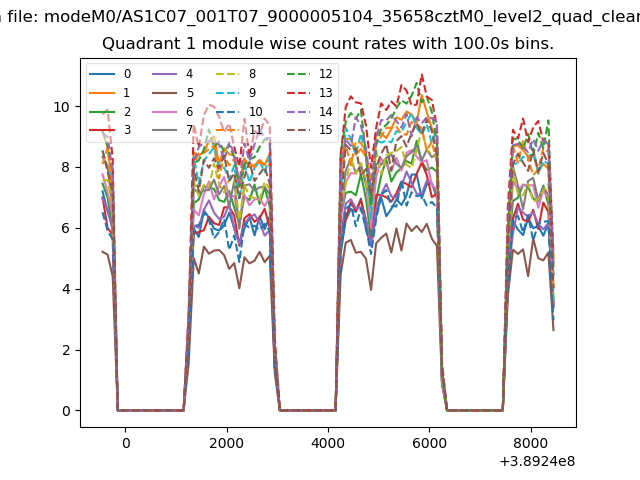
| Module-wise count rates for Quadrant A Data is divided into 100 sec bins |
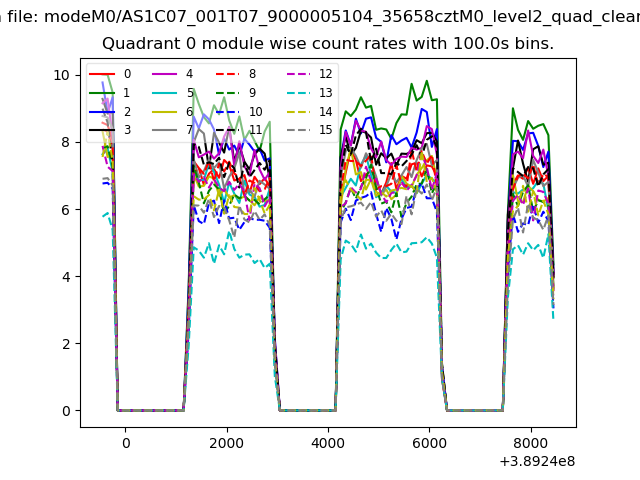 |
 |
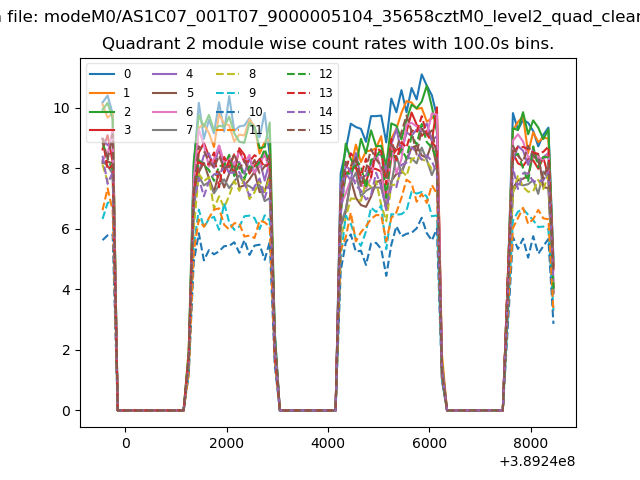
| Module-wise count rates for Quadrant B Data is divided into 100 sec bins |
 |
 |
| Module-wise count rates for Quadrant C Data is divided into 100 sec bins |
 |
 |
| Module-wise count rates for Quadrant D Data is divided into 100 sec bins |
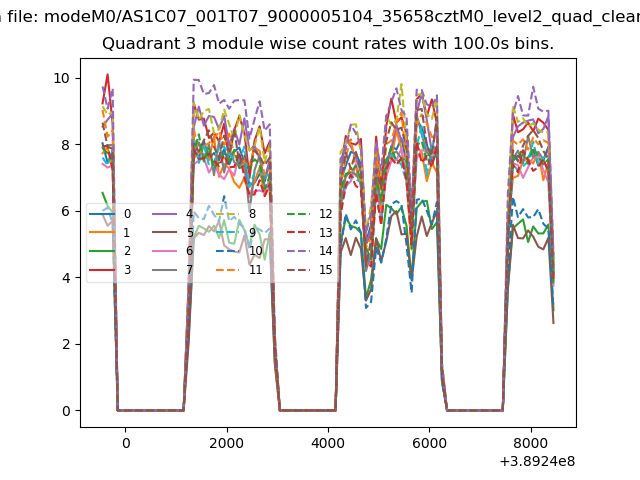 |
 |
| Parameter | Plot |
|---|---|
| CZT HV Monitor | 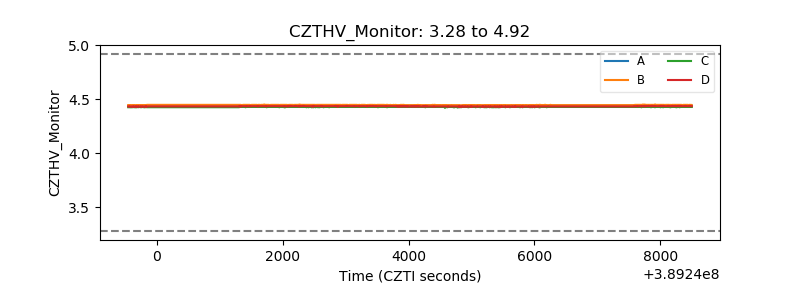 |
| D_VDD | 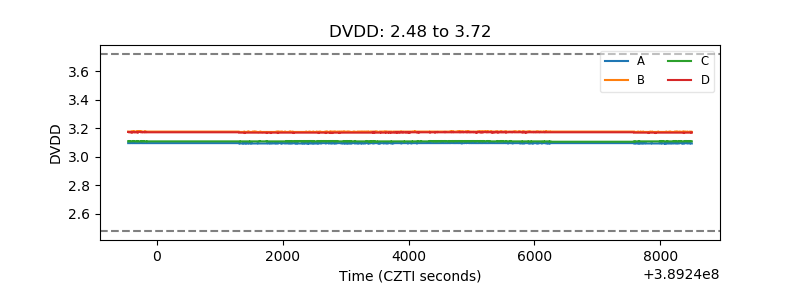 |
| Temperature 1 | 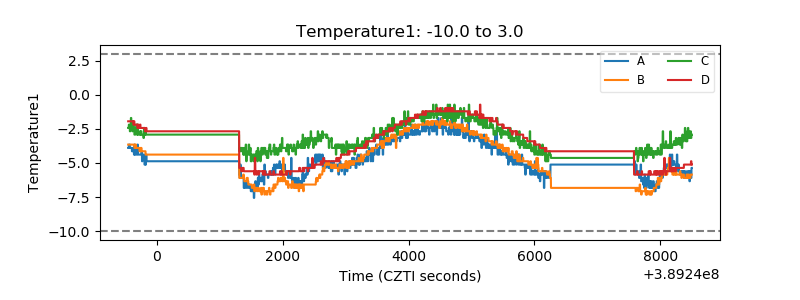 |
| Veto HV Monitor | 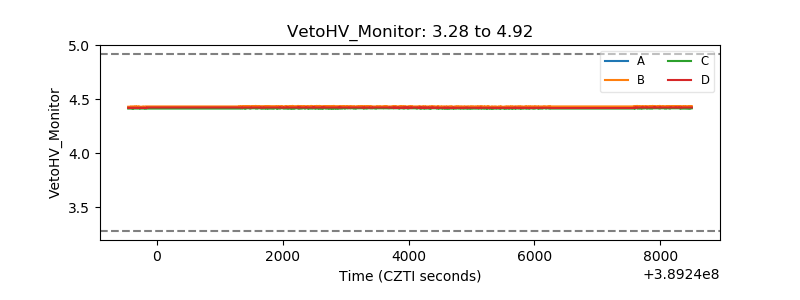 |
| Veto LLD | 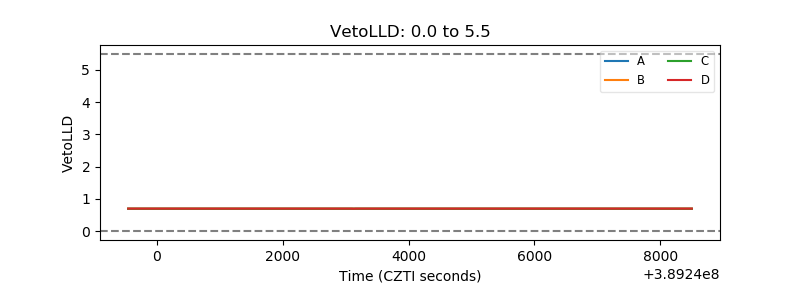 |
| Alpha Counter | 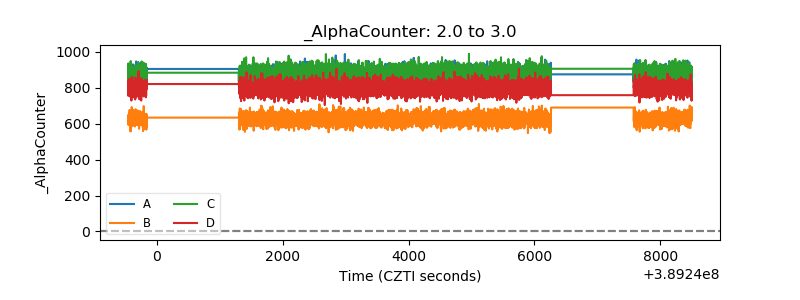 |
| _CPM_Rate | 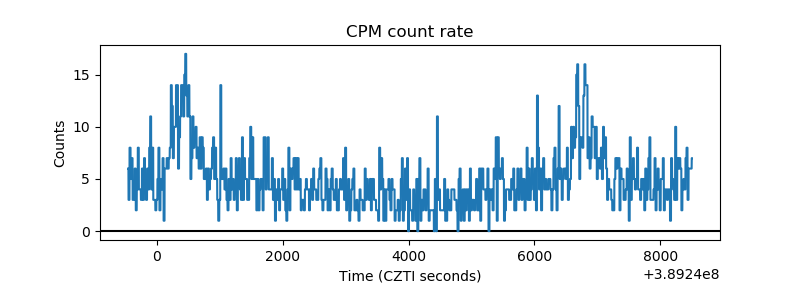 |
| CZT Counter | 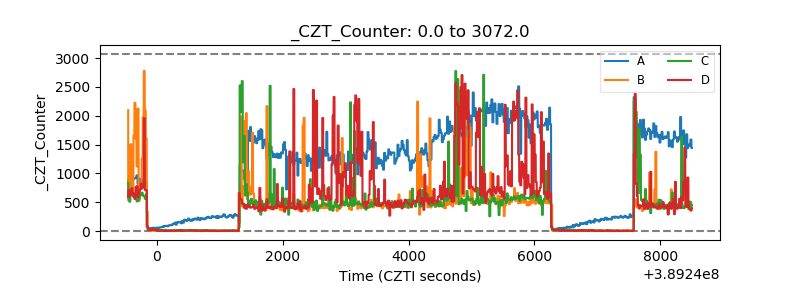 |
| +2.5 Volts monitor | 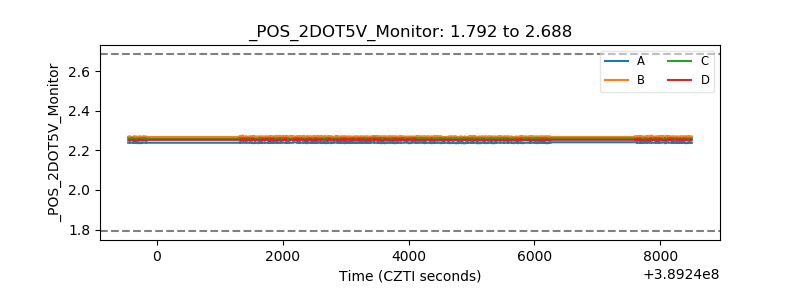 |
| +5 Volts monitor | 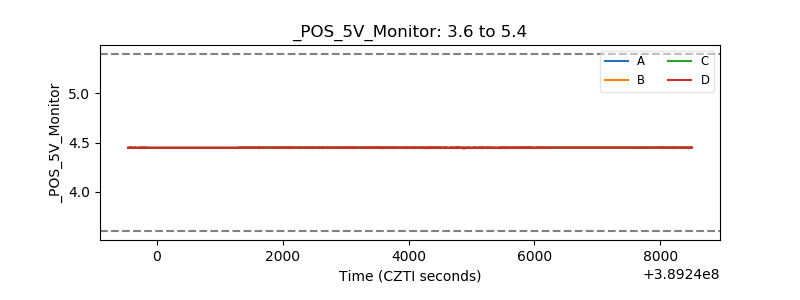 |
| _ROLL_ROT | 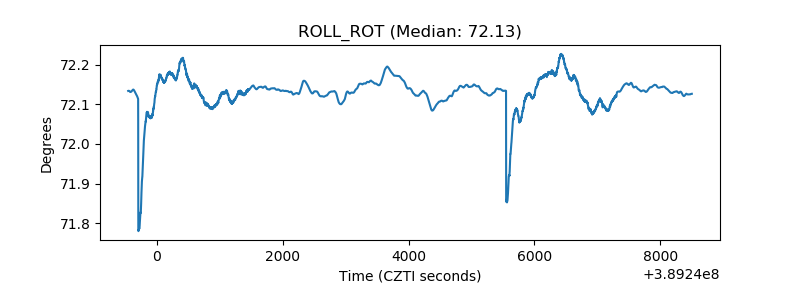 |
| _Roll_DEC | 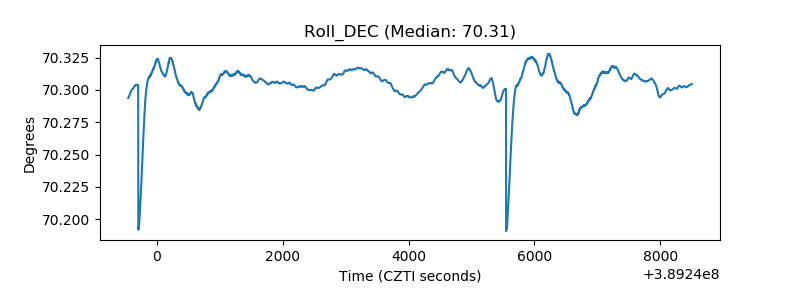 |
| _Roll_RA | 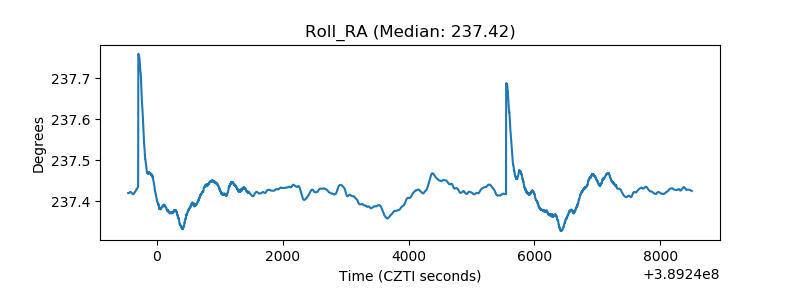 |
| Veto Counter | 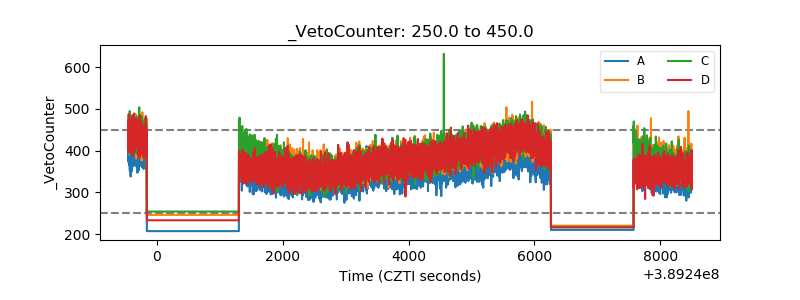 |