| Param | Original file | Final file |
|---|---|---|
| Filename | modeM0/AS1C07_001T07_9000005104_35656cztM0_level2.evt | modeM0/AS1C07_001T07_9000005104_35656cztM0_level2_quad_clean.evt |
| Size (bytes) | 741,542,400 | 74,471,040 |
| Size | 707.2 MB | 71.0 MB |
| Events in quadrant A | 11,985,145 | 384,770 |
| Events in quadrant B | 3,363,267 | 498,197 |
| Events in quadrant C | 3,377,077 | 510,191 |
| Events in quadrant D | 3,371,628 | 486,817 |
| Mode SS | |||
|---|---|---|---|
| Quadrant | BADHDUFLAG | Total packets | Discarded packets |
| A | 0 | 108 | 0 |
| B | 0 | 108 | 0 |
| C | 0 | 108 | 0 |
| D | 0 | 108 | 0 |
| Mode M9 | |||
|---|---|---|---|
| Quadrant | BADHDUFLAG | Total packets | Discarded packets |
| A | 0 | 32 | 0 |
| B | 0 | 32 | 0 |
| C | 0 | 32 | 0 |
| D | 0 | 33 | 0 |
| Mode M0 | |||
|---|---|---|---|
| Quadrant | BADHDUFLAG | Total packets | Discarded packets |
| A | 0 | 39228 | 3 |
| B | 0 | 13750 | 2 |
| C | 0 | 13483 | 2 |
| D | 0 | 13751 | 2 |
| Quadrant | Total seconds | Saturated seconds | Saturation percentage |
|---|---|---|---|
| A | 5335 | 4209 | 78.894096% |
| B | 5335 | 272 | 5.098407% |
| C | 5335 | 188 | 3.523899% |
| D | 5335 | 254 | 4.761012% |
Noise dominated data is calculated using 1-second bins in cleaned event files. If a bin has >2000 counts, and if more than 50% of those come from <1% of pixels, then it is considered to be noise-dominated and hence unusable.
| Quadrant | # 1 sec bins | Bins with >0 counts | Bins with >2000 counts | High rate bins dominated by noise | Noise dominated (total time) | Noise dominated (detector-on time) | Marked lightcurve |
|---|---|---|---|---|---|---|---|
| A | 7098 | 5336 | 4488 | 4488 | 63.23% | 84.11% | 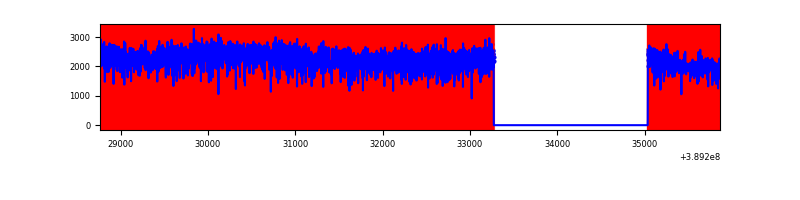 |
| B | 7098 | 5336 | 170 | 170 | 2.40% | 3.19% | 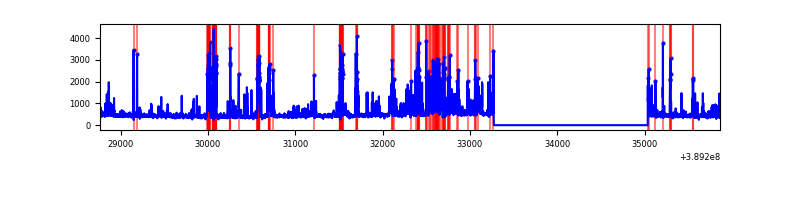 |
| C | 7098 | 5336 | 148 | 148 | 2.09% | 2.77% | 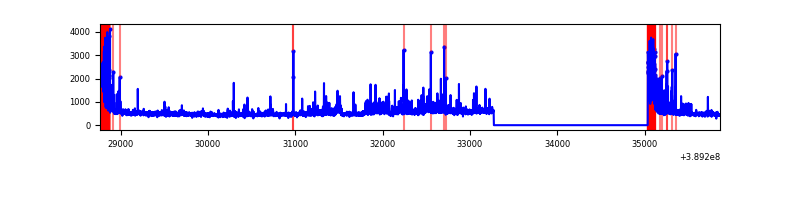 |
| D | 7098 | 5336 | 199 | 199 | 2.80% | 3.73% | 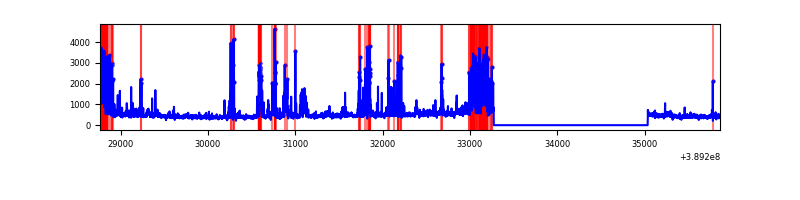 |
Top three noisy pixels from each quadrant. If the there are fewer than three noisy pixels in the level2.evt file, extra rows are filled as -1
| Pixel properties | Quadrant properties | ||||||
|---|---|---|---|---|---|---|---|
| Quadrant | DetID | PixID | Counts | Sigma | Mean | Median | Sigma |
| A | 15 | 169 | 9910524 | 99752.31 | 496 | 486 | 99.3 |
| A | 10 | 83 | 121959 | 1222.72 | 496 | 486 | 99.3 |
| A | 12 | 189 | 12681 | 122.75 | 496 | 486 | 99.3 |
| B | 5 | 172 | 846589 | 7709.39 | 575 | 560 | 109.7 |
| B | 5 | 255 | 227593 | 2068.83 | 575 | 560 | 109.7 |
| B | 12 | 111 | 13529 | 118.18 | 575 | 560 | 109.7 |
| C | 0 | 10 | 593499 | 4508.19 | 571 | 574 | 131.5 |
| C | 9 | 187 | 269993 | 2048.48 | 571 | 574 | 131.5 |
| C | 15 | 214 | 219021 | 1660.92 | 571 | 574 | 131.5 |
| D | 13 | 249 | 363560 | 2659.68 | 565 | 548 | 136.5 |
| D | 10 | 118 | 231964 | 1695.51 | 565 | 548 | 136.5 |
| D | 2 | 250 | 208612 | 1524.42 | 565 | 548 | 136.5 |
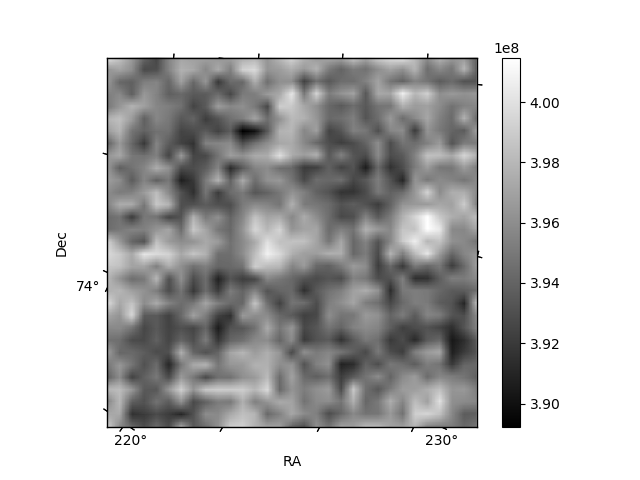
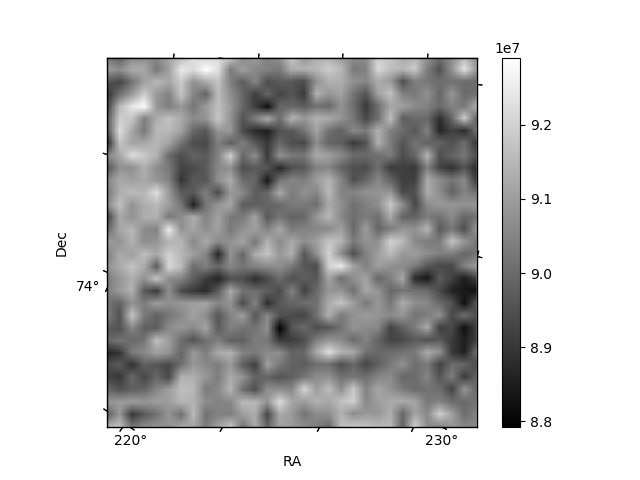
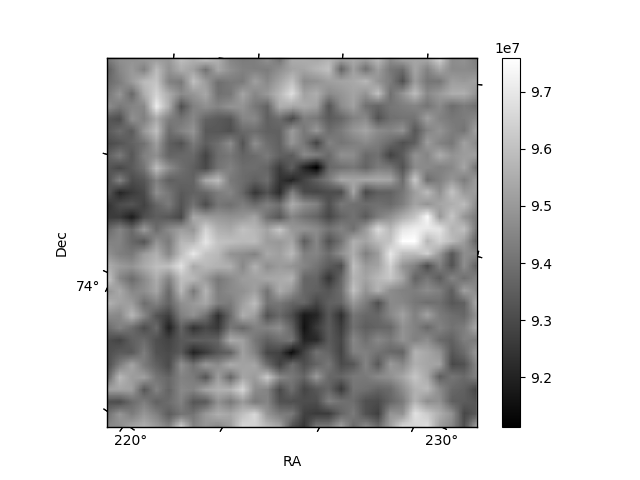
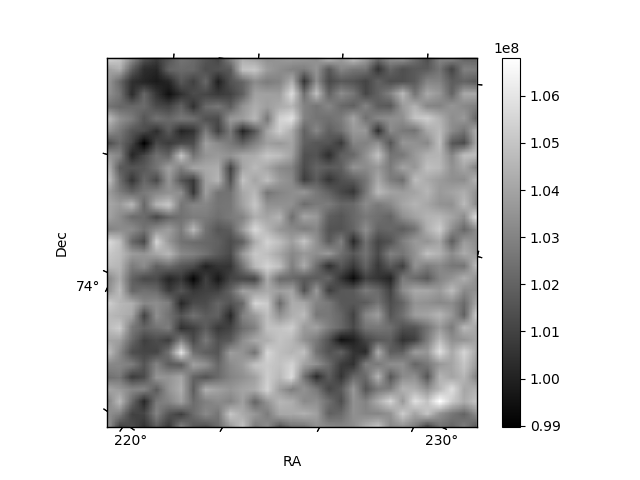
Histogram calculated using DETX and DETY for each event in the final _common_clean file
| Quadrant A | 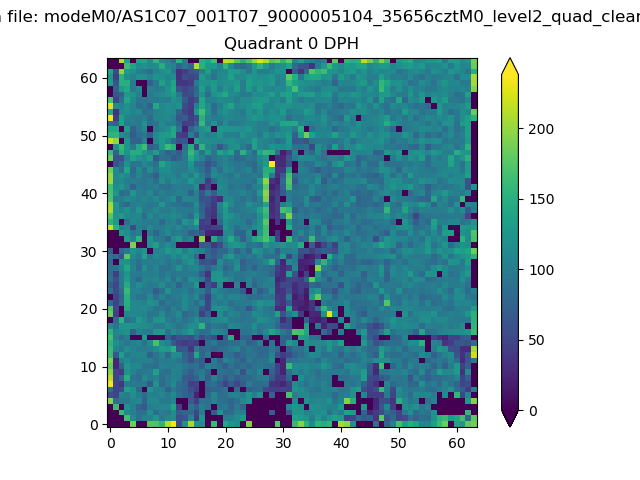 |
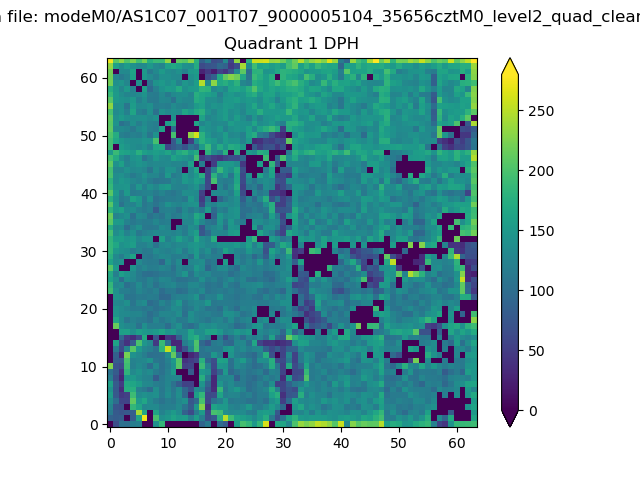 |
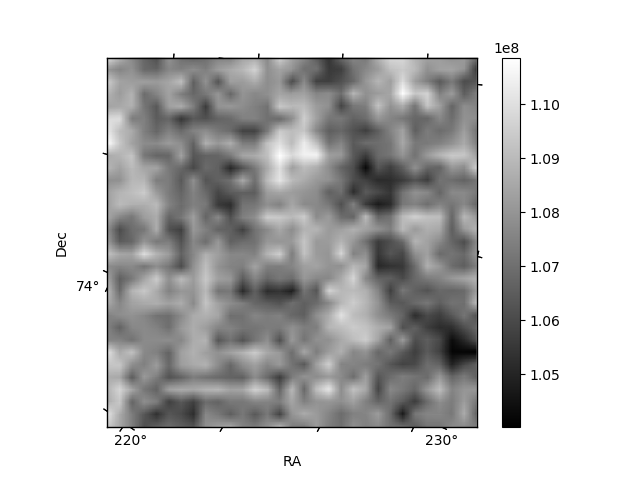
Quadrant B |
|---|---|---|---|
| Quadrant D | 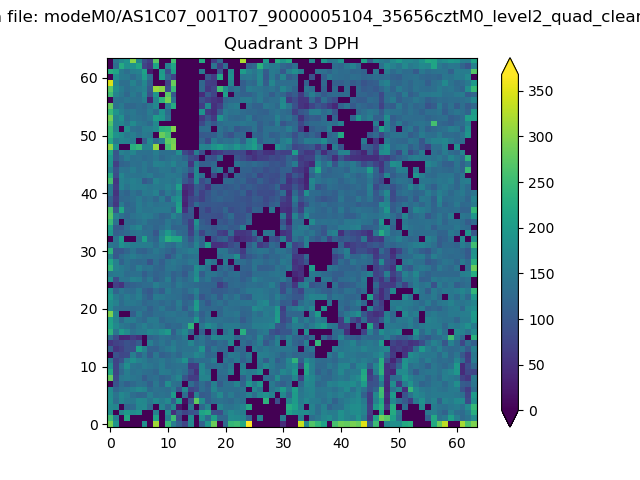 |
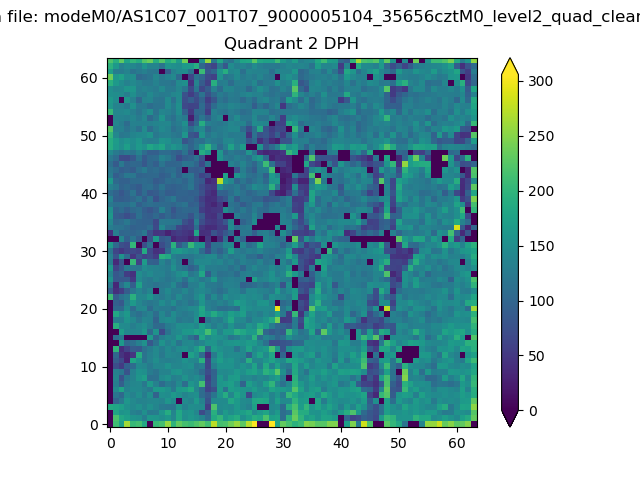 |
Quadrant C |
| Plot type | Count rate plots | Images |
|---|---|---|
| Comparison with Poisson distribution Blue bars denote a histogram of data divided into 1 sec bins. Red curve is a Poisson curve with rate = median count rate of data. |
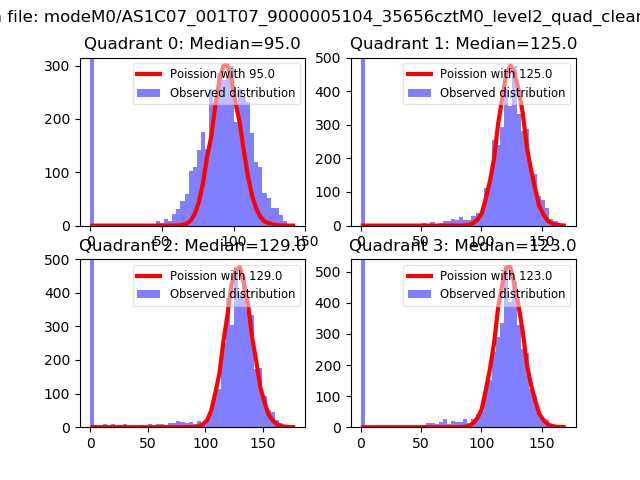 |
 |
| Quadrant-wise count rates Data is divided into 100 sec bins |
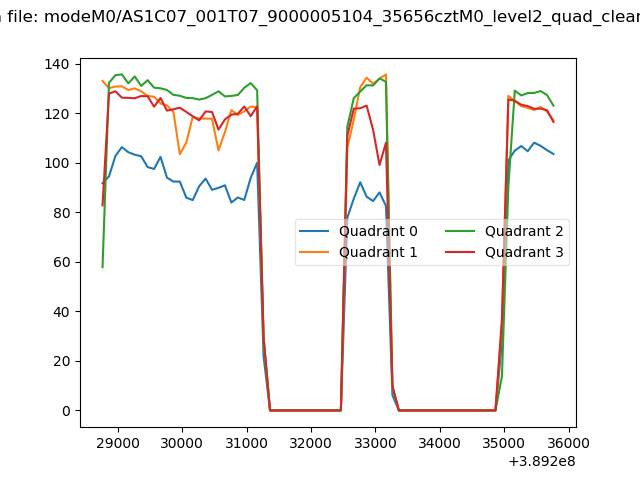 |
|
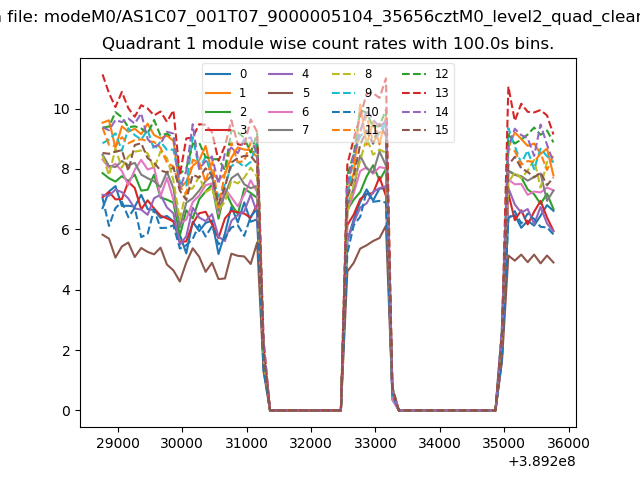
| Module-wise count rates for Quadrant A Data is divided into 100 sec bins |
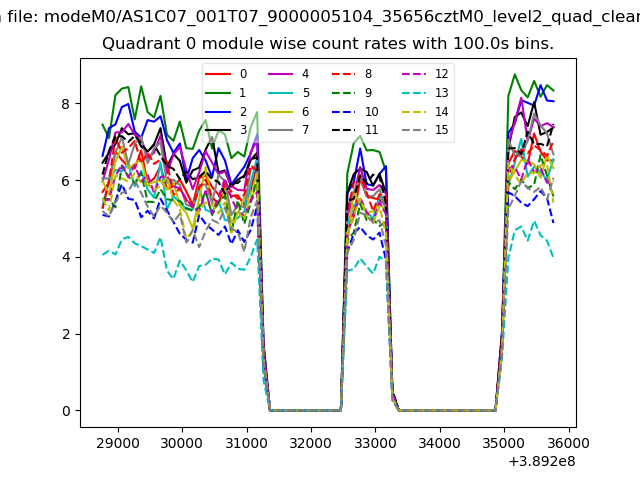 |
 |
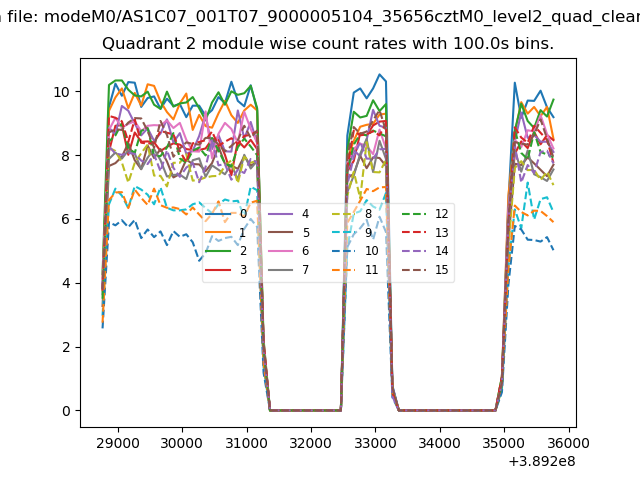
| Module-wise count rates for Quadrant B Data is divided into 100 sec bins |
 |
 |
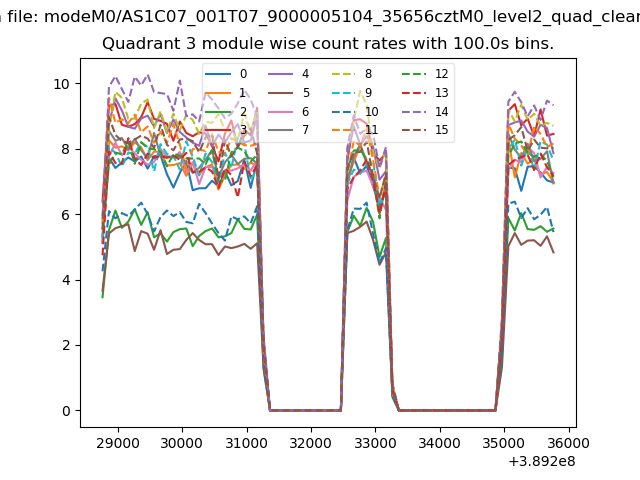
| Module-wise count rates for Quadrant C Data is divided into 100 sec bins |
 |
 |
| Module-wise count rates for Quadrant D Data is divided into 100 sec bins |
 |
 |
| Parameter | Plot |
|---|---|
| CZT HV Monitor | 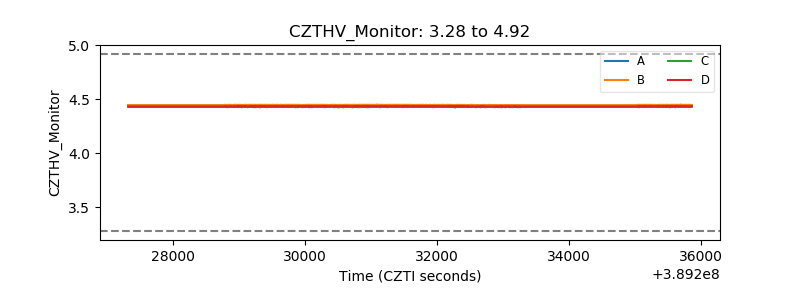 |
| D_VDD | 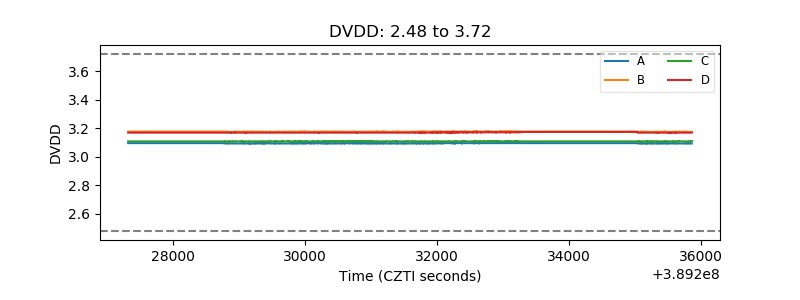 |
| Temperature 1 |  |
| Veto HV Monitor | 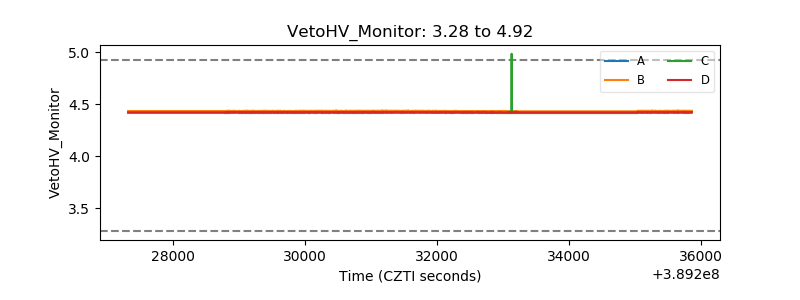 |
| Veto LLD | 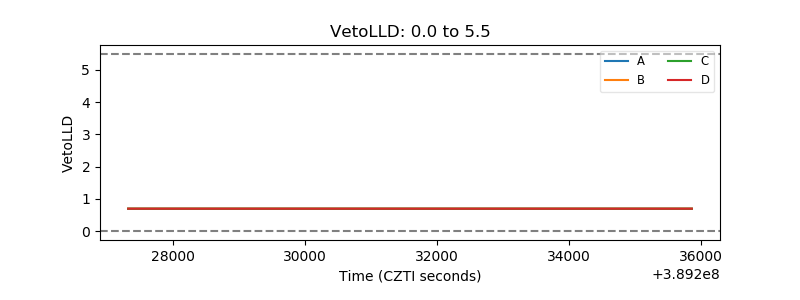 |
| Alpha Counter | 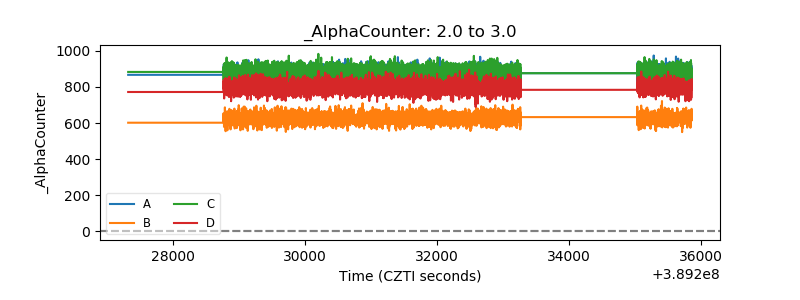 |
| _CPM_Rate | 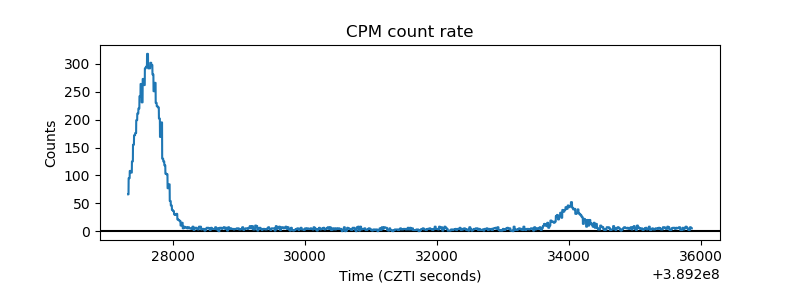 |
| CZT Counter | 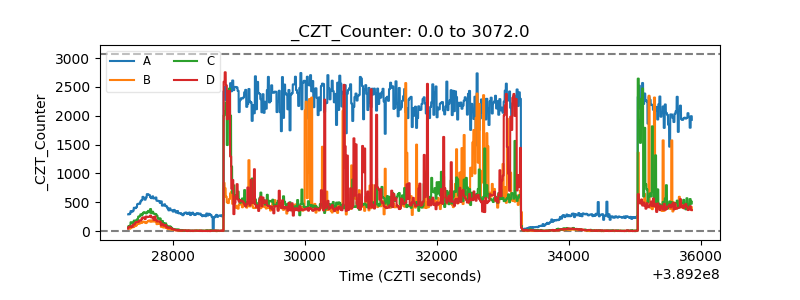 |
| +2.5 Volts monitor | 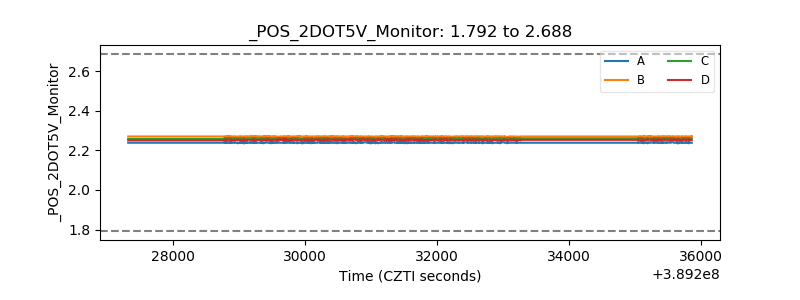 |
| +5 Volts monitor | 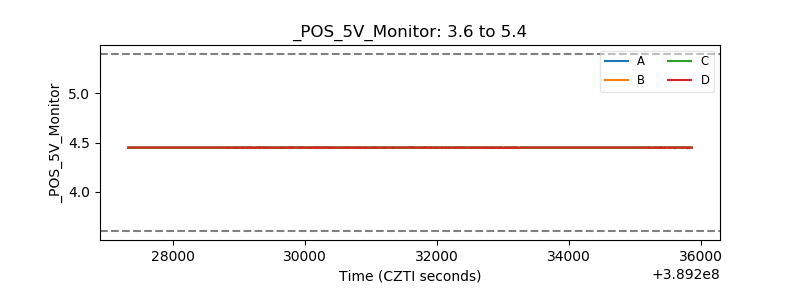 |
| _ROLL_ROT | 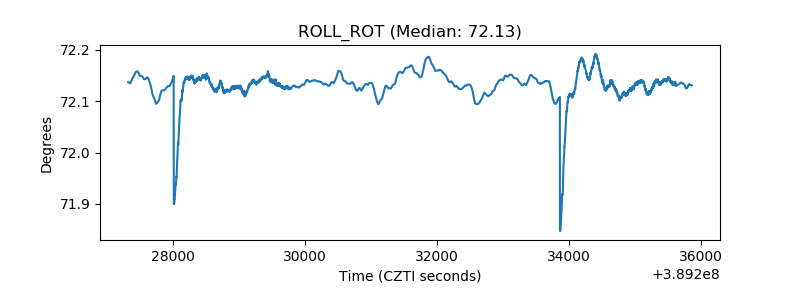 |
| _Roll_DEC | 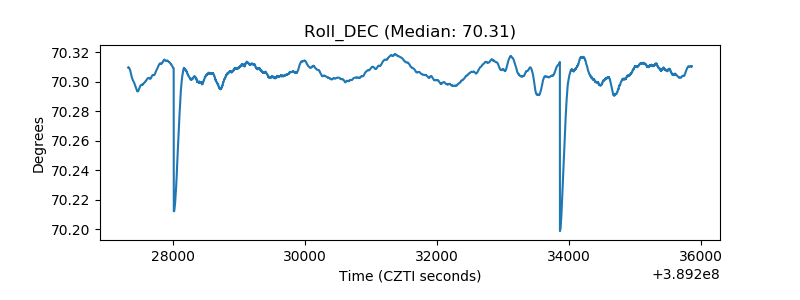 |
| _Roll_RA | 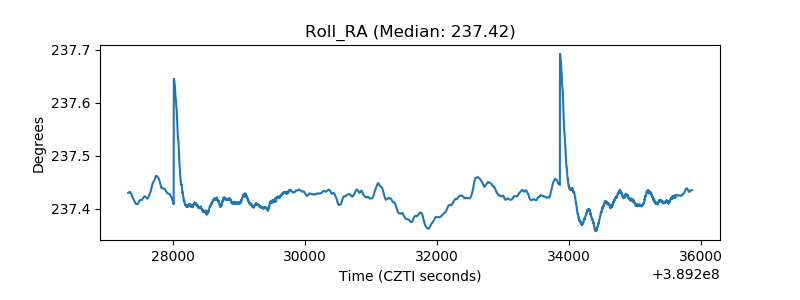 |
| Veto Counter | 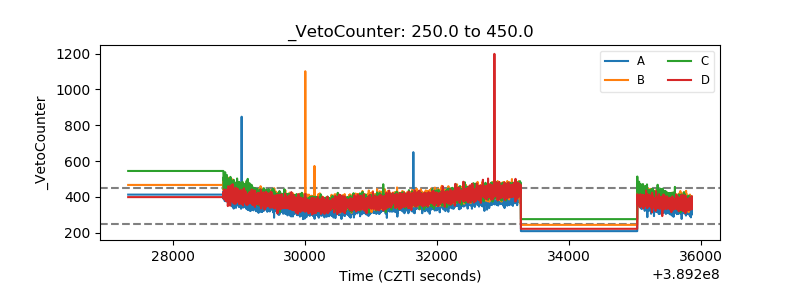 |