| Param | Original file | Final file |
|---|---|---|
| Filename | modeM0/AS1C07_001T07_9000005104_35654cztM0_level2.evt | modeM0/AS1C07_001T07_9000005104_35654cztM0_level2_quad_clean.evt |
| Size (bytes) | 603,054,720 | 83,759,040 |
| Size | 575.1 MB | 79.9 MB |
| Events in quadrant A | 8,365,393 | 477,537 |
| Events in quadrant B | 3,613,705 | 565,414 |
| Events in quadrant C | 2,919,805 | 593,707 |
| Events in quadrant D | 3,034,005 | 556,046 |
| Mode SS | |||
|---|---|---|---|
| Quadrant | BADHDUFLAG | Total packets | Discarded packets |
| A | 0 | 100 | 0 |
| B | 0 | 100 | 0 |
| C | 0 | 100 | 0 |
| D | 0 | 100 | 0 |
| Mode M9 | |||
|---|---|---|---|
| Quadrant | BADHDUFLAG | Total packets | Discarded packets |
| A | 0 | 39 | 0 |
| B | 0 | 39 | 0 |
| C | 0 | 39 | 0 |
| D | 0 | 40 | 0 |
| Mode M0 | |||
|---|---|---|---|
| Quadrant | BADHDUFLAG | Total packets | Discarded packets |
| A | 0 | 28158 | 3 |
| B | 0 | 13950 | 2 |
| C | 0 | 11666 | 2 |
| D | 0 | 12302 | 2 |
| Quadrant | Total seconds | Saturated seconds | Saturation percentage |
|---|---|---|---|
| A | 4884 | 2080 | 42.588043% |
| B | 4884 | 334 | 6.838657% |
| C | 4884 | 156 | 3.194103% |
| D | 4884 | 195 | 3.992629% |
Noise dominated data is calculated using 1-second bins in cleaned event files. If a bin has >2000 counts, and if more than 50% of those come from <1% of pixels, then it is considered to be noise-dominated and hence unusable.
| Quadrant | # 1 sec bins | Bins with >0 counts | Bins with >2000 counts | High rate bins dominated by noise | Noise dominated (total time) | Noise dominated (detector-on time) | Marked lightcurve |
|---|---|---|---|---|---|---|---|
| A | 7036 | 4885 | 2255 | 2255 | 32.05% | 46.16% | 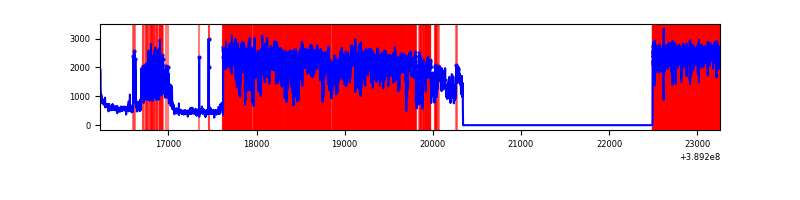 |
| B | 7036 | 4885 | 235 | 235 | 3.34% | 4.81% | 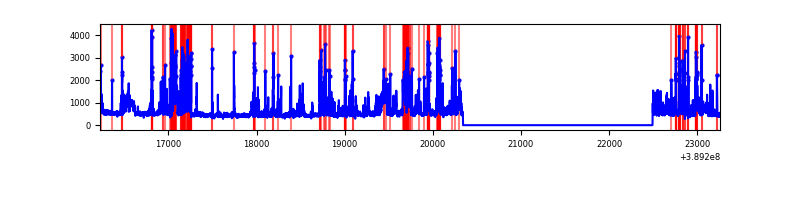 |
| C | 7036 | 4885 | 119 | 119 | 1.69% | 2.44% | 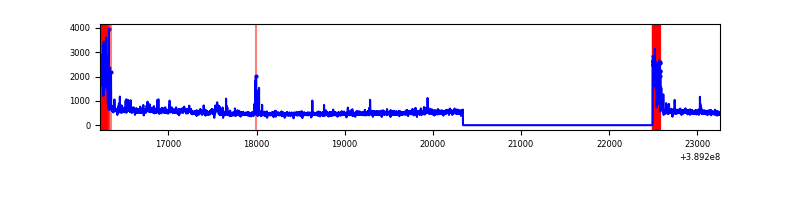 |
| D | 7036 | 4885 | 155 | 155 | 2.20% | 3.17% | 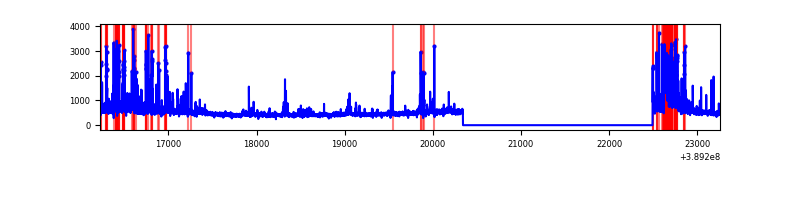 |
Top three noisy pixels from each quadrant. If the there are fewer than three noisy pixels in the level2.evt file, extra rows are filled as -1
| Pixel properties | Quadrant properties | ||||||
|---|---|---|---|---|---|---|---|
| Quadrant | DetID | PixID | Counts | Sigma | Mean | Median | Sigma |
| A | 15 | 169 | 6237643 | 60887.33 | 512 | 503 | 102.4 |
| A | 10 | 83 | 120792 | 1174.27 | 512 | 503 | 102.4 |
| A | 13 | 6 | 11698 | 109.29 | 512 | 503 | 102.4 |
| B | 5 | 172 | 1051753 | 10138.46 | 554 | 541 | 103.7 |
| B | 5 | 255 | 250673 | 2412.41 | 554 | 541 | 103.7 |
| B | 4 | 232 | 62715 | 599.64 | 554 | 541 | 103.7 |
| C | 0 | 10 | 386468 | 2983.69 | 564 | 569 | 129.3 |
| C | 15 | 214 | 201732 | 1555.35 | 564 | 569 | 129.3 |
| C | 15 | 208 | 104602 | 804.36 | 564 | 569 | 129.3 |
| D | 10 | 118 | 250411 | 1873.04 | 552 | 538 | 133.4 |
| D | 2 | 250 | 194649 | 1455.05 | 552 | 538 | 133.4 |
| D | 13 | 249 | 99438 | 741.35 | 552 | 538 | 133.4 |
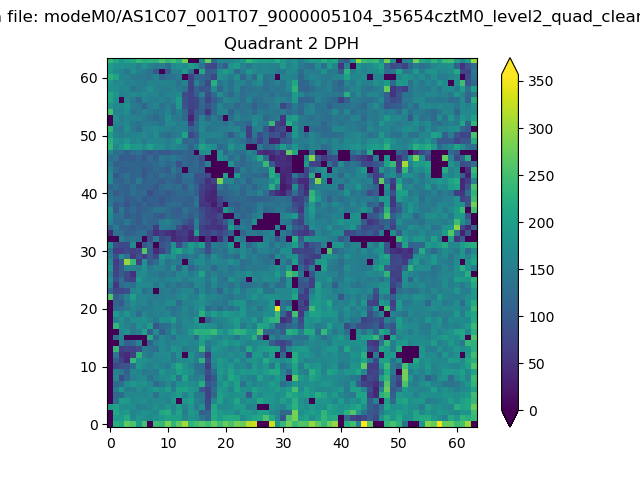
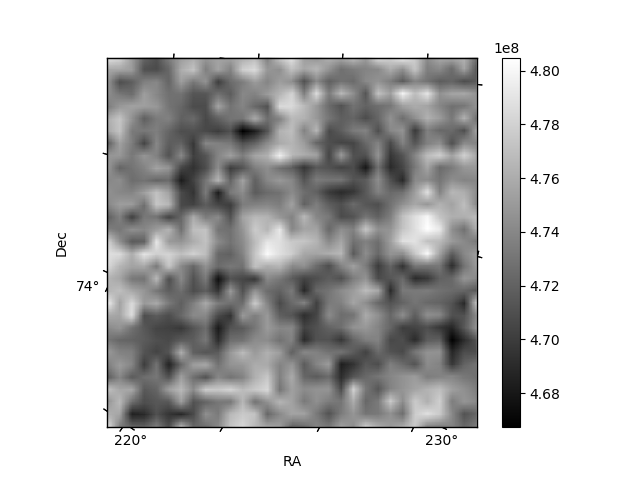
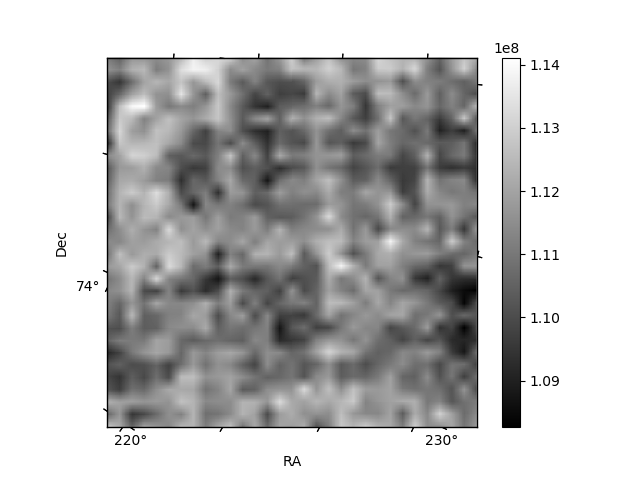
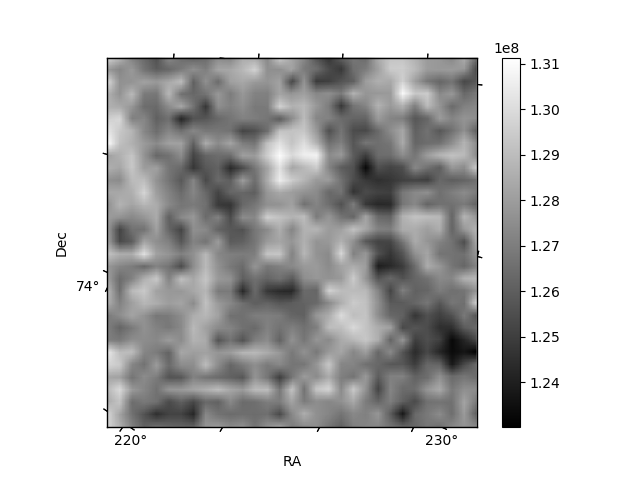
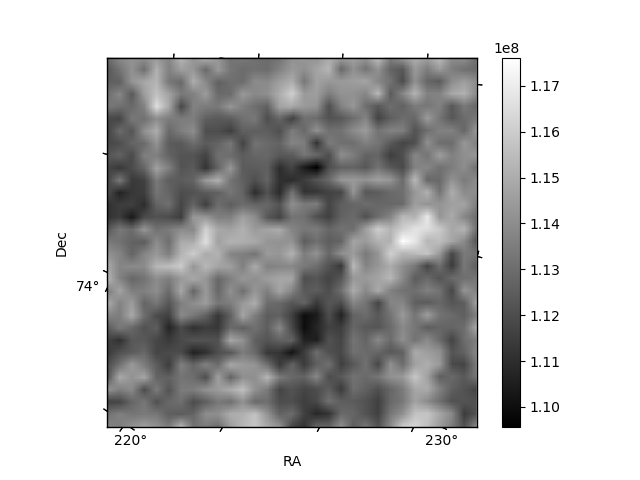
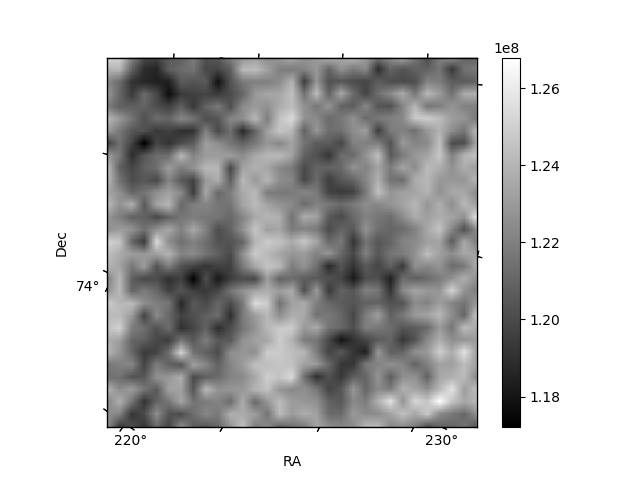
Histogram calculated using DETX and DETY for each event in the final _common_clean file
| Quadrant A | 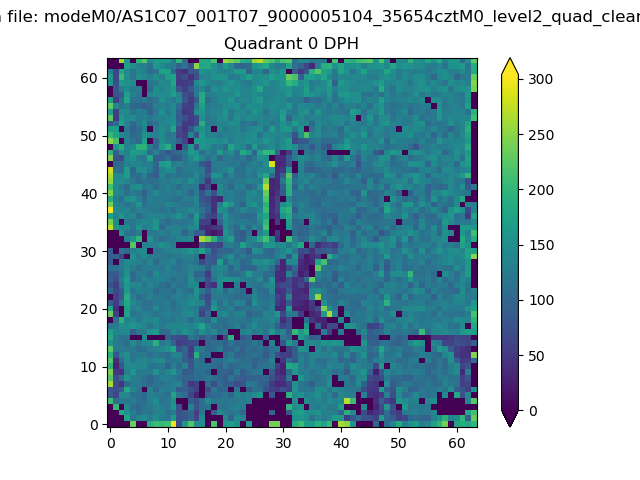 |
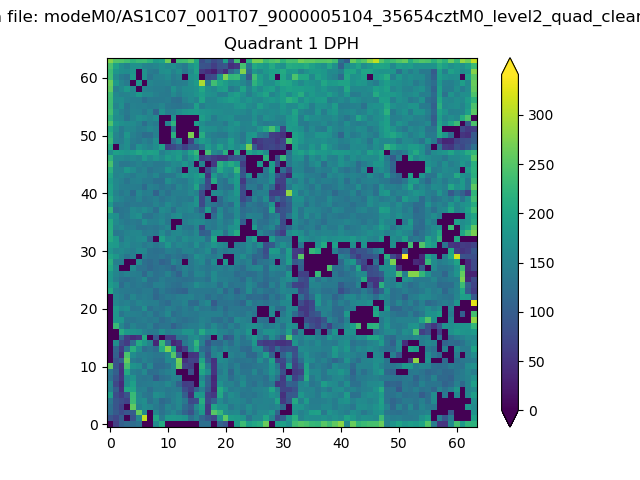 |
Quadrant B |
|---|---|---|---|
| Quadrant D | 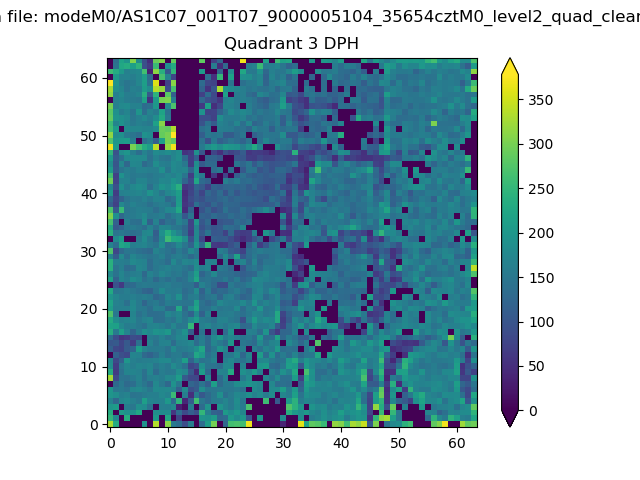 |
 |
Quadrant C |
| Plot type | Count rate plots | Images |
|---|---|---|
| Comparison with Poisson distribution Blue bars denote a histogram of data divided into 1 sec bins. Red curve is a Poisson curve with rate = median count rate of data. |
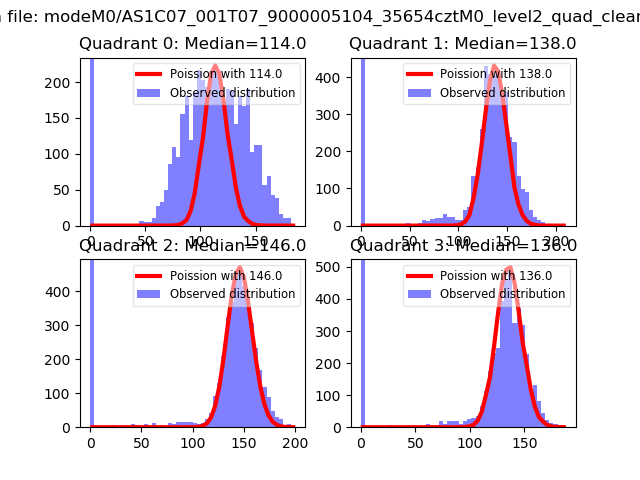 |
 |
| Quadrant-wise count rates Data is divided into 100 sec bins |
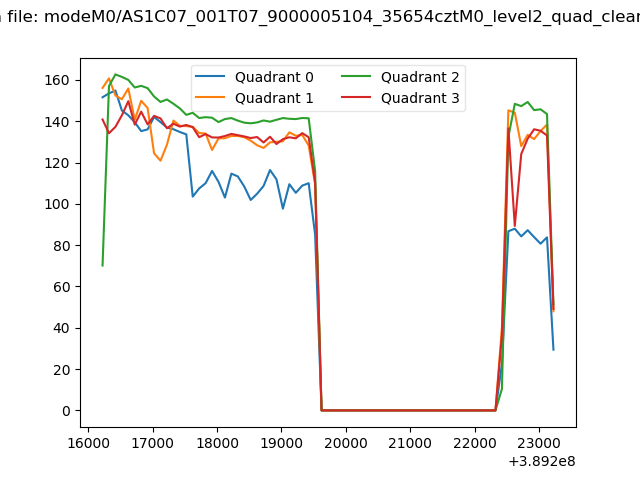 |
|
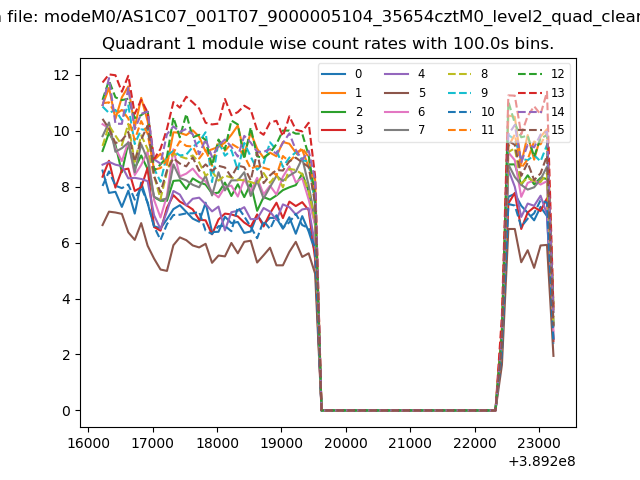
| Module-wise count rates for Quadrant A Data is divided into 100 sec bins |
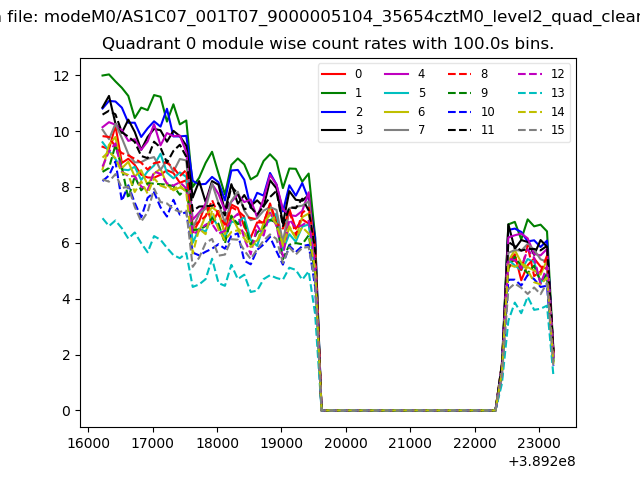 |
 |
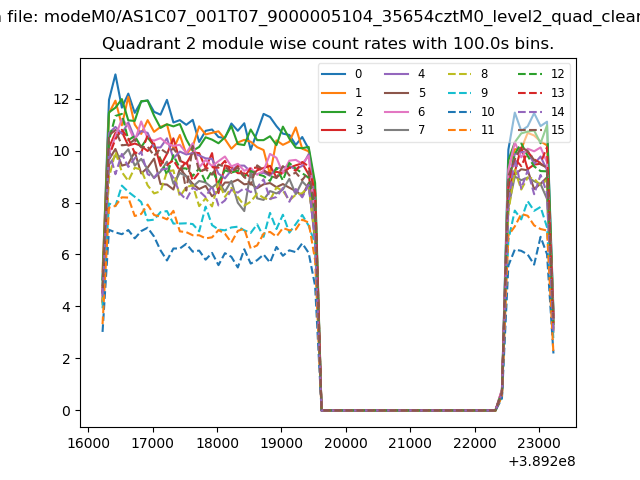
| Module-wise count rates for Quadrant B Data is divided into 100 sec bins |
 |
 |
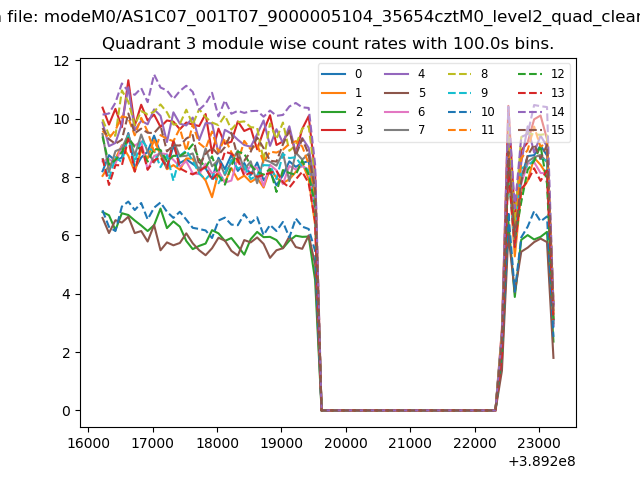
| Module-wise count rates for Quadrant C Data is divided into 100 sec bins |
 |
 |
| Module-wise count rates for Quadrant D Data is divided into 100 sec bins |
 |
 |
| Parameter | Plot |
|---|---|
| CZT HV Monitor | 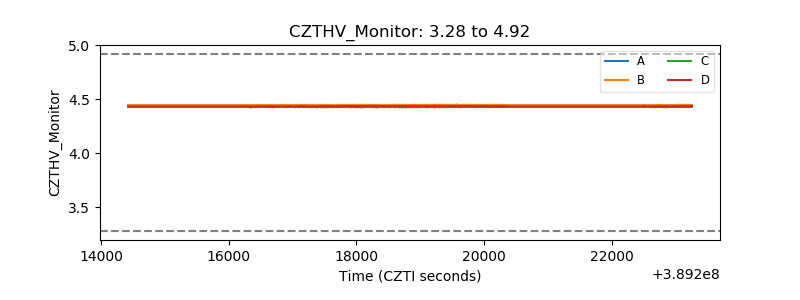 |
| D_VDD | 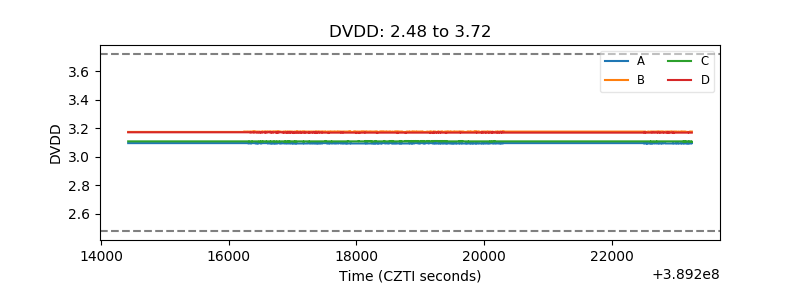 |
| Temperature 1 | 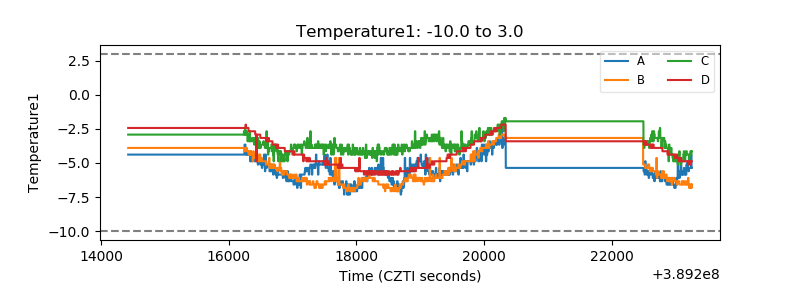 |
| Veto HV Monitor | 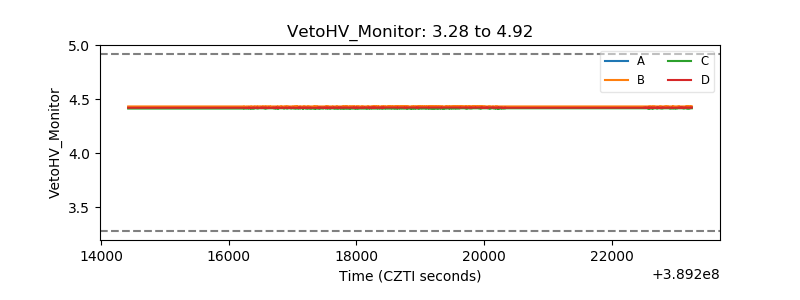 |
| Veto LLD | 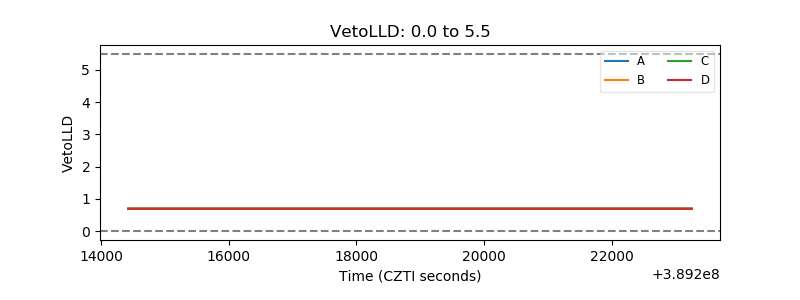 |
| Alpha Counter | 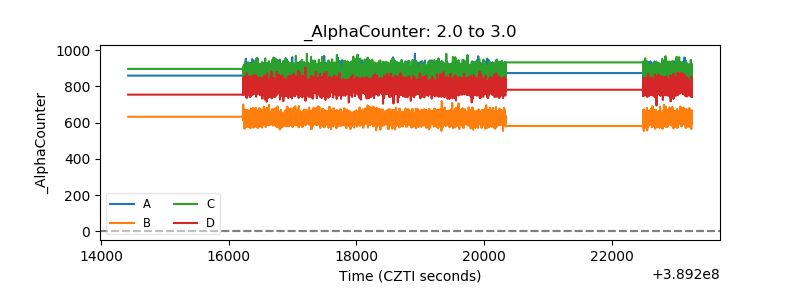 |
| _CPM_Rate | 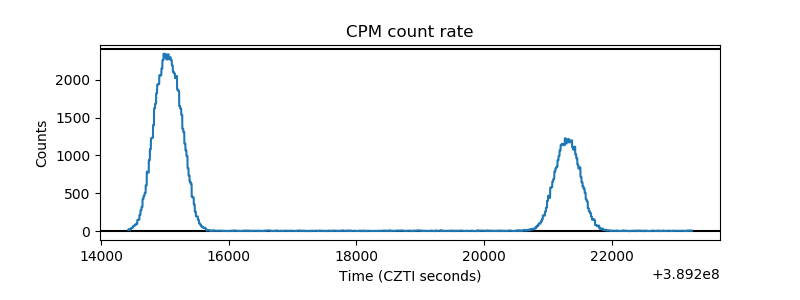 |
| CZT Counter | 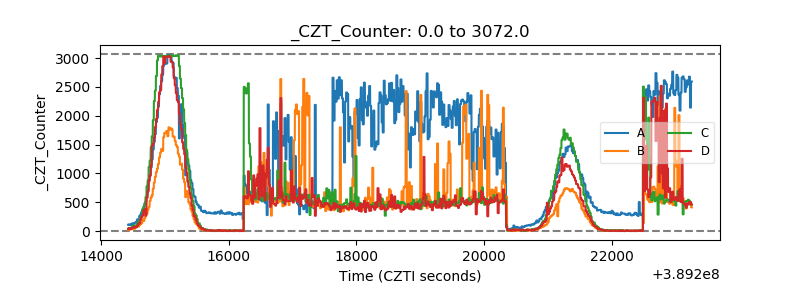 |
| +2.5 Volts monitor | 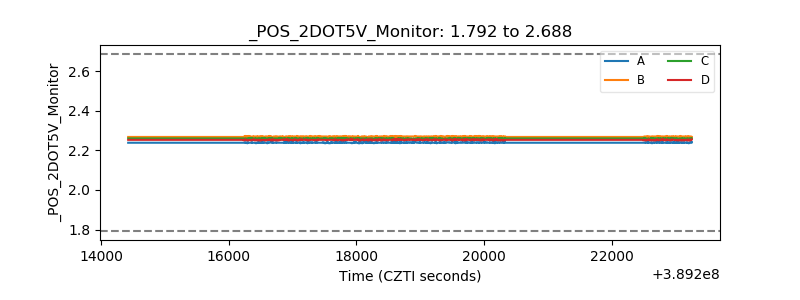 |
| +5 Volts monitor | 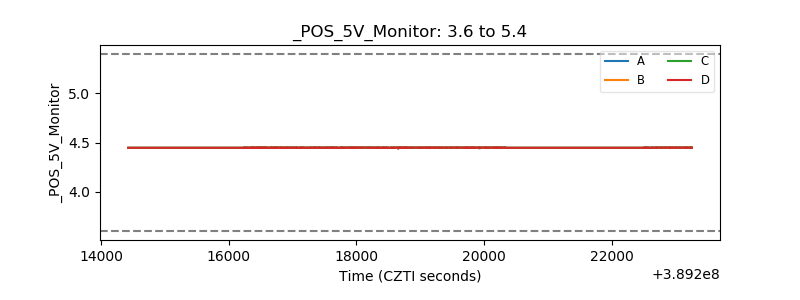 |
| _ROLL_ROT | 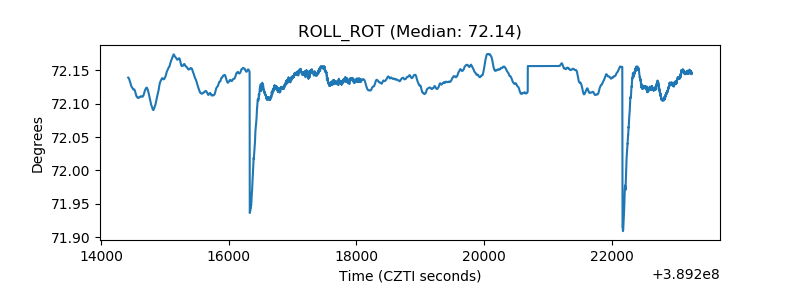 |
| _Roll_DEC | 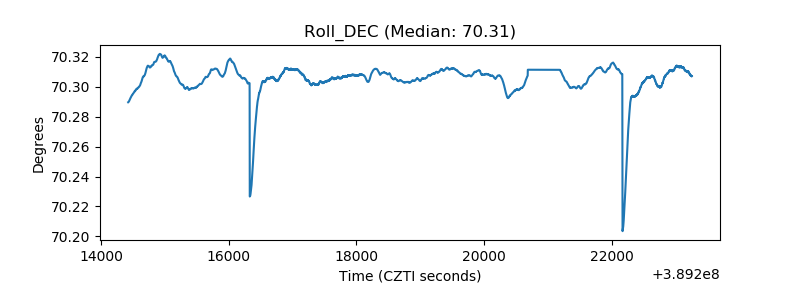 |
| _Roll_RA | 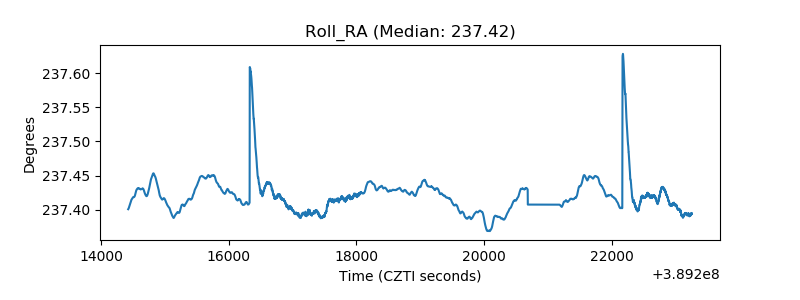 |
| Veto Counter | 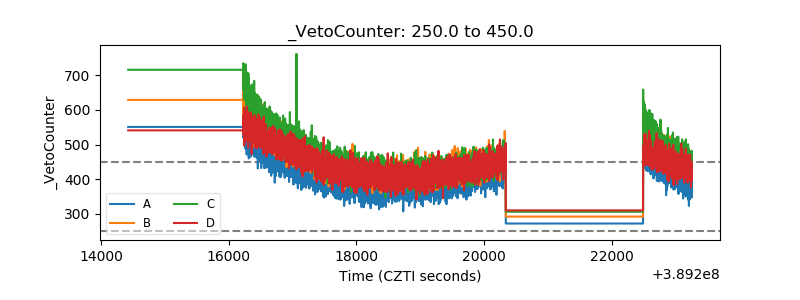 |