| Param | Original file | Final file |
|---|---|---|
| Filename | modeM0/AS1C07_001T07_9000005104_35652cztM0_level2.evt | modeM0/AS1C07_001T07_9000005104_35652cztM0_level2_quad_clean.evt |
| Size (bytes) | 753,600,960 | 96,649,920 |
| Size | 718.7 MB | 92.2 MB |
| Events in quadrant A | 11,463,144 | 459,937 |
| Events in quadrant B | 3,925,737 | 700,406 |
| Events in quadrant C | 3,347,711 | 731,077 |
| Events in quadrant D | 3,747,741 | 681,949 |
| Mode SS | |||
|---|---|---|---|
| Quadrant | BADHDUFLAG | Total packets | Discarded packets |
| A | 0 | 104 | 0 |
| B | 0 | 104 | 0 |
| C | 0 | 104 | 0 |
| D | 0 | 104 | 0 |
| Mode M9 | |||
|---|---|---|---|
| Quadrant | BADHDUFLAG | Total packets | Discarded packets |
| A | 0 | 20 | 0 |
| B | 0 | 20 | 0 |
| C | 0 | 20 | 0 |
| D | 0 | 21 | 0 |
| Mode M0 | |||
|---|---|---|---|
| Quadrant | BADHDUFLAG | Total packets | Discarded packets |
| A | 0 | 37465 | 3 |
| B | 0 | 15005 | 2 |
| C | 0 | 13037 | 2 |
| D | 0 | 14541 | 2 |
| Quadrant | Total seconds | Saturated seconds | Saturation percentage |
|---|---|---|---|
| A | 5007 | 4055 | 80.986619% |
| B | 5007 | 471 | 9.406830% |
| C | 5007 | 224 | 4.473737% |
| D | 5007 | 361 | 7.209906% |
Noise dominated data is calculated using 1-second bins in cleaned event files. If a bin has >2000 counts, and if more than 50% of those come from <1% of pixels, then it is considered to be noise-dominated and hence unusable.
| Quadrant | # 1 sec bins | Bins with >0 counts | Bins with >2000 counts | High rate bins dominated by noise | Noise dominated (total time) | Noise dominated (detector-on time) | Marked lightcurve |
|---|---|---|---|---|---|---|---|
| A | 7038 | 5007 | 3829 | 3829 | 54.40% | 76.47% | 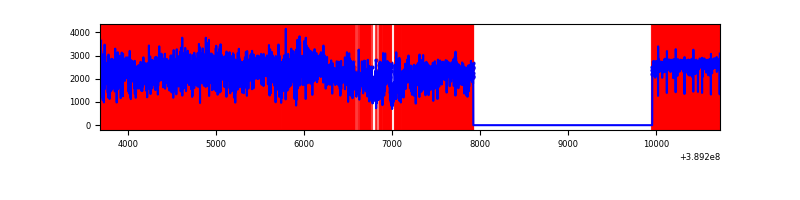 |
| B | 7039 | 5008 | 348 | 348 | 4.94% | 6.95% | 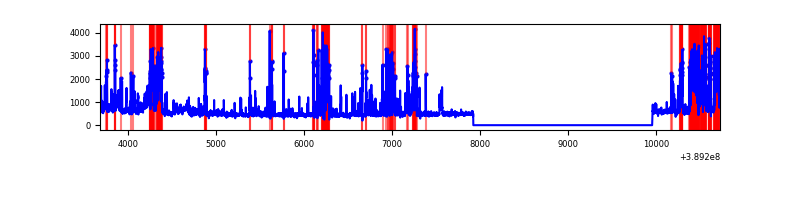 |
| C | 7039 | 5008 | 179 | 179 | 2.54% | 3.57% | 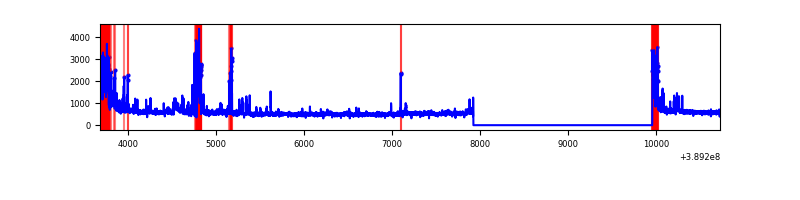 |
| D | 7039 | 5008 | 264 | 264 | 3.75% | 5.27% | 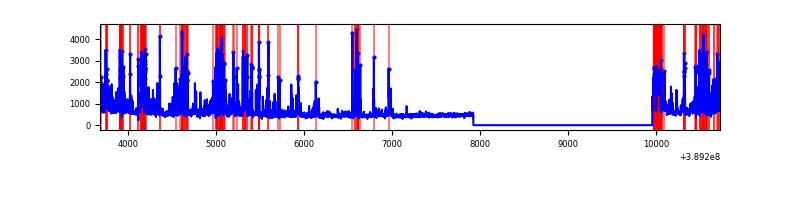 |
Top three noisy pixels from each quadrant. If the there are fewer than three noisy pixels in the level2.evt file, extra rows are filled as -1
| Pixel properties | Quadrant properties | ||||||
|---|---|---|---|---|---|---|---|
| Quadrant | DetID | PixID | Counts | Sigma | Mean | Median | Sigma |
| A | 15 | 169 | 9652970 | 111299.86 | 438 | 431 | 86.7 |
| A | 10 | 83 | 96143 | 1103.62 | 438 | 431 | 86.7 |
| A | 12 | 189 | 9249 | 101.68 | 438 | 431 | 86.7 |
| B | 5 | 172 | 1510995 | 13655.75 | 590 | 574 | 110.6 |
| B | 5 | 200 | 38532 | 343.18 | 590 | 574 | 110.6 |
| B | 12 | 111 | 12775 | 110.31 | 590 | 574 | 110.6 |
| C | 0 | 10 | 413710 | 3022.22 | 602 | 606 | 136.7 |
| C | 1 | 23 | 222294 | 1621.84 | 602 | 606 | 136.7 |
| C | 15 | 214 | 204021 | 1488.16 | 602 | 606 | 136.7 |
| D | 10 | 118 | 640727 | 4565.35 | 588 | 573 | 140.2 |
| D | 2 | 249 | 221023 | 1572.17 | 588 | 573 | 140.2 |
| D | 8 | 195 | 149220 | 1060.1 | 588 | 573 | 140.2 |
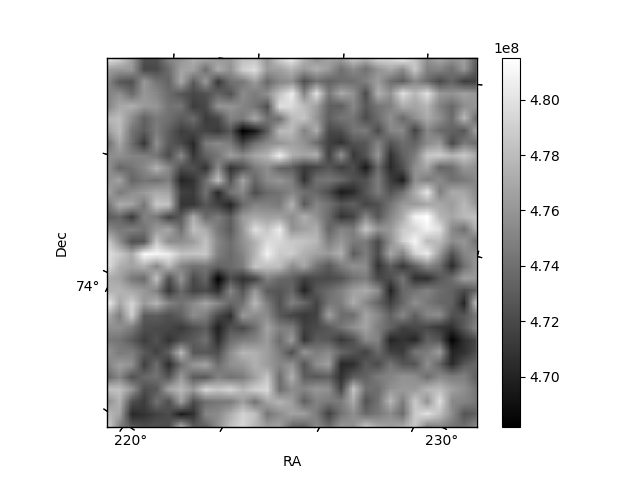
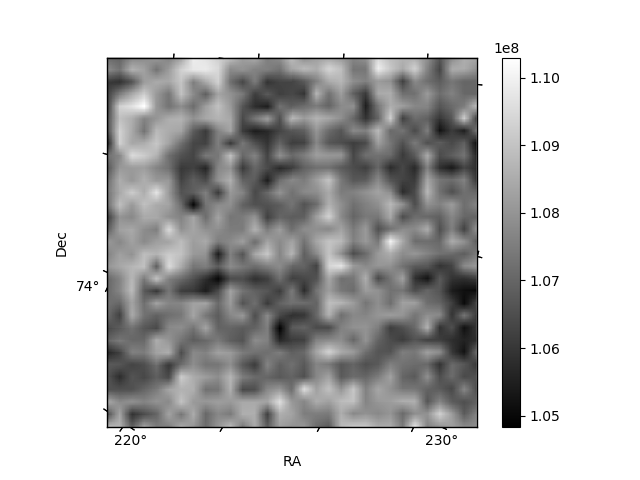
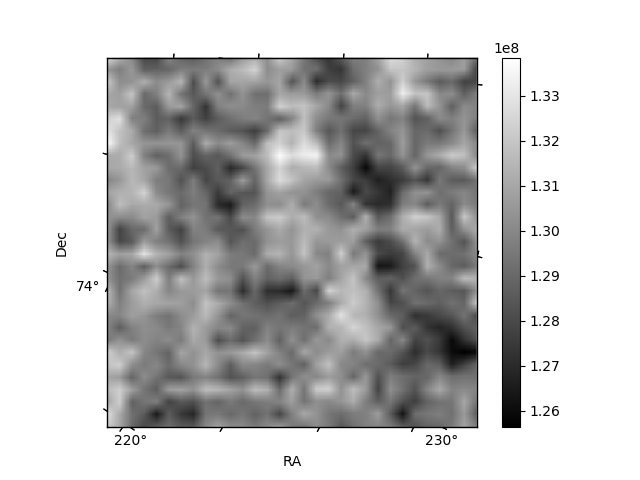
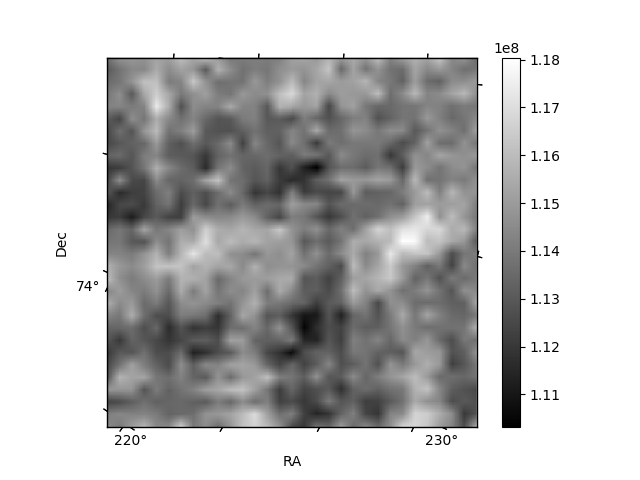
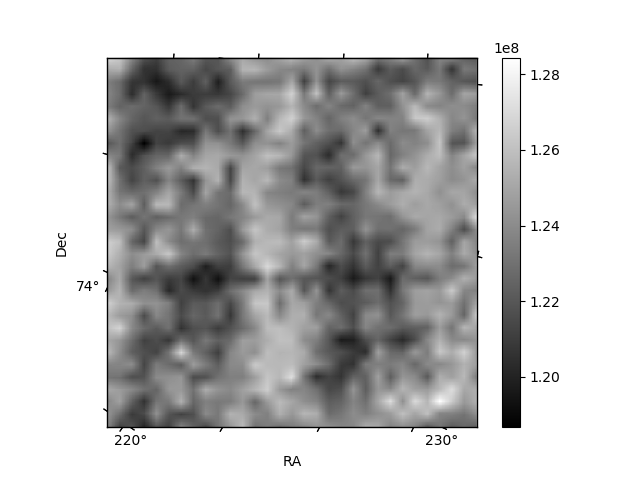
Histogram calculated using DETX and DETY for each event in the final _common_clean file
| Quadrant A | 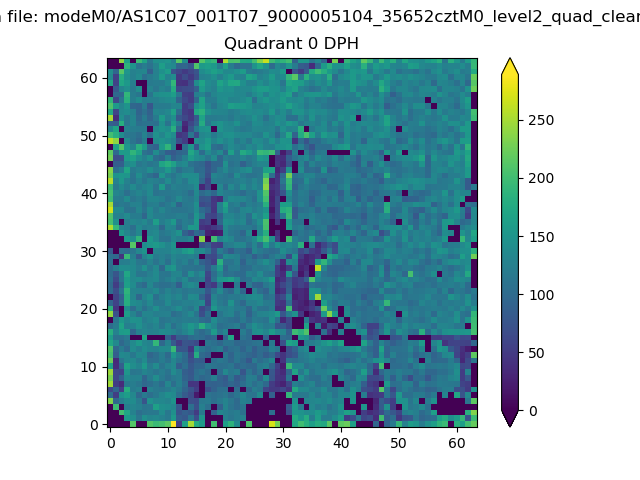 |
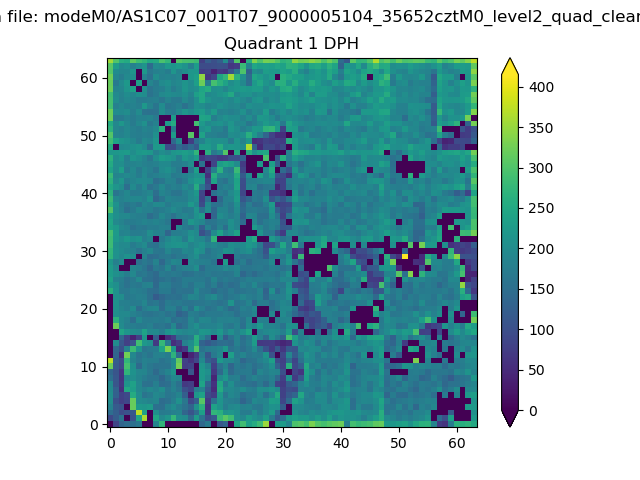 |
Quadrant B |
|---|---|---|---|
| Quadrant D | 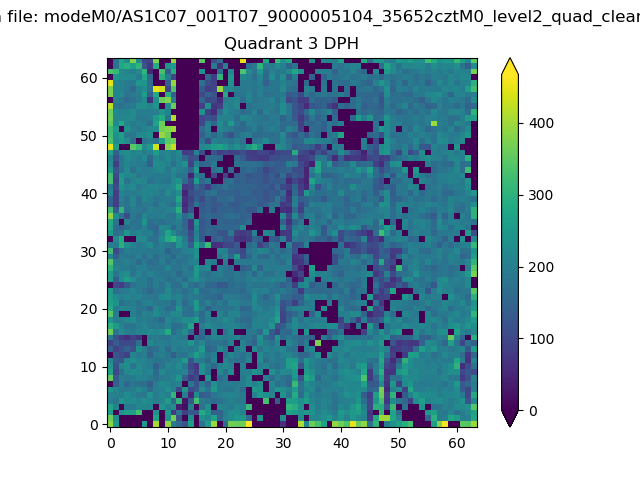 |
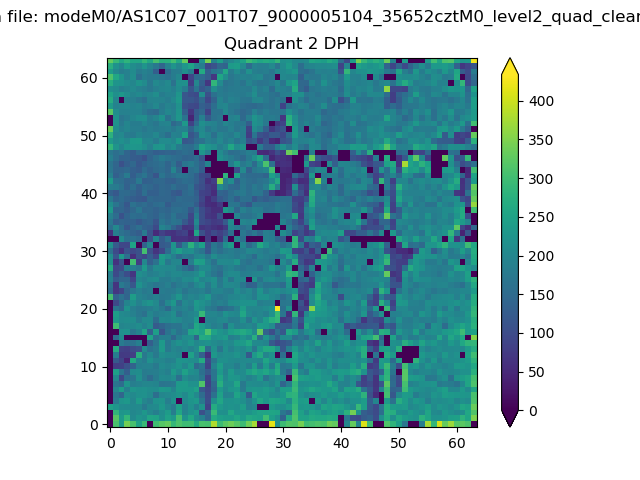 |
Quadrant C |
| Plot type | Count rate plots | Images |
|---|---|---|
| Comparison with Poisson distribution Blue bars denote a histogram of data divided into 1 sec bins. Red curve is a Poisson curve with rate = median count rate of data. |
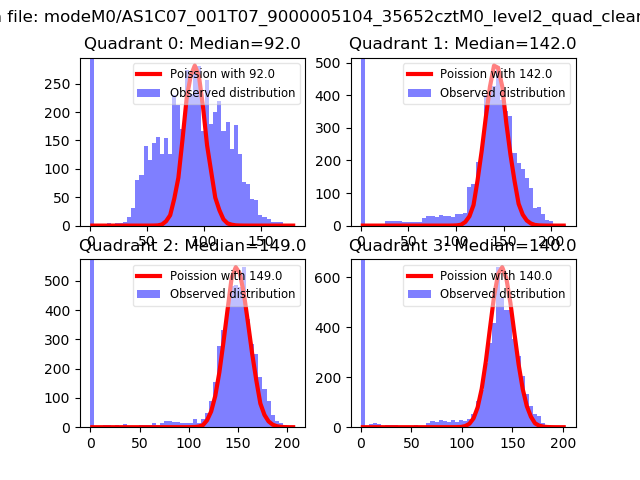 |
 |
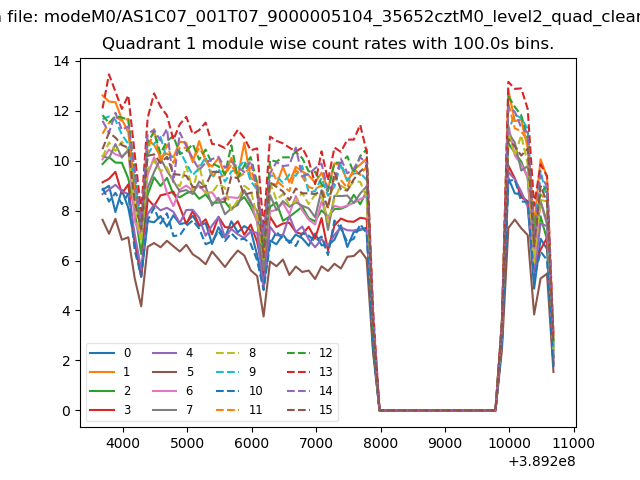
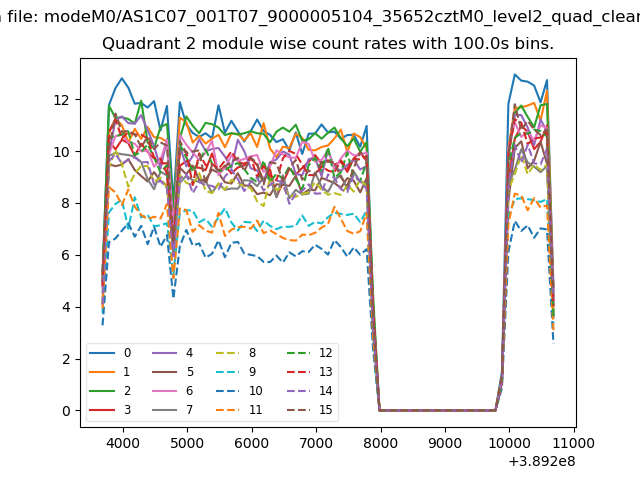
| Quadrant-wise count rates Data is divided into 100 sec bins |
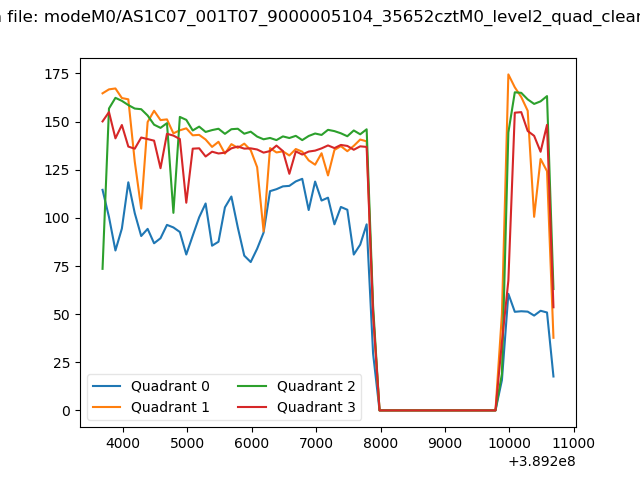 |
|
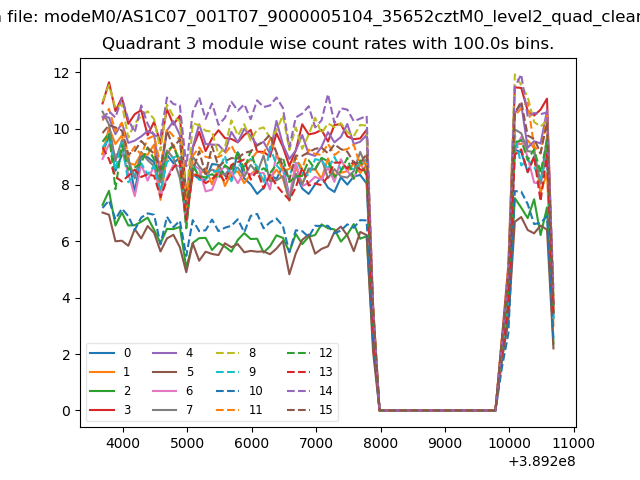
| Module-wise count rates for Quadrant A Data is divided into 100 sec bins |
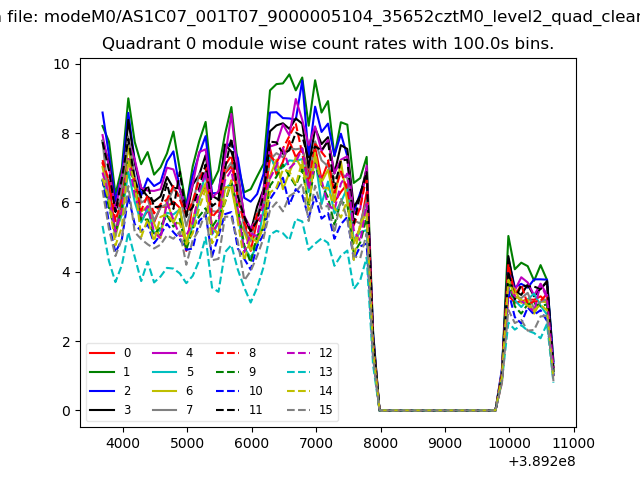 |
 |
| Module-wise count rates for Quadrant B Data is divided into 100 sec bins |
 |
 |
| Module-wise count rates for Quadrant C Data is divided into 100 sec bins |
 |
 |
| Module-wise count rates for Quadrant D Data is divided into 100 sec bins |
 |
 |
| Parameter | Plot |
|---|---|
| CZT HV Monitor | 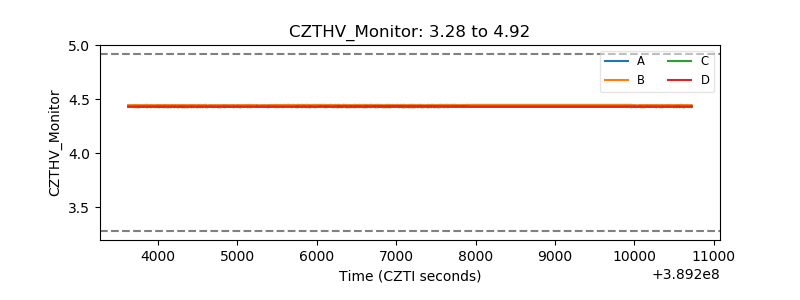 |
| D_VDD | 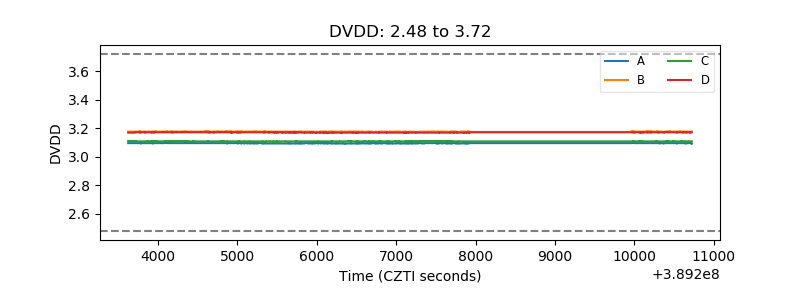 |
| Temperature 1 | 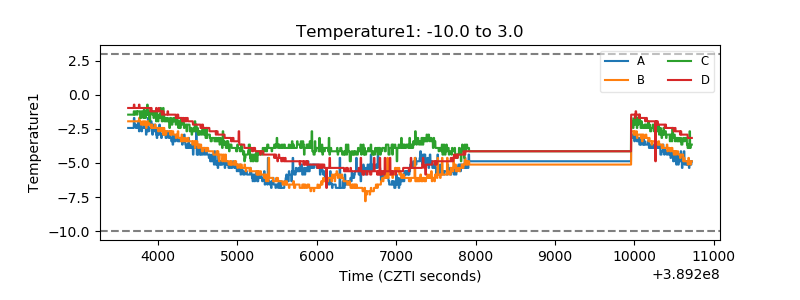 |
| Veto HV Monitor | 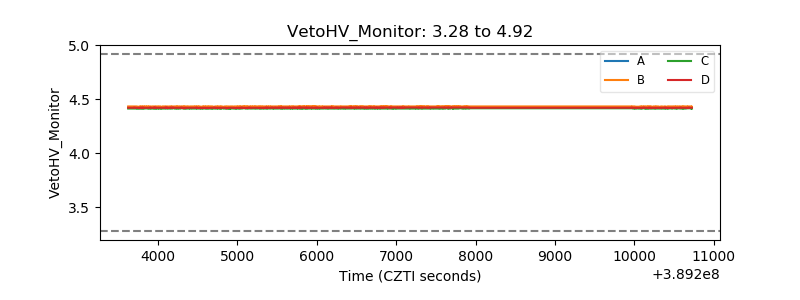 |
| Veto LLD | 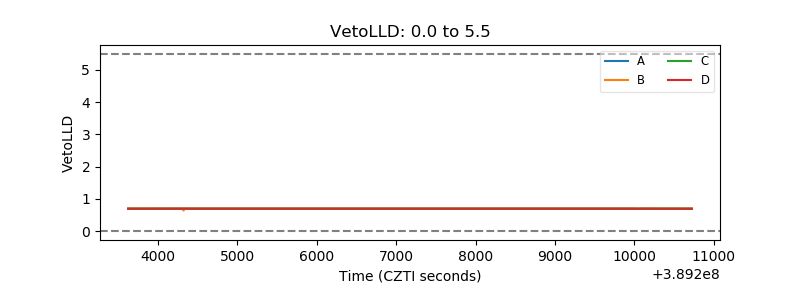 |
| Alpha Counter | 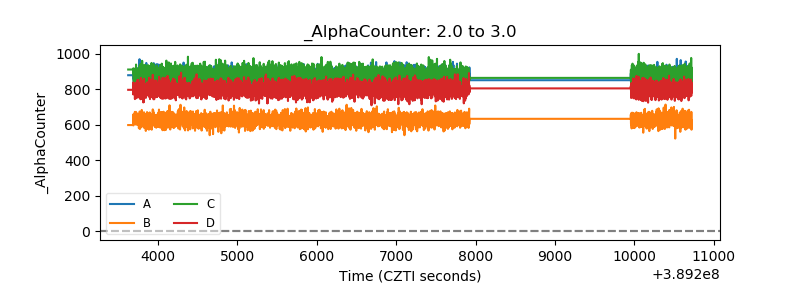 |
| _CPM_Rate | 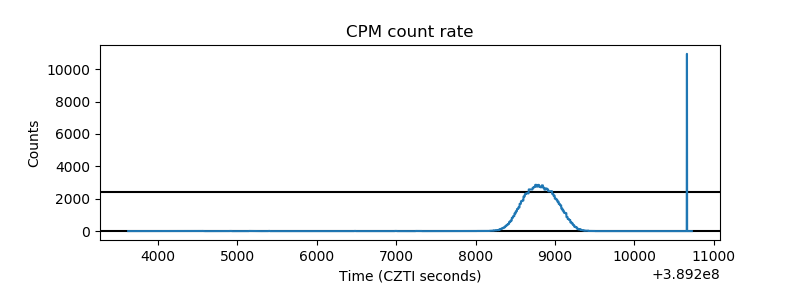 |
| CZT Counter | 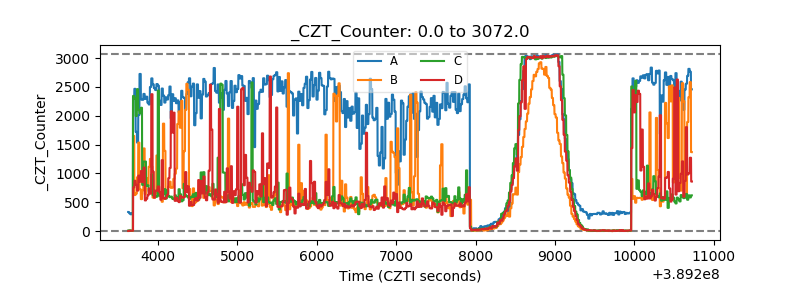 |
| +2.5 Volts monitor | 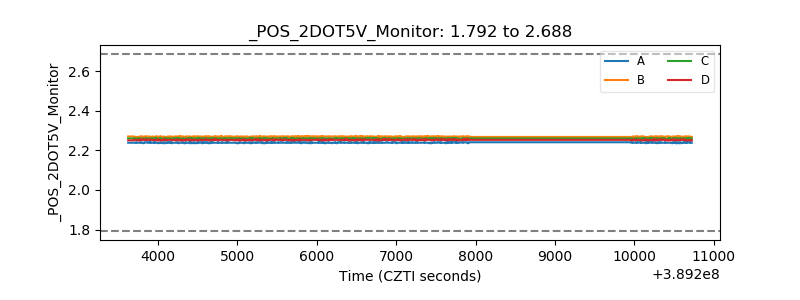 |
| +5 Volts monitor | 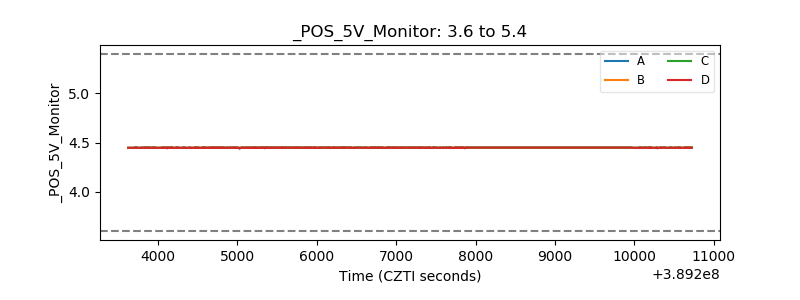 |
| _ROLL_ROT | 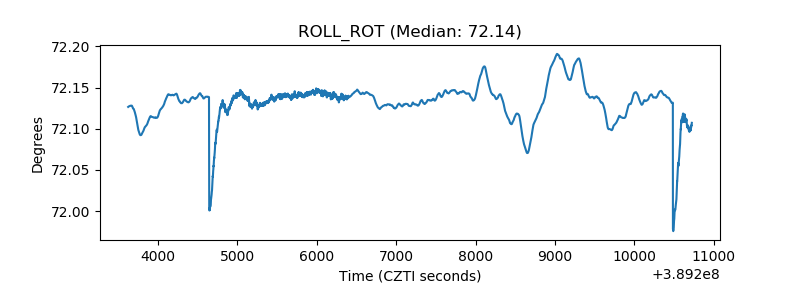 |
| _Roll_DEC | 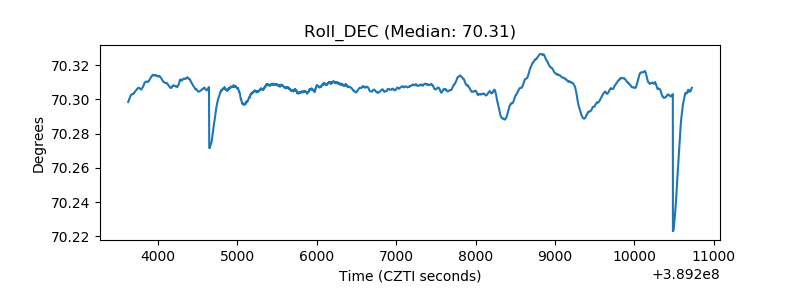 |
| _Roll_RA | 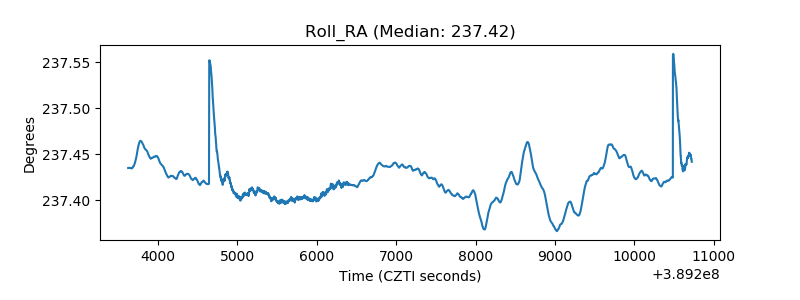 |
| Veto Counter | 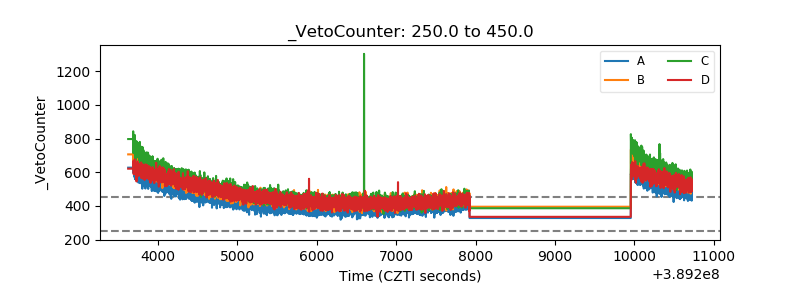 |