| Param | Original file | Final file |
|---|---|---|
| Filename | modeM0/AS1C07_001T07_9000005104_35651cztM0_level2.evt | modeM0/AS1C07_001T07_9000005104_35651cztM0_level2_quad_clean.evt |
| Size (bytes) | 764,988,480 | 90,247,680 |
| Size | 729.5 MB | 86.1 MB |
| Events in quadrant A | 12,681,395 | 323,840 |
| Events in quadrant B | 3,438,228 | 686,646 |
| Events in quadrant C | 3,059,736 | 704,777 |
| Events in quadrant D | 3,647,894 | 662,289 |
| Mode SS | |||
|---|---|---|---|
| Quadrant | BADHDUFLAG | Total packets | Discarded packets |
| A | 0 | 104 | 0 |
| B | 0 | 104 | 0 |
| C | 0 | 104 | 0 |
| D | 0 | 104 | 0 |
| Mode M9 | |||
|---|---|---|---|
| Quadrant | BADHDUFLAG | Total packets | Discarded packets |
| A | 0 | 19 | 0 |
| B | 0 | 19 | 0 |
| C | 0 | 19 | 0 |
| D | 0 | 19 | 0 |
| Mode M0 | |||
|---|---|---|---|
| Quadrant | BADHDUFLAG | Total packets | Discarded packets |
| A | 0 | 41119 | 2 |
| B | 0 | 13625 | 1 |
| C | 0 | 12176 | 1 |
| D | 0 | 14263 | 1 |
| Quadrant | Total seconds | Saturated seconds | Saturation percentage |
|---|---|---|---|
| A | 5031 | 4939 | 98.171338% |
| B | 5031 | 331 | 6.579209% |
| C | 5031 | 121 | 2.405088% |
| D | 5031 | 275 | 5.466110% |
Noise dominated data is calculated using 1-second bins in cleaned event files. If a bin has >2000 counts, and if more than 50% of those come from <1% of pixels, then it is considered to be noise-dominated and hence unusable.
| Quadrant | # 1 sec bins | Bins with >0 counts | Bins with >2000 counts | High rate bins dominated by noise | Noise dominated (total time) | Noise dominated (detector-on time) | Marked lightcurve |
|---|---|---|---|---|---|---|---|
| A | 6973 | 5032 | 4765 | 4765 | 68.34% | 94.69% | 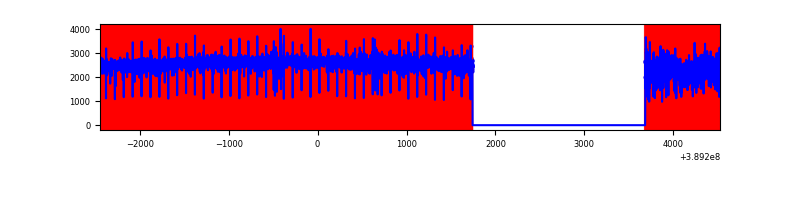 |
| B | 6973 | 5032 | 230 | 230 | 3.30% | 4.57% | 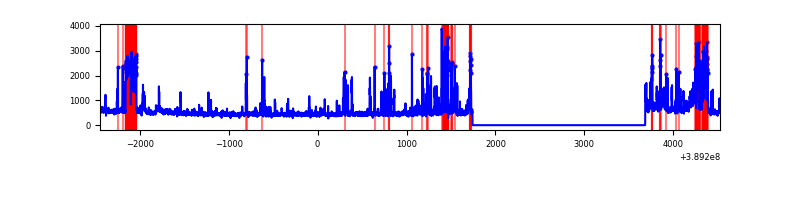 |
| C | 6973 | 5032 | 92 | 92 | 1.32% | 1.83% | 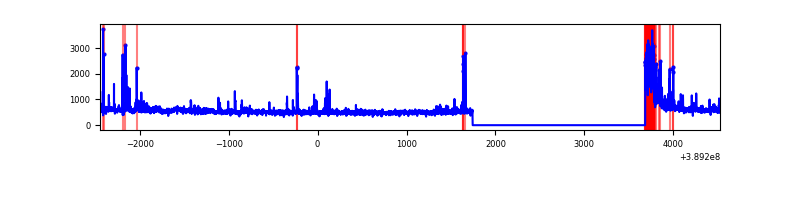 |
| D | 6973 | 5032 | 197 | 197 | 2.83% | 3.91% | 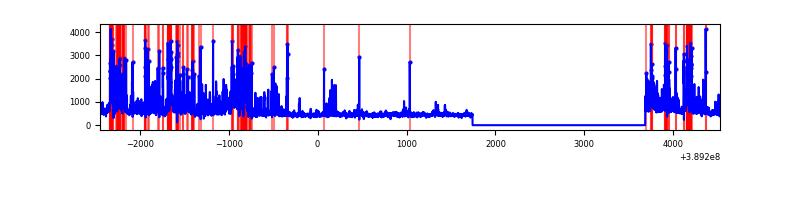 |
Top three noisy pixels from each quadrant. If the there are fewer than three noisy pixels in the level2.evt file, extra rows are filled as -1
| Pixel properties | Quadrant properties | ||||||
|---|---|---|---|---|---|---|---|
| Quadrant | DetID | PixID | Counts | Sigma | Mean | Median | Sigma |
| A | 15 | 169 | 11293649 | 166429.42 | 337 | 331 | 67.9 |
| A | 10 | 83 | 74201 | 1088.62 | 337 | 331 | 67.9 |
| A | 13 | 254 | 4384 | 59.73 | 337 | 331 | 67.9 |
| B | 5 | 172 | 1090067 | 9847.63 | 585 | 572 | 110.6 |
| B | 15 | 85 | 20603 | 181.05 | 585 | 572 | 110.6 |
| B | 12 | 111 | 12784 | 110.38 | 585 | 572 | 110.6 |
| C | 0 | 10 | 292930 | 2158.23 | 595 | 600 | 135.4 |
| C | 15 | 214 | 206137 | 1517.45 | 595 | 600 | 135.4 |
| C | 1 | 23 | 160385 | 1179.67 | 595 | 600 | 135.4 |
| D | 10 | 118 | 289015 | 2059.71 | 587 | 572 | 140.0 |
| D | 2 | 249 | 288479 | 2055.88 | 587 | 572 | 140.0 |
| D | 12 | 233 | 183744 | 1307.99 | 587 | 572 | 140.0 |
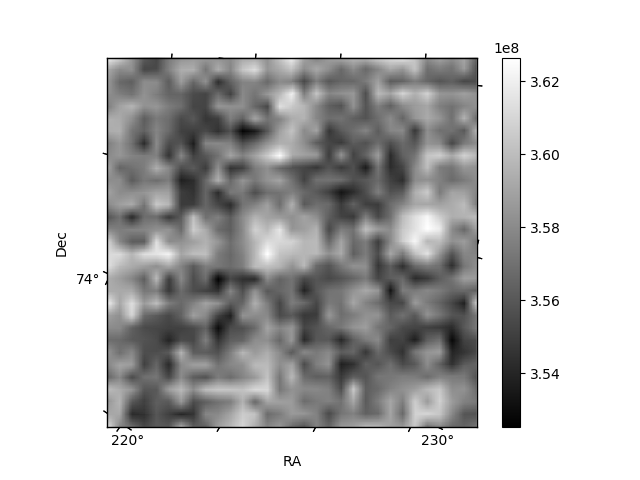
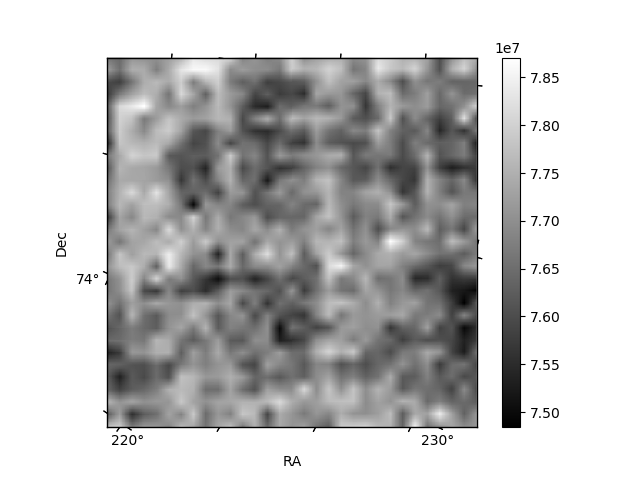
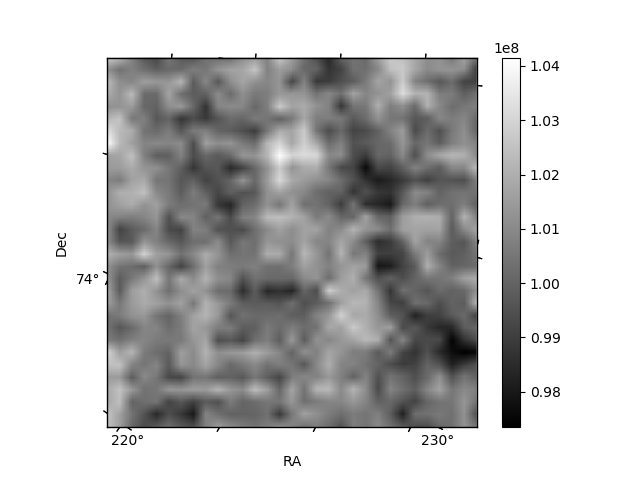
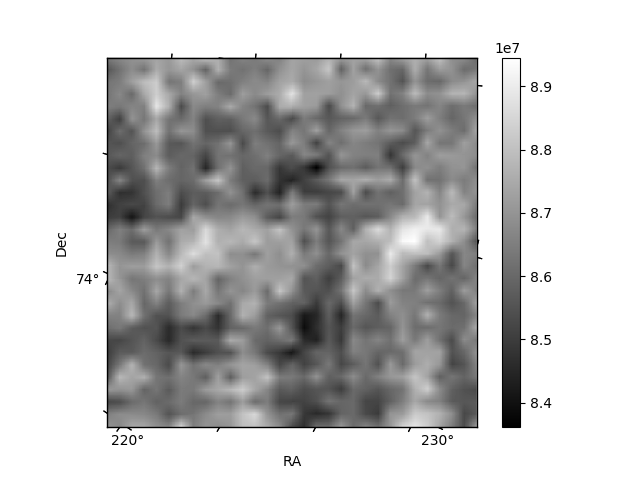
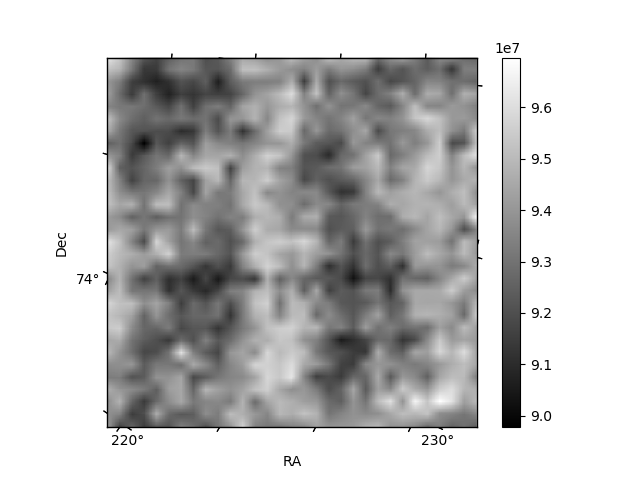
Histogram calculated using DETX and DETY for each event in the final _common_clean file
| Quadrant A | 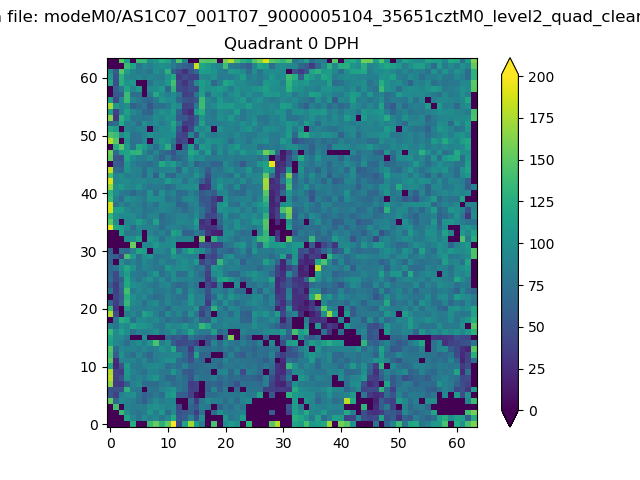 |
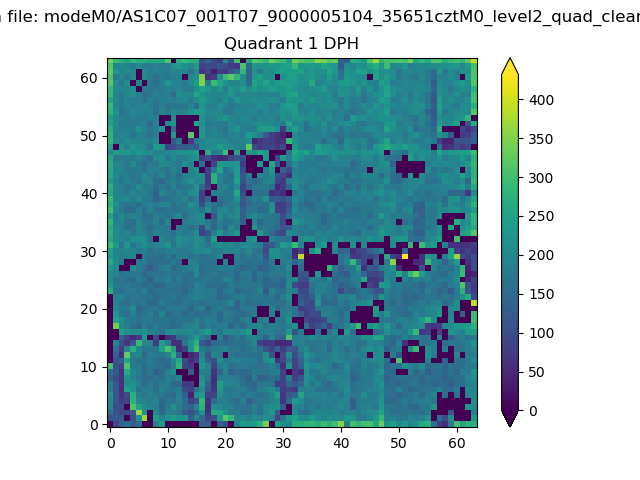 |
Quadrant B |
|---|---|---|---|
| Quadrant D | 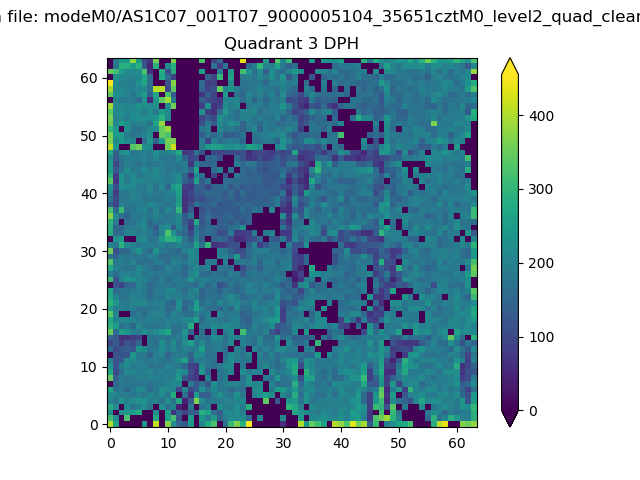 |
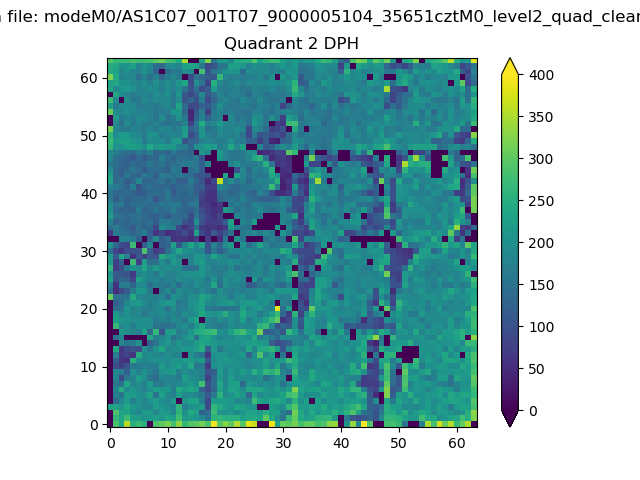 |
Quadrant C |
| Plot type | Count rate plots | Images |
|---|---|---|
| Comparison with Poisson distribution Blue bars denote a histogram of data divided into 1 sec bins. Red curve is a Poisson curve with rate = median count rate of data. |
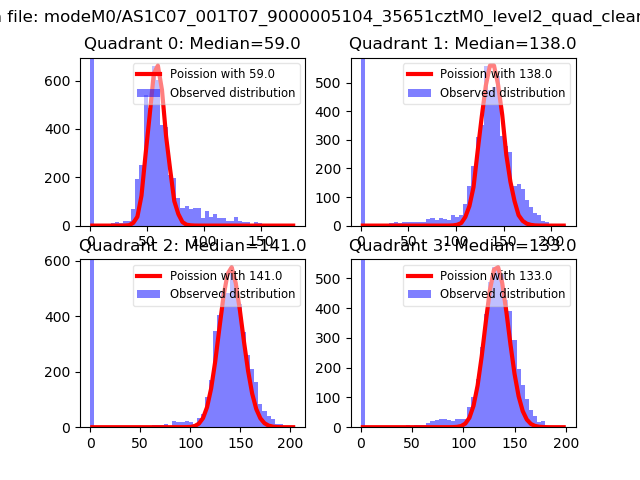 |
 |
| Quadrant-wise count rates Data is divided into 100 sec bins |
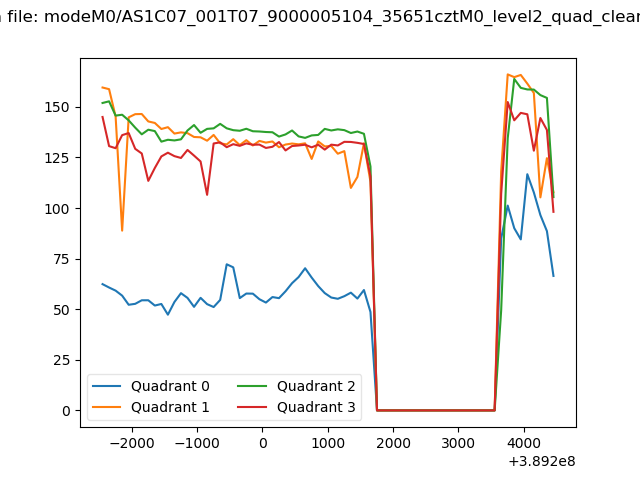 |
|
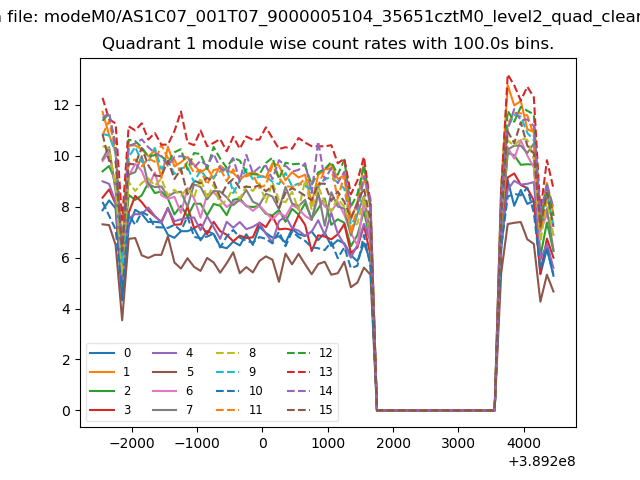
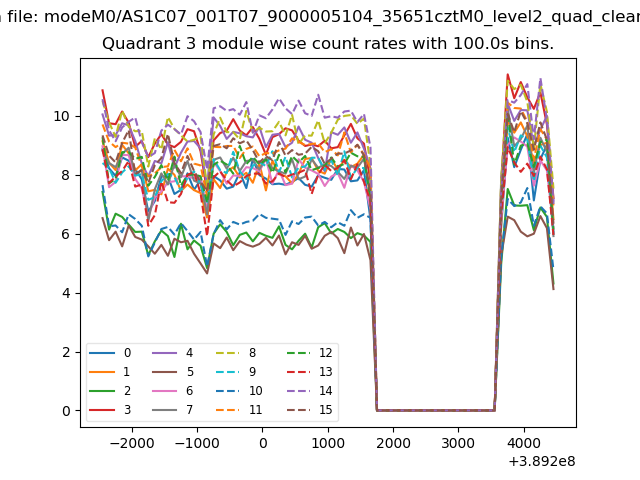
| Module-wise count rates for Quadrant A Data is divided into 100 sec bins |
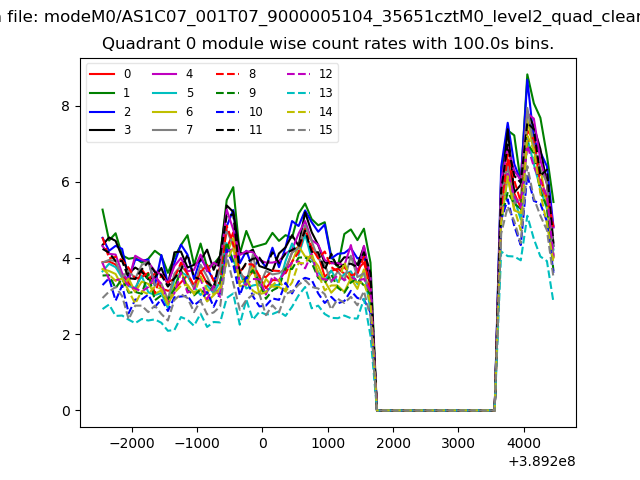 |
 |
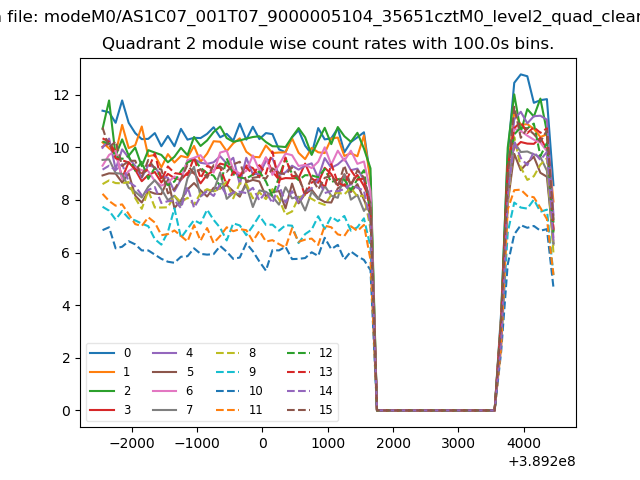
| Module-wise count rates for Quadrant B Data is divided into 100 sec bins |
 |
 |
| Module-wise count rates for Quadrant C Data is divided into 100 sec bins |
 |
 |
| Module-wise count rates for Quadrant D Data is divided into 100 sec bins |
 |
 |
| Parameter | Plot |
|---|---|
| CZT HV Monitor | 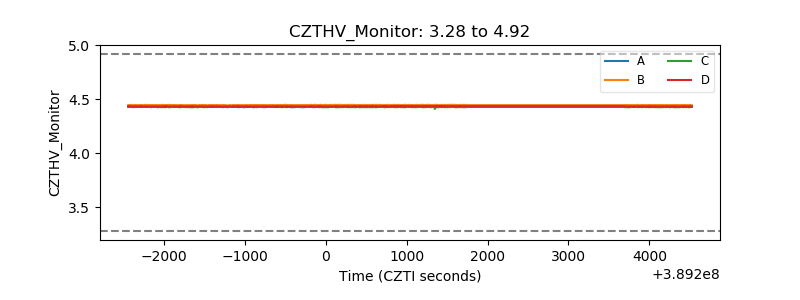 |
| D_VDD | 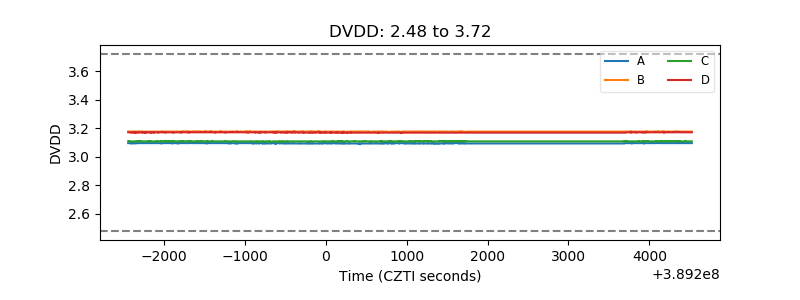 |
| Temperature 1 | 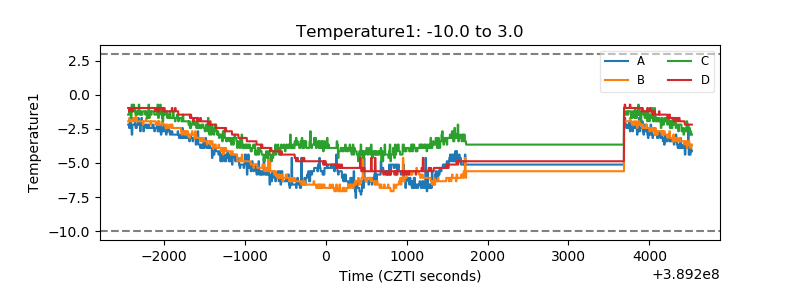 |
| Veto HV Monitor | 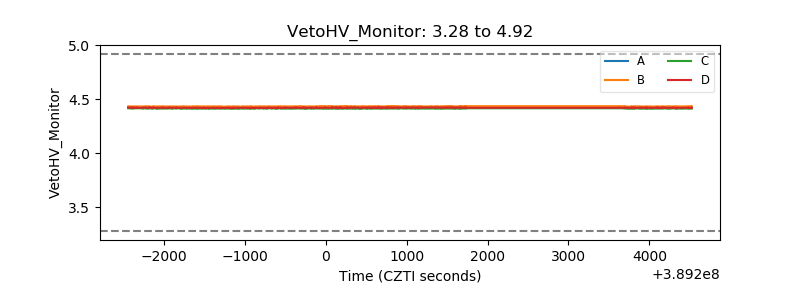 |
| Veto LLD | 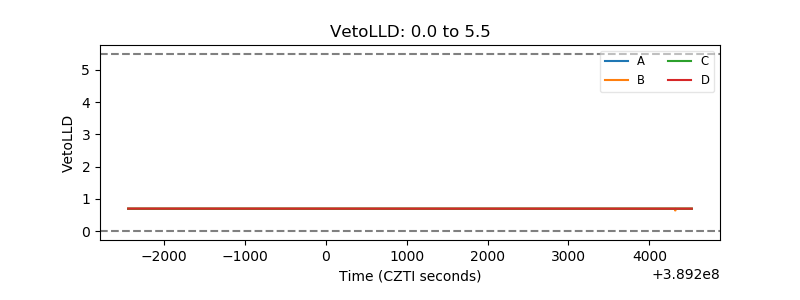 |
| Alpha Counter | 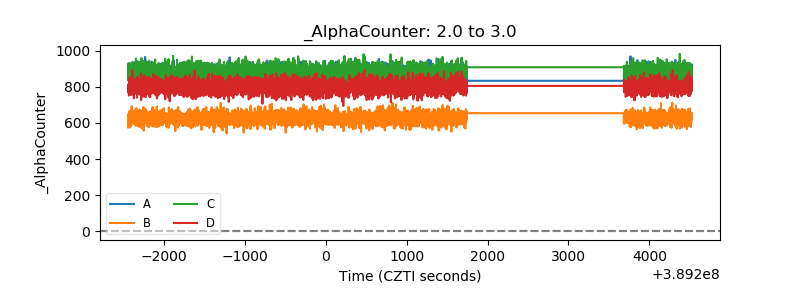 |
| _CPM_Rate | 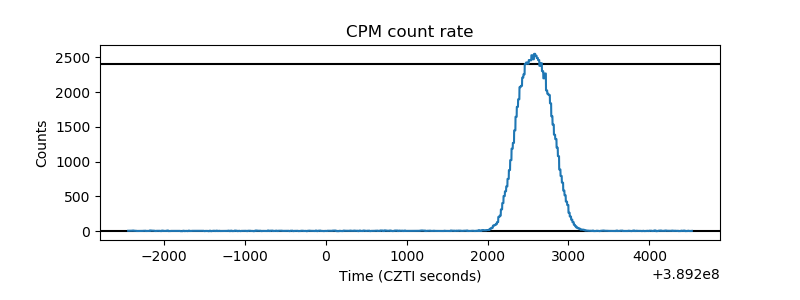 |
| CZT Counter | 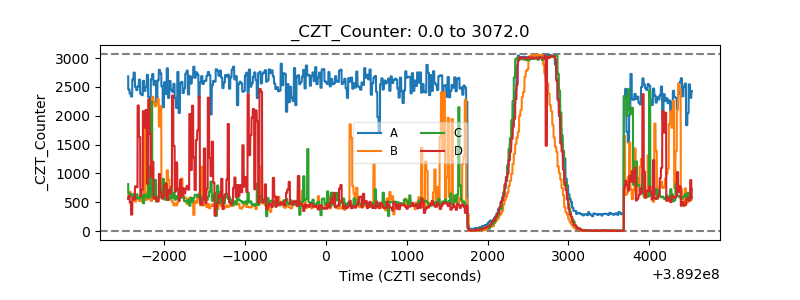 |
| +2.5 Volts monitor | 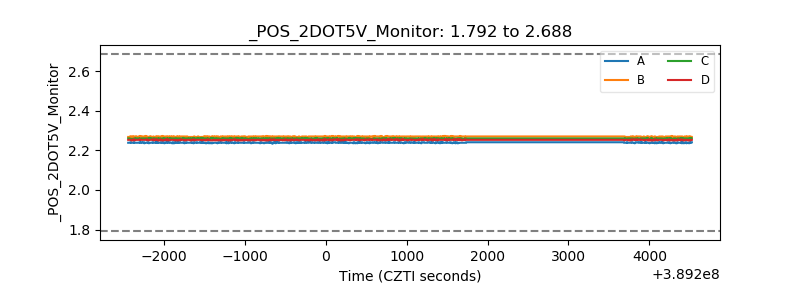 |
| +5 Volts monitor | 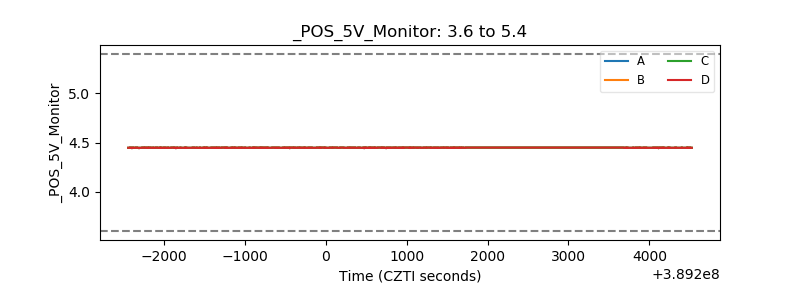 |
| _ROLL_ROT | 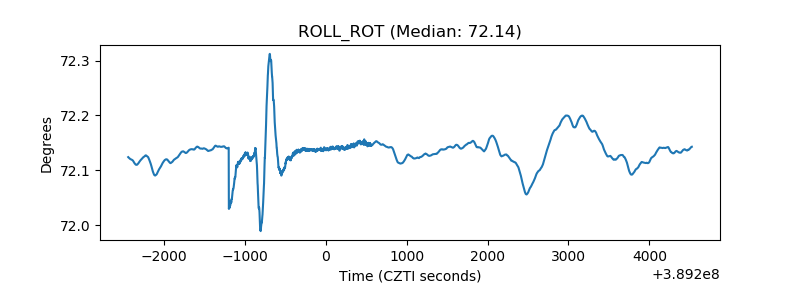 |
| _Roll_DEC | 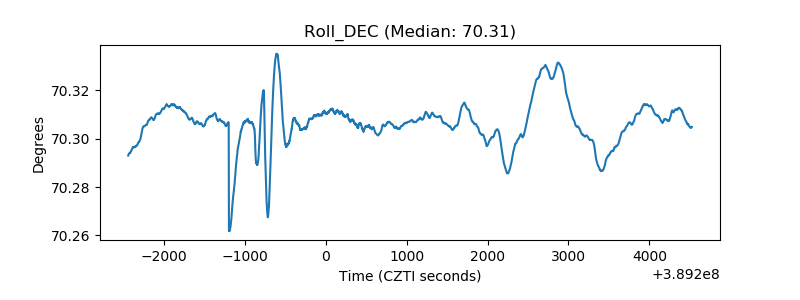 |
| _Roll_RA | 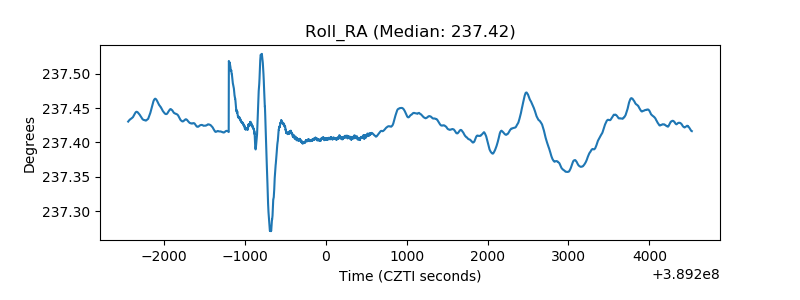 |
| Veto Counter | 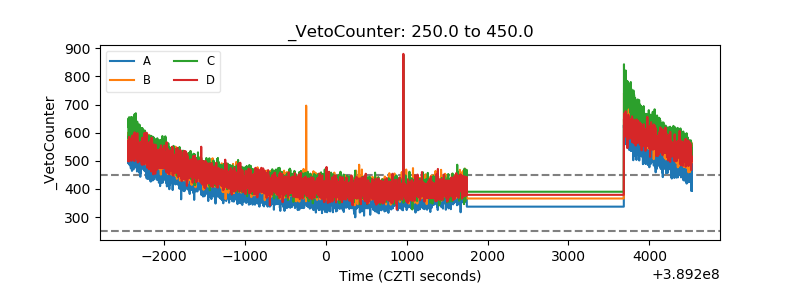 |