| Param | Original file | Final file |
|---|---|---|
| Filename | modeM0/AS1C07_001T07_9000005104_35650cztM0_level2.evt | modeM0/AS1C07_001T07_9000005104_35650cztM0_level2_quad_clean.evt |
| Size (bytes) | 821,977,920 | 81,486,720 |
| Size | 783.9 MB | 77.7 MB |
| Events in quadrant A | 13,812,573 | 252,161 |
| Events in quadrant B | 3,610,258 | 615,072 |
| Events in quadrant C | 3,683,983 | 626,177 |
| Events in quadrant D | 3,420,634 | 592,779 |
| Mode SS | |||
|---|---|---|---|
| Quadrant | BADHDUFLAG | Total packets | Discarded packets |
| A | 0 | 112 | 0 |
| B | 0 | 112 | 0 |
| C | 0 | 112 | 0 |
| D | 0 | 112 | 0 |
| Mode M9 | |||
|---|---|---|---|
| Quadrant | BADHDUFLAG | Total packets | Discarded packets |
| A | 0 | 26 | 0 |
| B | 0 | 26 | 0 |
| C | 0 | 26 | 0 |
| D | 0 | 27 | 0 |
| Mode M0 | |||
|---|---|---|---|
| Quadrant | BADHDUFLAG | Total packets | Discarded packets |
| A | 0 | 44711 | 3 |
| B | 0 | 14304 | 2 |
| C | 0 | 14288 | 2 |
| D | 0 | 13677 | 2 |
| Quadrant | Total seconds | Saturated seconds | Saturation percentage |
|---|---|---|---|
| A | 5409 | 5409 | 100.000000% |
| B | 5409 | 388 | 7.173230% |
| C | 5409 | 273 | 5.047144% |
| D | 5409 | 143 | 2.643742% |
Noise dominated data is calculated using 1-second bins in cleaned event files. If a bin has >2000 counts, and if more than 50% of those come from <1% of pixels, then it is considered to be noise-dominated and hence unusable.
| Quadrant | # 1 sec bins | Bins with >0 counts | Bins with >2000 counts | High rate bins dominated by noise | Noise dominated (total time) | Noise dominated (detector-on time) | Marked lightcurve |
|---|---|---|---|---|---|---|---|
| A | 7201 | 5410 | 5320 | 5320 | 73.88% | 98.34% | 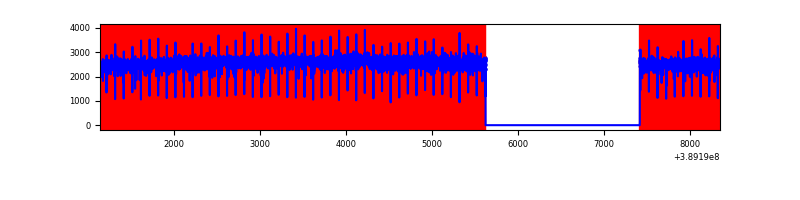 |
| B | 7201 | 5410 | 277 | 277 | 3.85% | 5.12% | 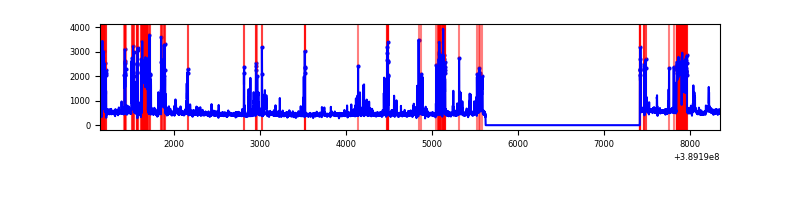 |
| C | 7201 | 5410 | 210 | 210 | 2.92% | 3.88% | 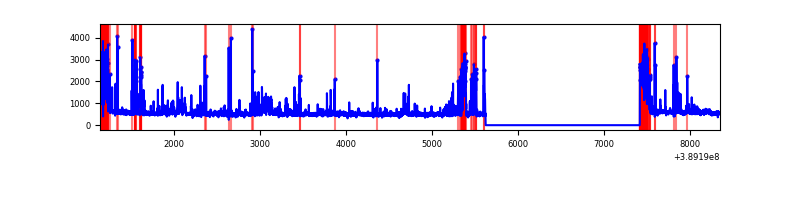 |
| D | 7200 | 5409 | 106 | 106 | 1.47% | 1.96% | 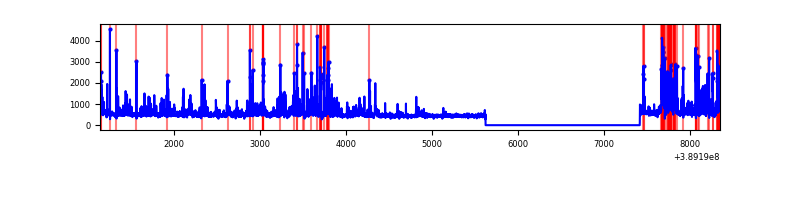 |
Top three noisy pixels from each quadrant. If the there are fewer than three noisy pixels in the level2.evt file, extra rows are filled as -1
| Pixel properties | Quadrant properties | ||||||
|---|---|---|---|---|---|---|---|
| Quadrant | DetID | PixID | Counts | Sigma | Mean | Median | Sigma |
| A | 15 | 169 | 12485528 | 193847.12 | 321 | 315 | 64.4 |
| A | 10 | 83 | 75456 | 1166.65 | 321 | 315 | 64.4 |
| A | 13 | 6 | 6153 | 90.64 | 321 | 315 | 64.4 |
| B | 5 | 172 | 1098164 | 9414.47 | 613 | 597 | 116.6 |
| B | 15 | 85 | 51490 | 436.54 | 613 | 597 | 116.6 |
| B | 12 | 111 | 13978 | 114.78 | 613 | 597 | 116.6 |
| C | 0 | 10 | 488899 | 3473.38 | 614 | 618 | 140.6 |
| C | 1 | 23 | 368364 | 2615.96 | 614 | 618 | 140.6 |
| C | 15 | 214 | 222296 | 1576.91 | 614 | 618 | 140.6 |
| D | 12 | 233 | 187340 | 1241.64 | 623 | 608 | 150.4 |
| D | 2 | 249 | 137749 | 911.89 | 623 | 608 | 150.4 |
| D | 8 | 195 | 110639 | 731.63 | 623 | 608 | 150.4 |
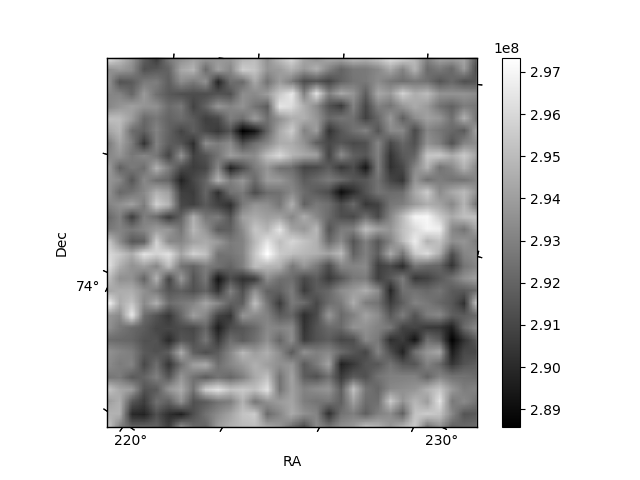
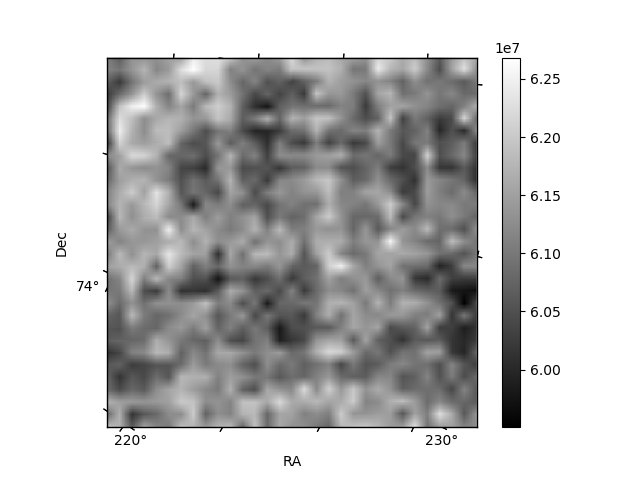
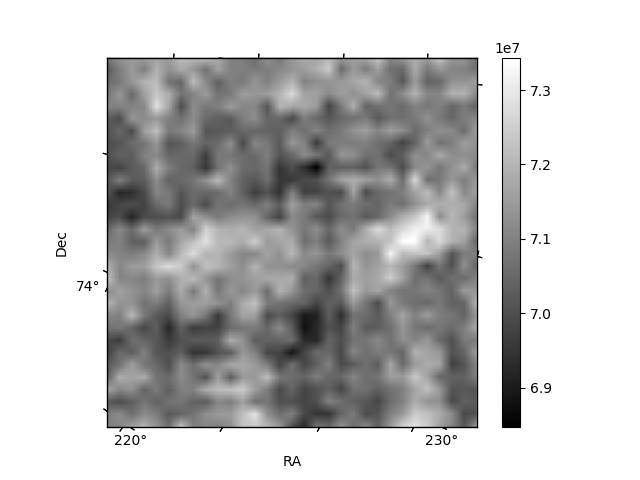
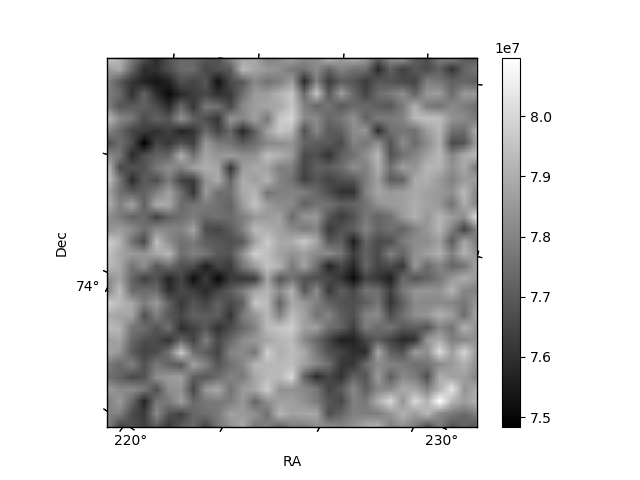
Histogram calculated using DETX and DETY for each event in the final _common_clean file
| Quadrant A | 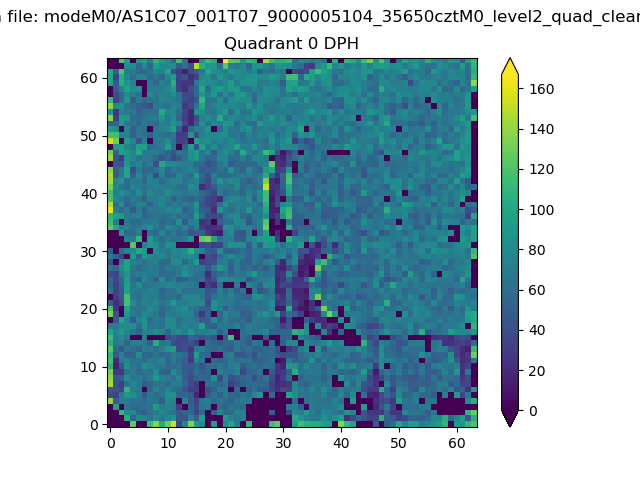 |
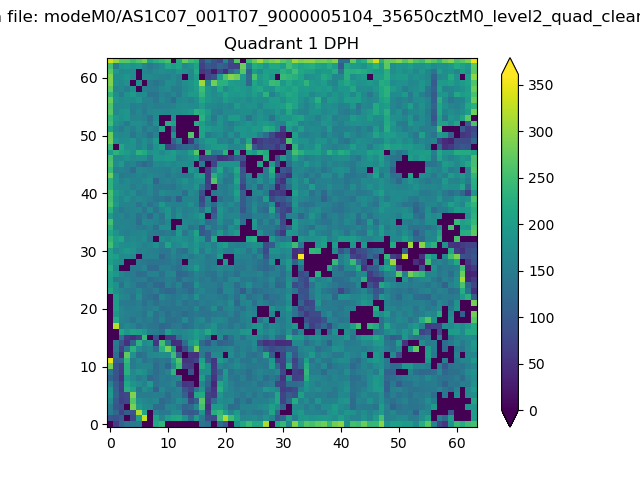 |
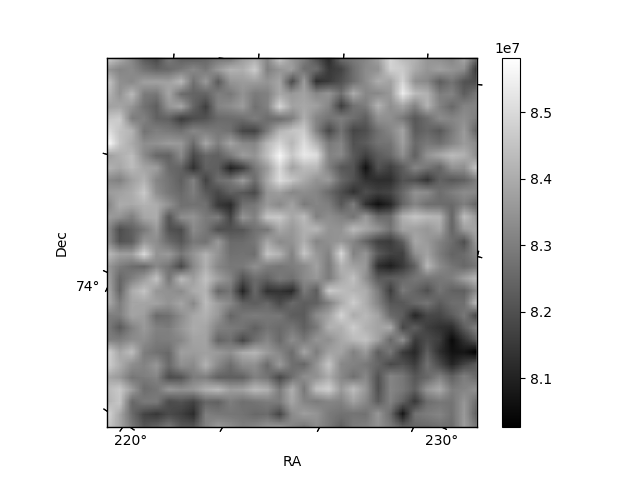
Quadrant B |
|---|---|---|---|
| Quadrant D | 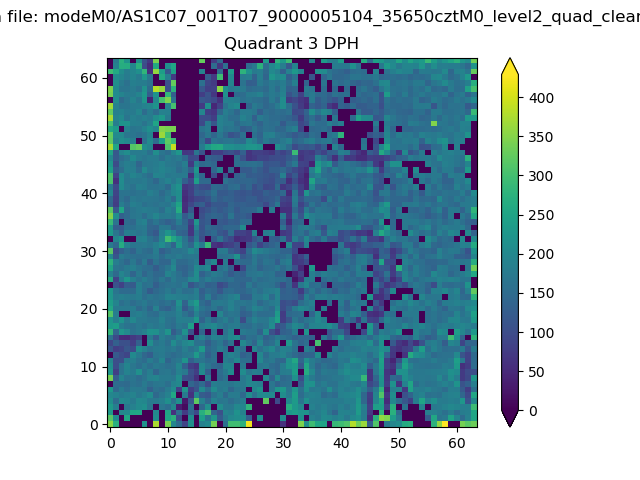 |
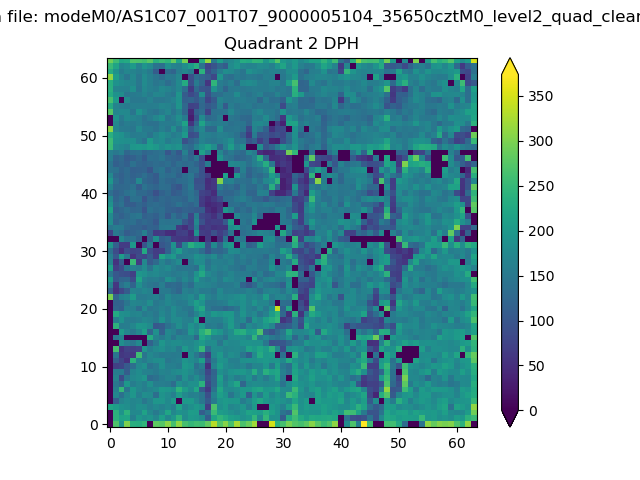 |
Quadrant C |
| Plot type | Count rate plots | Images |
|---|---|---|
| Comparison with Poisson distribution Blue bars denote a histogram of data divided into 1 sec bins. Red curve is a Poisson curve with rate = median count rate of data. |
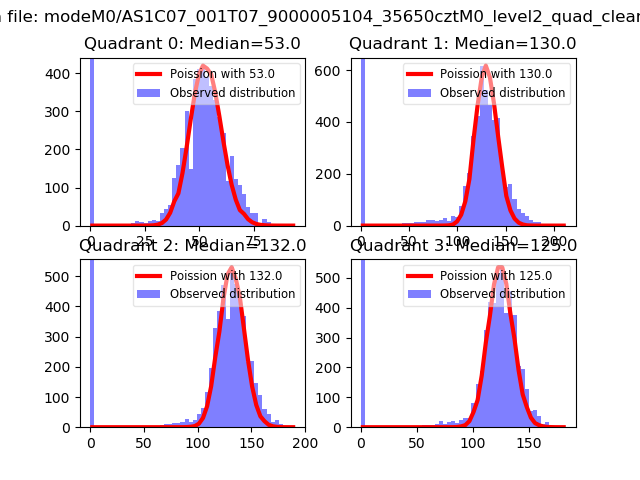 |
 |
| Quadrant-wise count rates Data is divided into 100 sec bins |
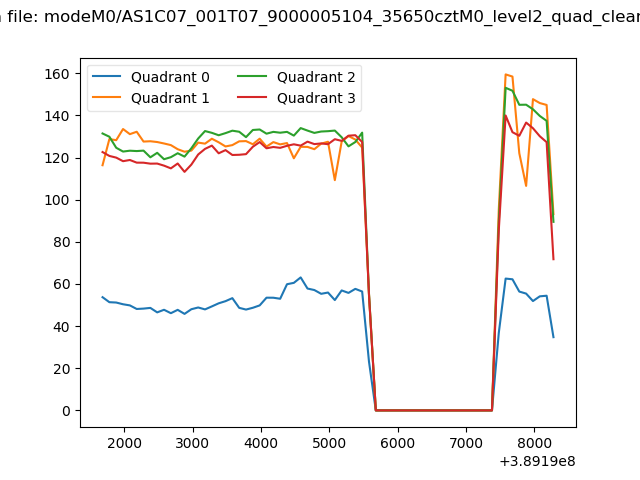 |
|
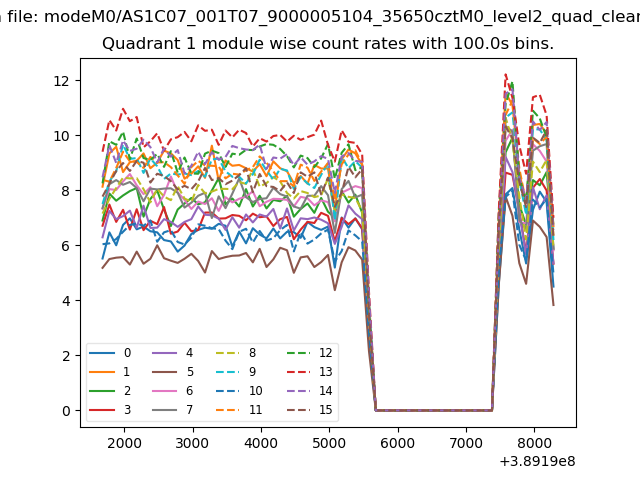
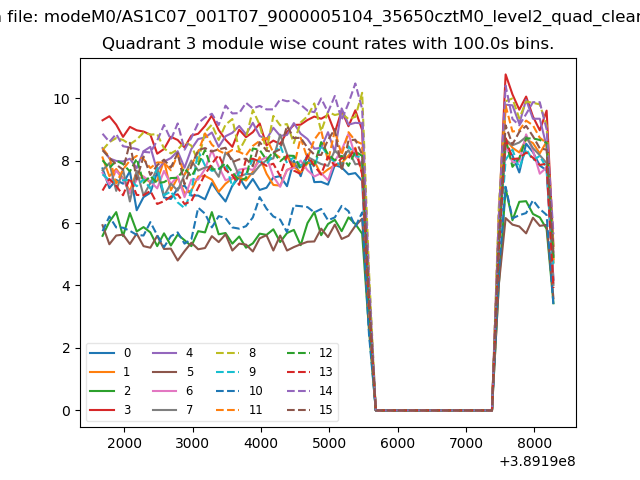
| Module-wise count rates for Quadrant A Data is divided into 100 sec bins |
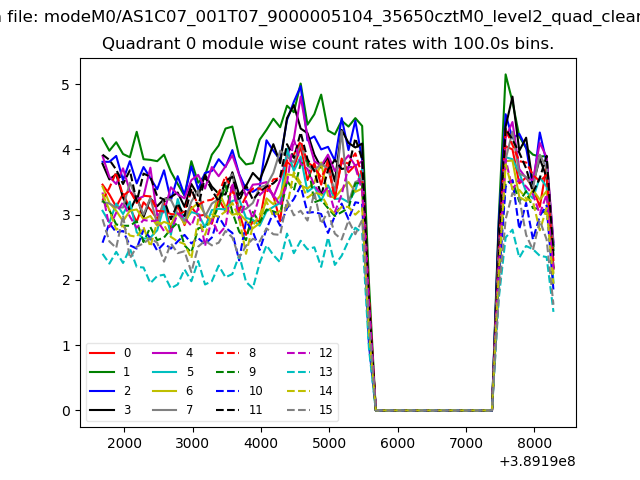 |
 |
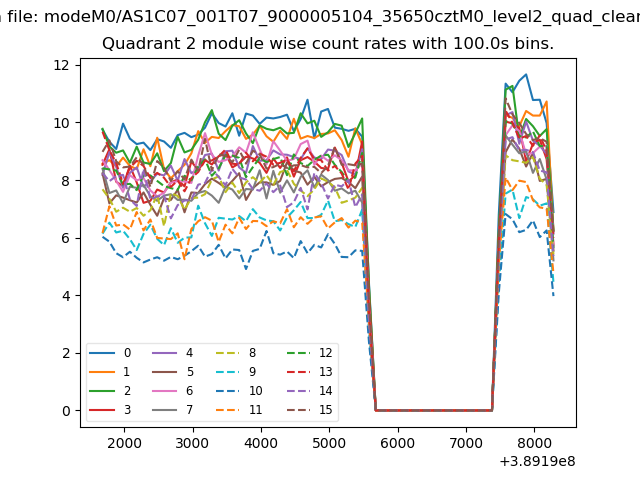
| Module-wise count rates for Quadrant B Data is divided into 100 sec bins |
 |
 |
| Module-wise count rates for Quadrant C Data is divided into 100 sec bins |
 |
 |
| Module-wise count rates for Quadrant D Data is divided into 100 sec bins |
 |
 |
| Parameter | Plot |
|---|---|
| CZT HV Monitor | 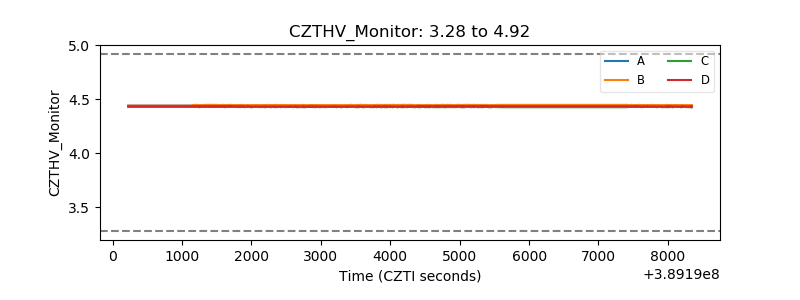 |
| D_VDD | 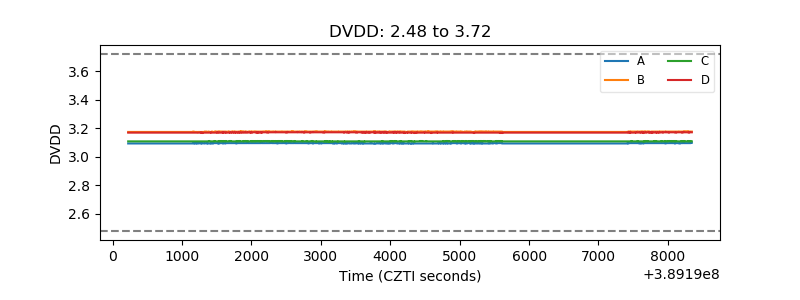 |
| Temperature 1 | 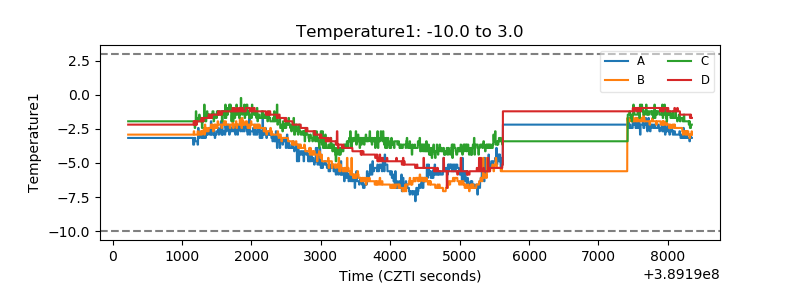 |
| Veto HV Monitor | 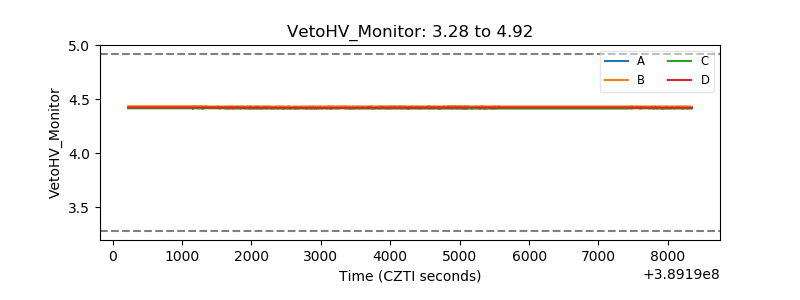 |
| Veto LLD | 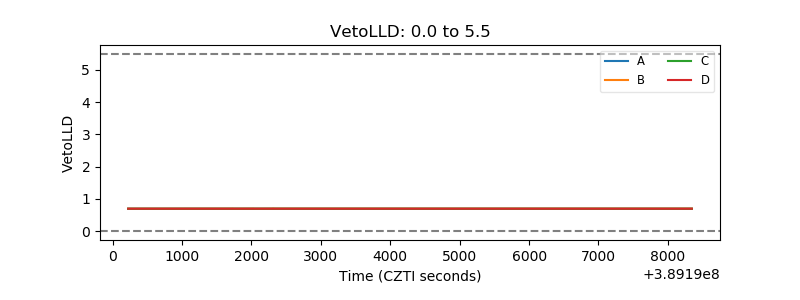 |
| Alpha Counter | 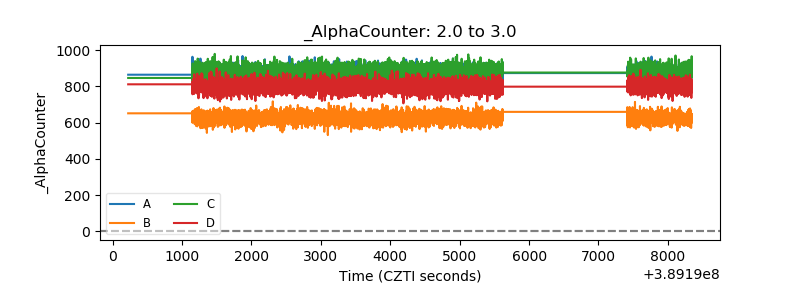 |
| _CPM_Rate | 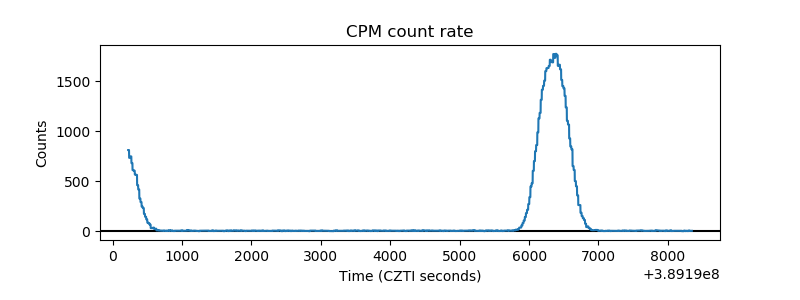 |
| CZT Counter | 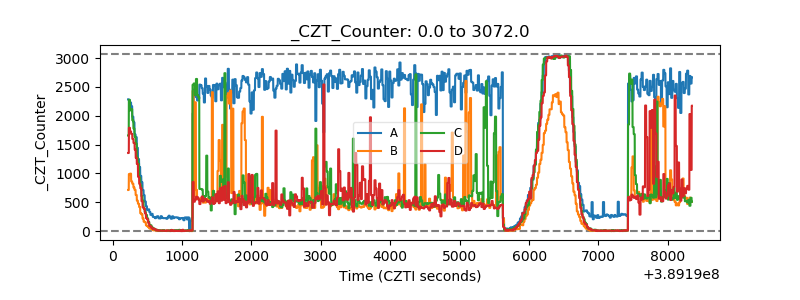 |
| +2.5 Volts monitor | 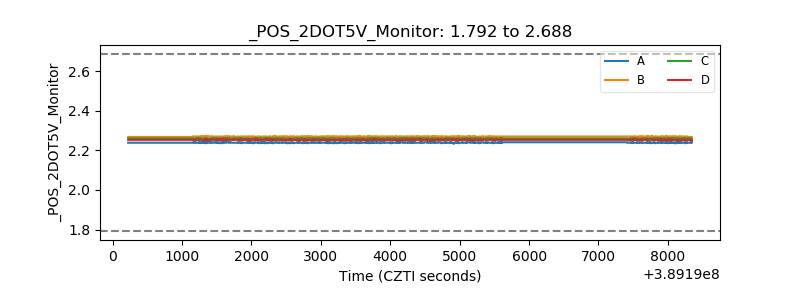 |
| +5 Volts monitor | 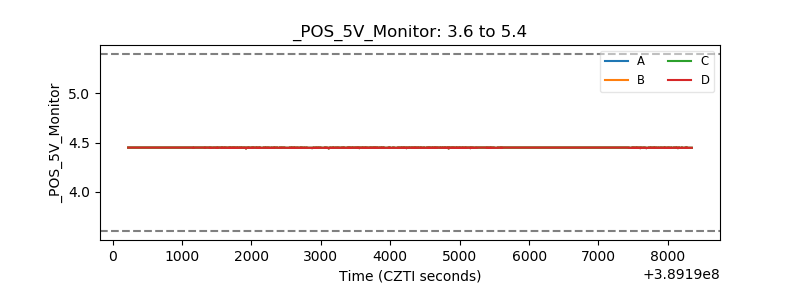 |
| _ROLL_ROT | 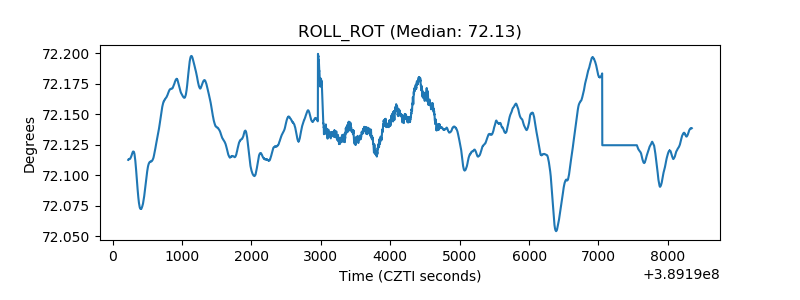 |
| _Roll_DEC | 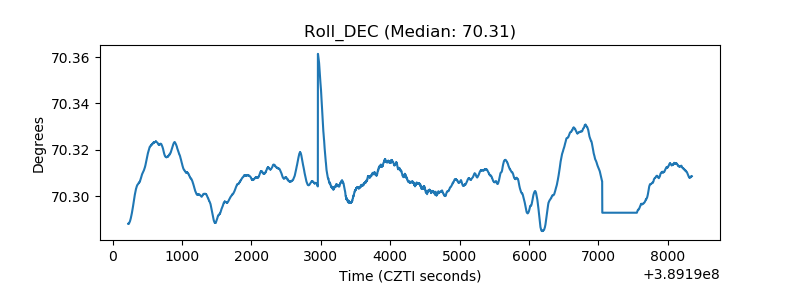 |
| _Roll_RA | 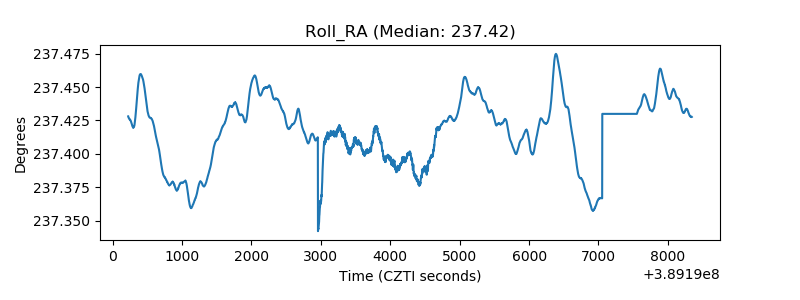 |
| Veto Counter | 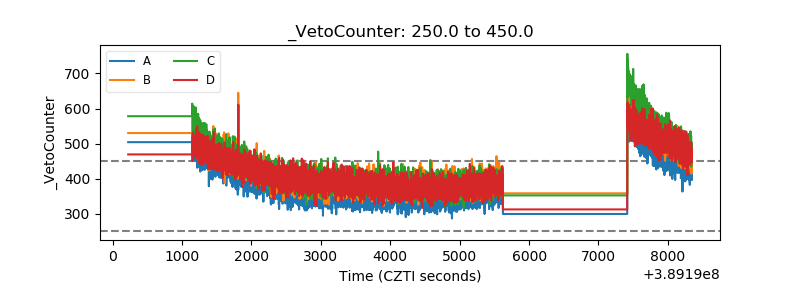 |