| Param | Original file | Final file |
|---|---|---|
| Filename | modeM0/AS1A11_106T01_9000005102_35639cztM0_level2.evt | modeM0/AS1A11_106T01_9000005102_35639cztM0_level2_quad_clean.evt |
| Size (bytes) | 755,352,000 | 74,689,920 |
| Size | 720.4 MB | 71.2 MB |
| Events in quadrant A | 12,435,486 | 334,760 |
| Events in quadrant B | 3,533,242 | 525,677 |
| Events in quadrant C | 3,578,859 | 516,813 |
| Events in quadrant D | 2,963,243 | 505,345 |
| Mode SS | |||
|---|---|---|---|
| Quadrant | BADHDUFLAG | Total packets | Discarded packets |
| A | 0 | 112 | 0 |
| B | 0 | 112 | 0 |
| C | 0 | 112 | 0 |
| D | 0 | 112 | 0 |
| Mode M0 | |||
|---|---|---|---|
| Quadrant | BADHDUFLAG | Total packets | Discarded packets |
| A | 0 | 40542 | 3 |
| B | 0 | 13843 | 2 |
| C | 0 | 13985 | 2 |
| D | 0 | 12177 | 2 |
| Mode M9 | |||
|---|---|---|---|
| Quadrant | BADHDUFLAG | Total packets | Discarded packets |
| A | 0 | 42 | 0 |
| B | 0 | 42 | 0 |
| C | 0 | 42 | 0 |
| D | 0 | 42 | 0 |
| Quadrant | Total seconds | Saturated seconds | Saturation percentage |
|---|---|---|---|
| A | 5392 | 4965 | 92.080861% |
| B | 5392 | 195 | 3.616469% |
| C | 5392 | 208 | 3.857567% |
| D | 5392 | 61 | 1.131306% |
Noise dominated data is calculated using 1-second bins in cleaned event files. If a bin has >2000 counts, and if more than 50% of those come from <1% of pixels, then it is considered to be noise-dominated and hence unusable.
| Quadrant | # 1 sec bins | Bins with >0 counts | Bins with >2000 counts | High rate bins dominated by noise | Noise dominated (total time) | Noise dominated (detector-on time) | Marked lightcurve |
|---|---|---|---|---|---|---|---|
| A | 9577 | 5393 | 4776 | 4776 | 49.87% | 88.56% | 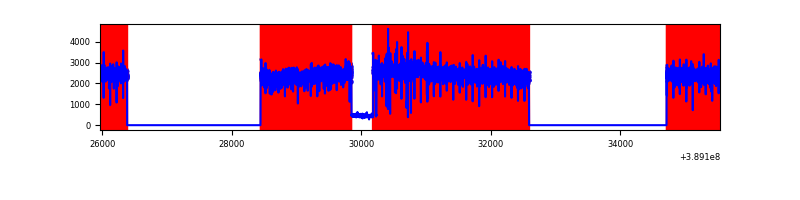 |
| B | 9577 | 5394 | 121 | 121 | 1.26% | 2.24% | 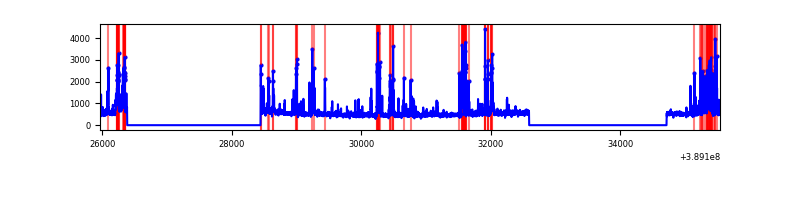 |
| C | 9577 | 5394 | 165 | 165 | 1.72% | 3.06% | 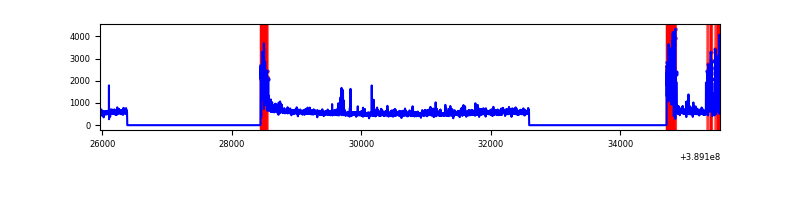 |
| D | 9577 | 5394 | 57 | 57 | 0.60% | 1.06% | 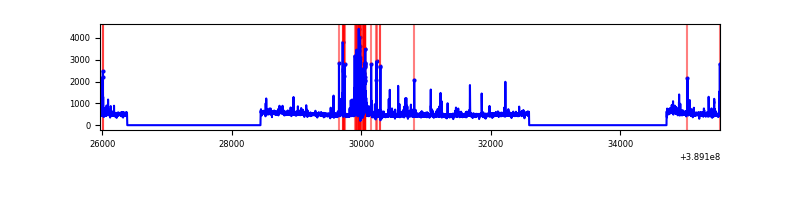 |
Top three noisy pixels from each quadrant. If the there are fewer than three noisy pixels in the level2.evt file, extra rows are filled as -1
| Pixel properties | Quadrant properties | ||||||
|---|---|---|---|---|---|---|---|
| Quadrant | DetID | PixID | Counts | Sigma | Mean | Median | Sigma |
| A | 15 | 169 | 10532089 | 113865.85 | 459 | 450 | 92.5 |
| A | 10 | 83 | 97637 | 1050.77 | 459 | 450 | 92.5 |
| A | 12 | 189 | 20201 | 213.54 | 459 | 450 | 92.5 |
| B | 5 | 172 | 874490 | 7013.91 | 660 | 643 | 124.6 |
| B | 0 | 197 | 35587 | 280.48 | 660 | 643 | 124.6 |
| B | 0 | 189 | 20785 | 161.67 | 660 | 643 | 124.6 |
| C | 0 | 10 | 739120 | 4908.75 | 655 | 661 | 150.4 |
| C | 15 | 214 | 222197 | 1472.61 | 655 | 661 | 150.4 |
| C | 7 | 220 | 55599 | 365.19 | 655 | 661 | 150.4 |
| D | 12 | 217 | 151408 | 947.92 | 658 | 643 | 159.0 |
| D | 13 | 249 | 125663 | 786.05 | 658 | 643 | 159.0 |
| D | 2 | 153 | 76292 | 475.64 | 658 | 643 | 159.0 |
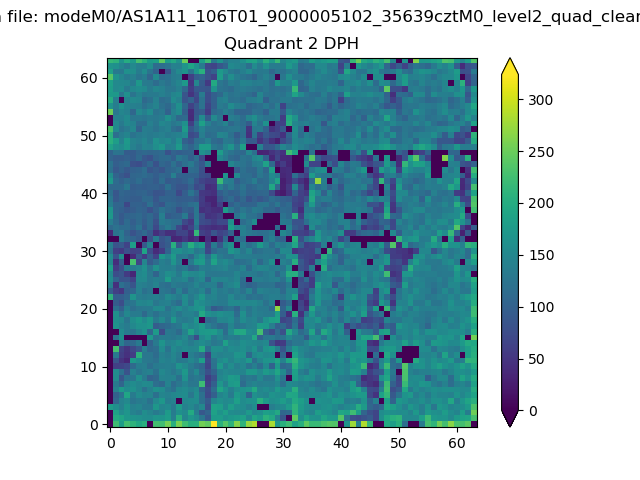
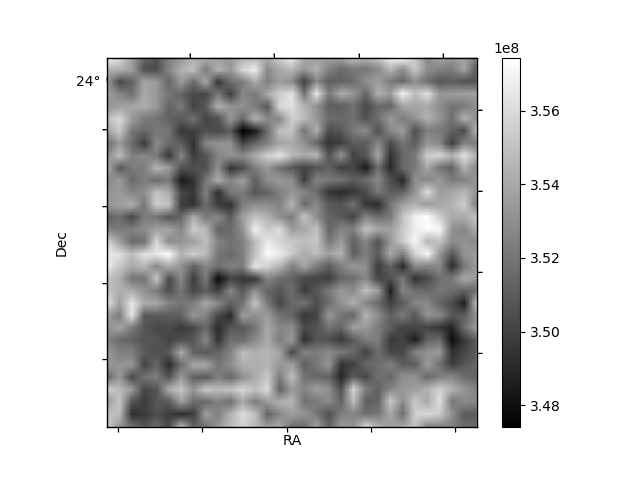
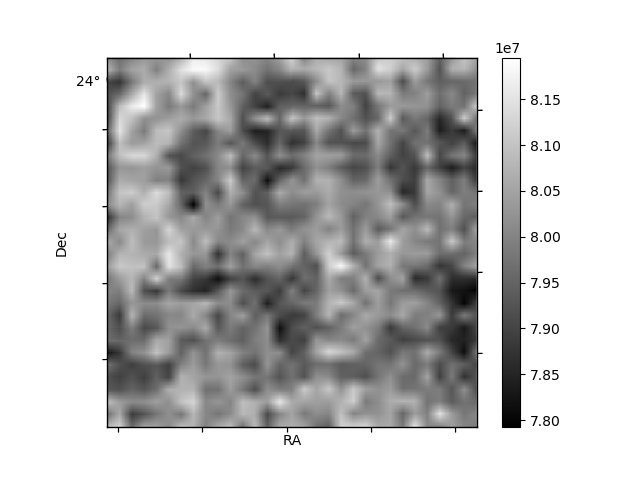
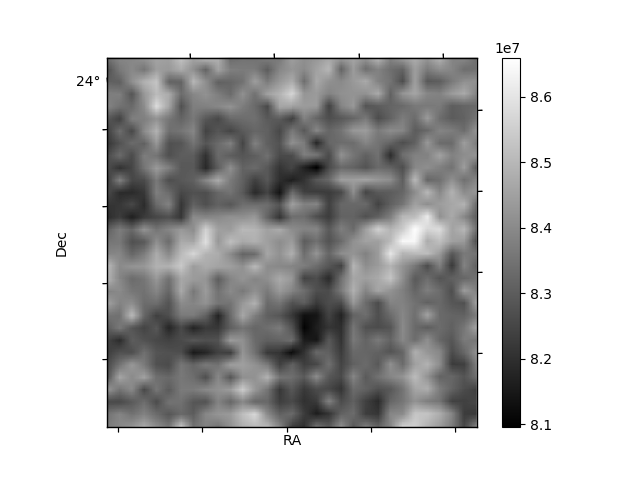
Histogram calculated using DETX and DETY for each event in the final _common_clean file
| Quadrant A | 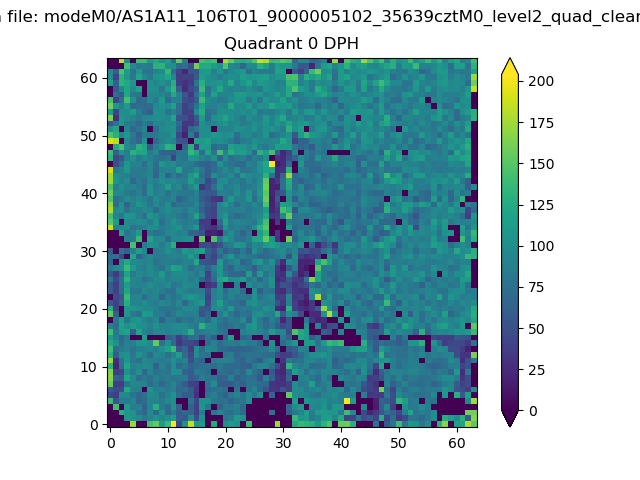 |
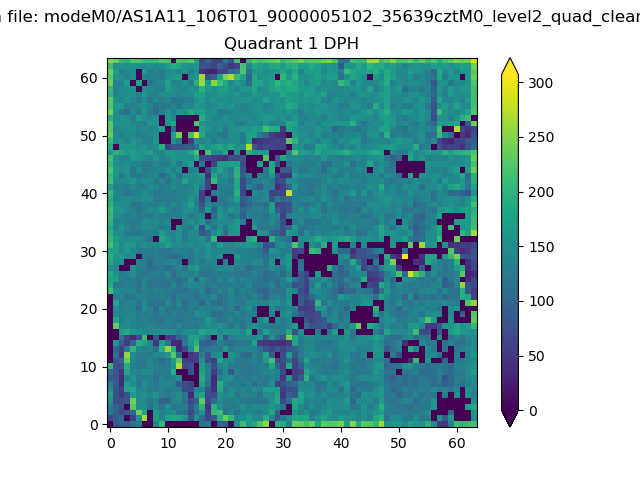 |
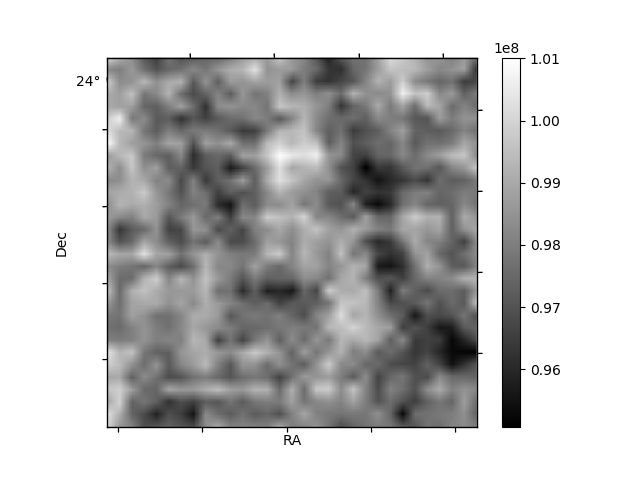
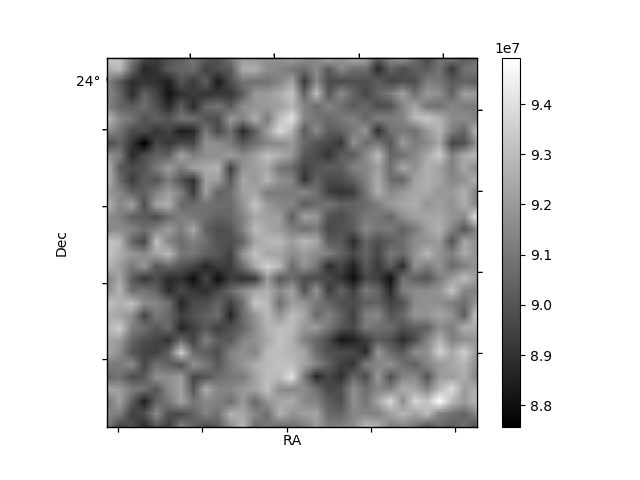
Quadrant B |
|---|---|---|---|
| Quadrant D | 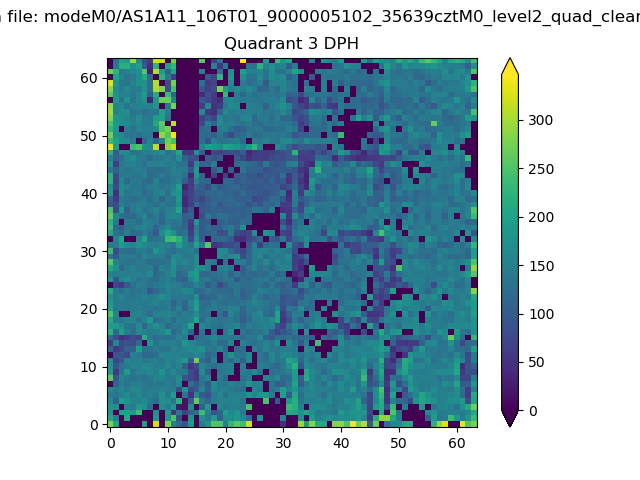 |
 |
Quadrant C |
| Plot type | Count rate plots | Images |
|---|---|---|
| Comparison with Poisson distribution Blue bars denote a histogram of data divided into 1 sec bins. Red curve is a Poisson curve with rate = median count rate of data. |
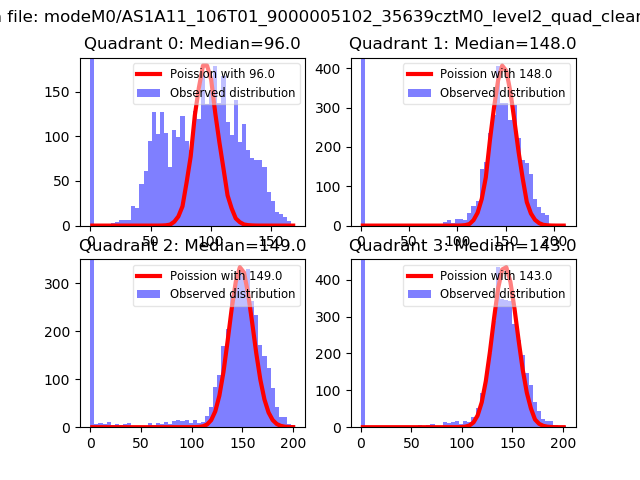 |
 |
| Quadrant-wise count rates Data is divided into 100 sec bins |
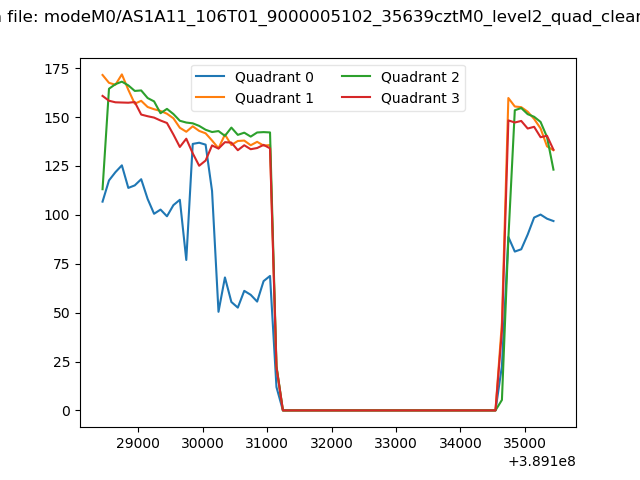 |
|
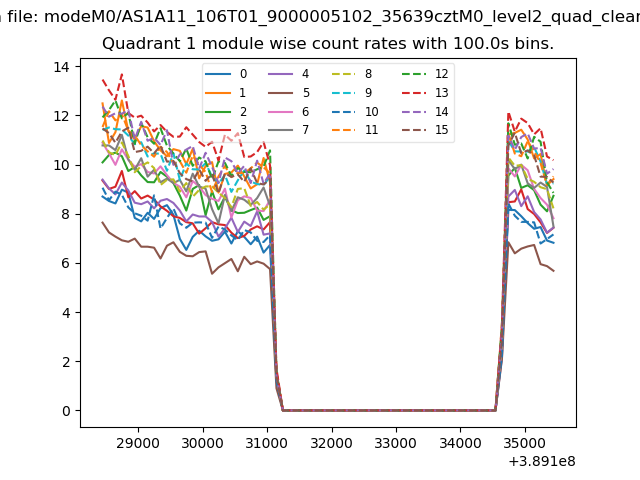
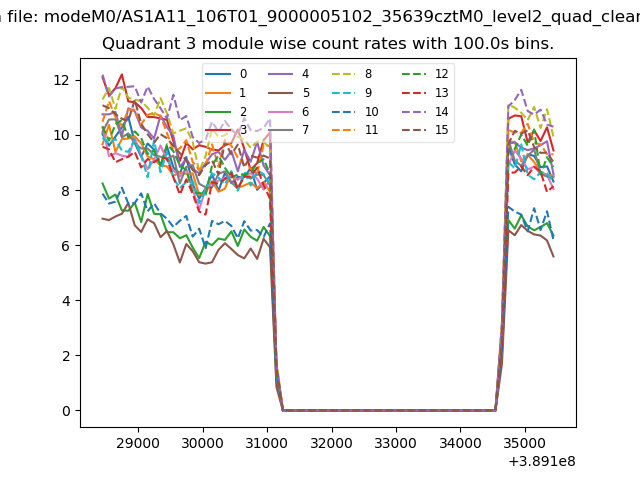
| Module-wise count rates for Quadrant A Data is divided into 100 sec bins |
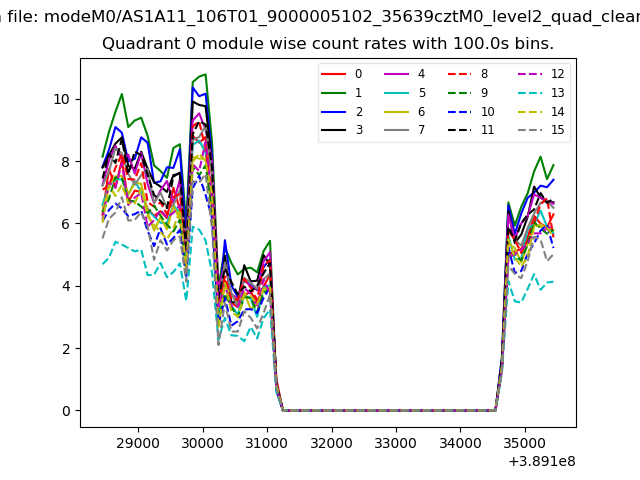 |
 |
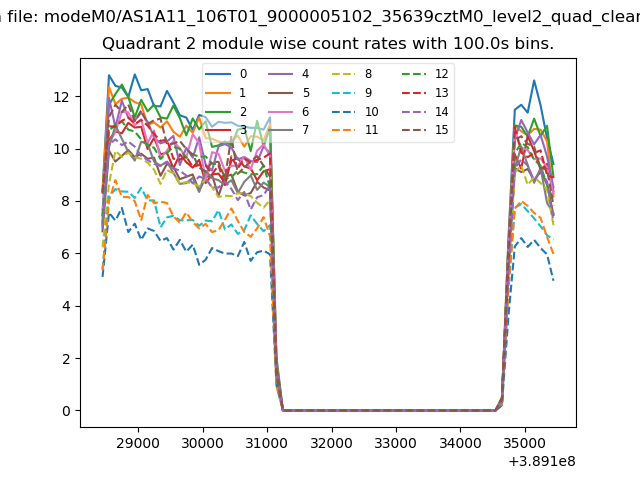
| Module-wise count rates for Quadrant B Data is divided into 100 sec bins |
 |
 |
| Module-wise count rates for Quadrant C Data is divided into 100 sec bins |
 |
 |
| Module-wise count rates for Quadrant D Data is divided into 100 sec bins |
 |
 |
| Parameter | Plot |
|---|---|
| CZT HV Monitor | 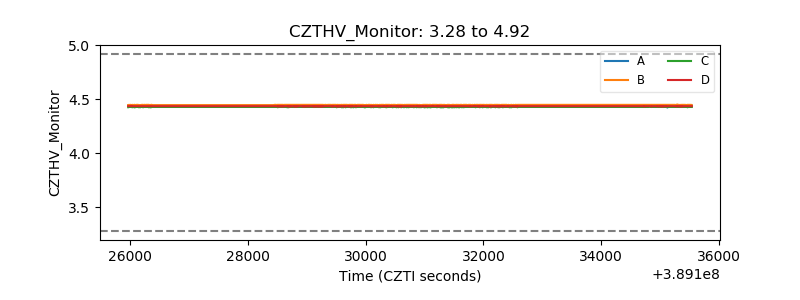 |
| D_VDD | 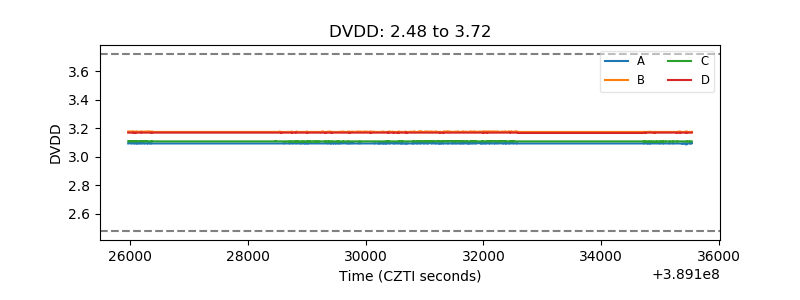 |
| Temperature 1 | 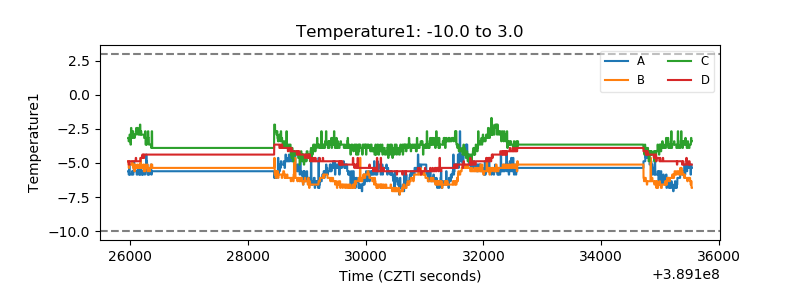 |
| Veto HV Monitor | 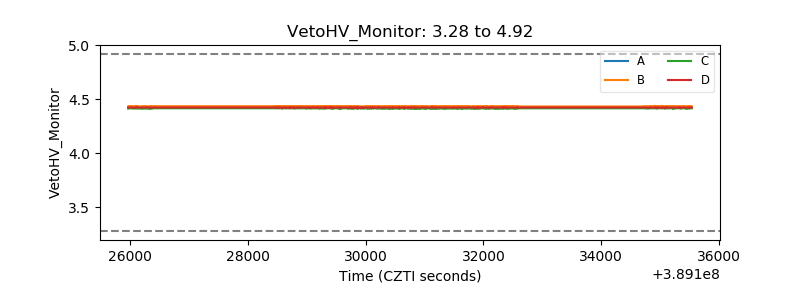 |
| Veto LLD | 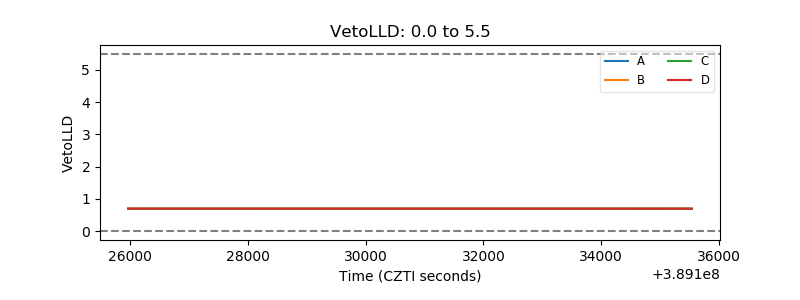 |
| Alpha Counter | 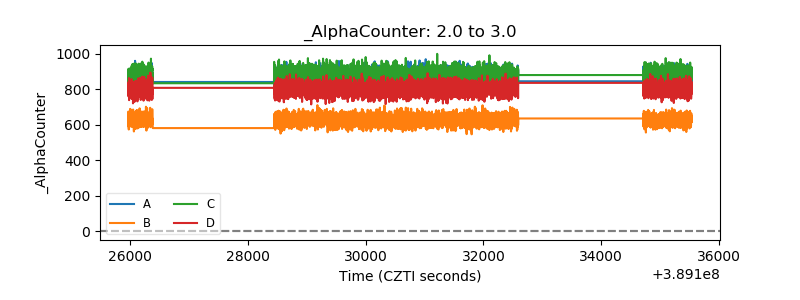 |
| _CPM_Rate | 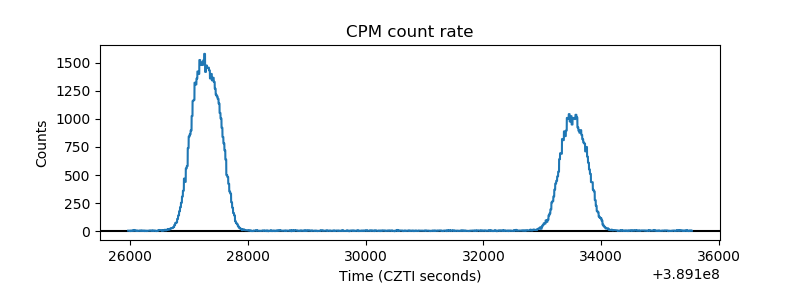 |
| CZT Counter | 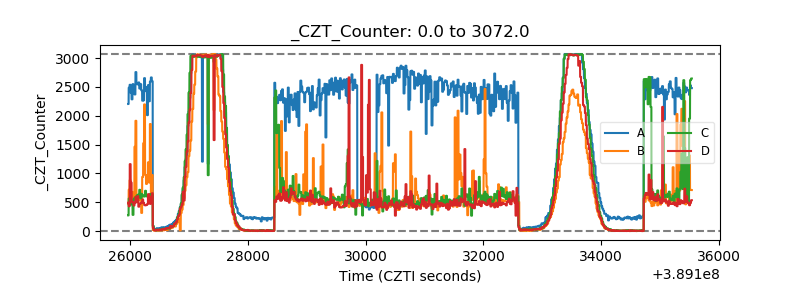 |
| +2.5 Volts monitor | 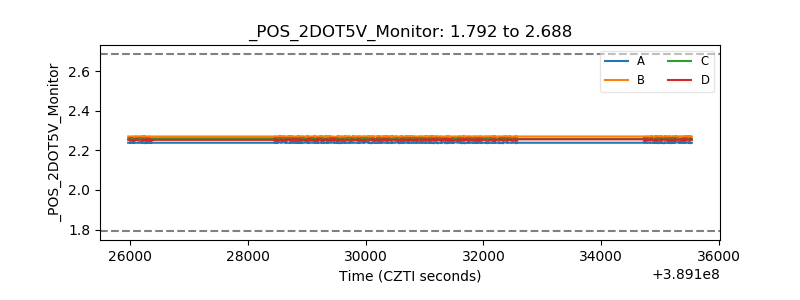 |
| +5 Volts monitor | 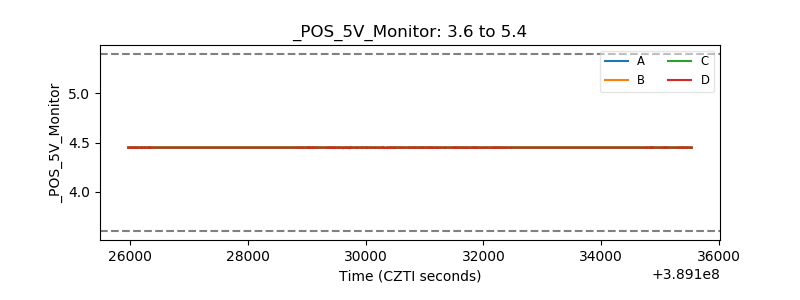 |
| _ROLL_ROT | 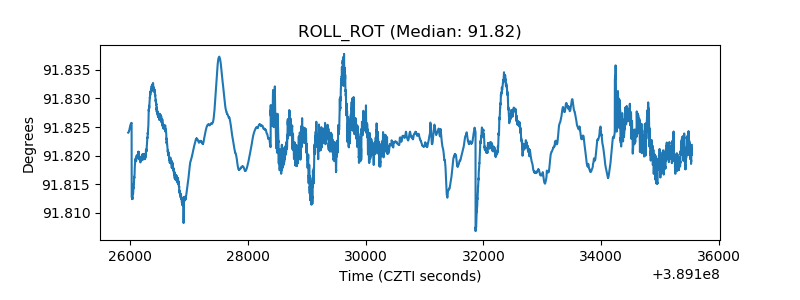 |
| _Roll_DEC |  |
| _Roll_RA | 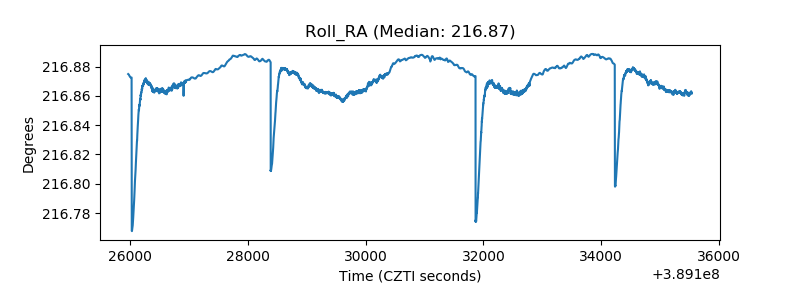 |
| Veto Counter | 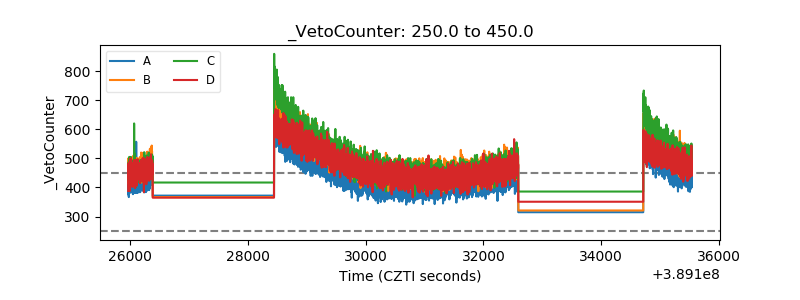 |