| Param | Original file | Final file |
|---|---|---|
| Filename | modeM0/AS1A11_106T01_9000005102_35638cztM0_level2.evt | modeM0/AS1A11_106T01_9000005102_35638cztM0_level2_quad_clean.evt |
| Size (bytes) | 739,512,000 | 79,436,160 |
| Size | 705.3 MB | 75.8 MB |
| Events in quadrant A | 12,477,959 | 299,788 |
| Events in quadrant B | 3,270,662 | 593,406 |
| Events in quadrant C | 3,418,957 | 591,844 |
| Events in quadrant D | 2,892,845 | 570,745 |
| Mode SS | |||
|---|---|---|---|
| Quadrant | BADHDUFLAG | Total packets | Discarded packets |
| A | 0 | 100 | 0 |
| B | 0 | 100 | 0 |
| C | 0 | 100 | 0 |
| D | 0 | 100 | 0 |
| Mode M0 | |||
|---|---|---|---|
| Quadrant | BADHDUFLAG | Total packets | Discarded packets |
| A | 0 | 40494 | 3 |
| B | 0 | 12785 | 2 |
| C | 0 | 13420 | 2 |
| D | 0 | 11693 | 2 |
| Mode M9 | |||
|---|---|---|---|
| Quadrant | BADHDUFLAG | Total packets | Discarded packets |
| A | 0 | 24 | 0 |
| B | 0 | 24 | 0 |
| C | 0 | 24 | 0 |
| D | 0 | 25 | 0 |
| Quadrant | Total seconds | Saturated seconds | Saturation percentage |
|---|---|---|---|
| A | 4964 | 4935 | 99.415794% |
| B | 4964 | 189 | 3.807413% |
| C | 4964 | 143 | 2.880741% |
| D | 4964 | 31 | 0.624496% |
Noise dominated data is calculated using 1-second bins in cleaned event files. If a bin has >2000 counts, and if more than 50% of those come from <1% of pixels, then it is considered to be noise-dominated and hence unusable.
| Quadrant | # 1 sec bins | Bins with >0 counts | Bins with >2000 counts | High rate bins dominated by noise | Noise dominated (total time) | Noise dominated (detector-on time) | Marked lightcurve |
|---|---|---|---|---|---|---|---|
| A | 7026 | 4965 | 4829 | 4829 | 68.73% | 97.26% | 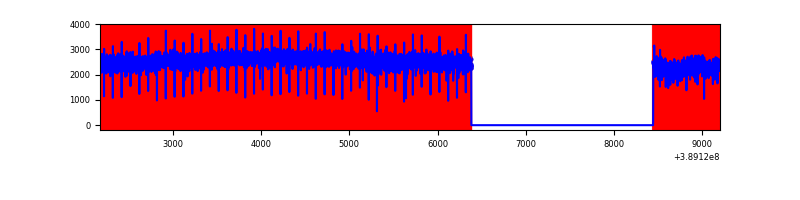 |
| B | 7026 | 4966 | 137 | 137 | 1.95% | 2.76% | 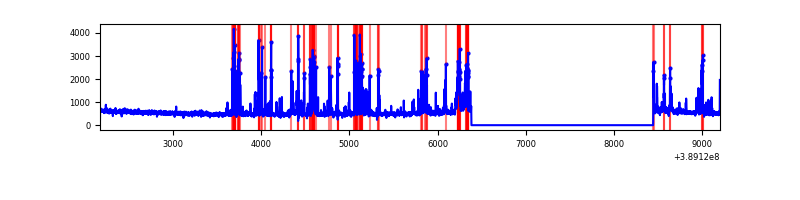 |
| C | 7026 | 4966 | 121 | 121 | 1.72% | 2.44% | 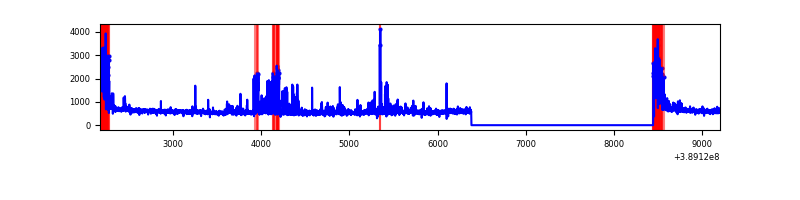 |
| D | 7026 | 4966 | 32 | 32 | 0.46% | 0.64% | 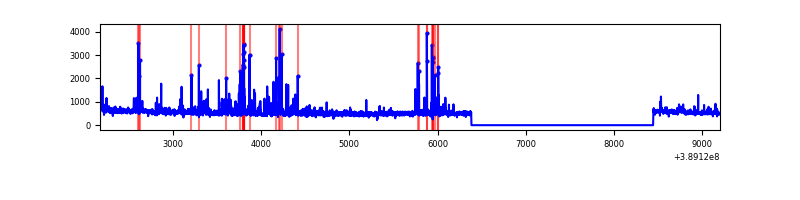 |
Top three noisy pixels from each quadrant. If the there are fewer than three noisy pixels in the level2.evt file, extra rows are filled as -1
| Pixel properties | Quadrant properties | ||||||
|---|---|---|---|---|---|---|---|
| Quadrant | DetID | PixID | Counts | Sigma | Mean | Median | Sigma |
| A | 15 | 169 | 10935587 | 147524.7 | 373 | 367 | 74.1 |
| A | 10 | 83 | 84053 | 1128.99 | 373 | 367 | 74.1 |
| A | 13 | 6 | 12969 | 170.01 | 373 | 367 | 74.1 |
| B | 5 | 172 | 817738 | 6942.45 | 617 | 602 | 117.7 |
| B | 0 | 189 | 22110 | 182.73 | 617 | 602 | 117.7 |
| B | 12 | 111 | 13928 | 113.22 | 617 | 602 | 117.7 |
| C | 0 | 10 | 539051 | 3763.84 | 622 | 630 | 143.1 |
| C | 7 | 220 | 232239 | 1619.07 | 622 | 630 | 143.1 |
| C | 15 | 214 | 205988 | 1435.56 | 622 | 630 | 143.1 |
| D | 2 | 153 | 154466 | 1023.76 | 625 | 611 | 150.3 |
| D | 12 | 217 | 118801 | 786.45 | 625 | 611 | 150.3 |
| D | 1 | 52 | 80087 | 528.84 | 625 | 611 | 150.3 |
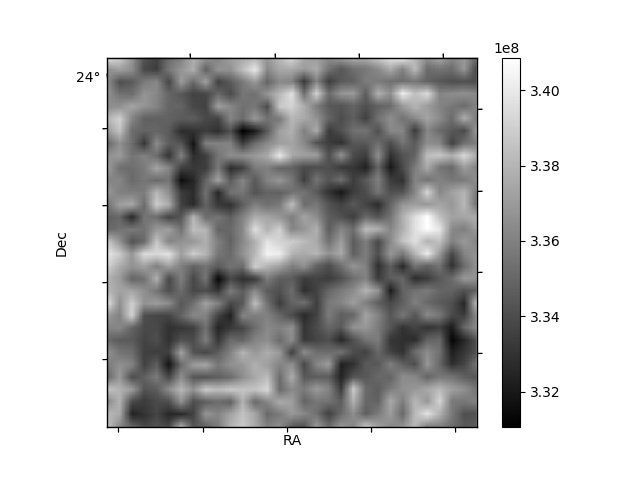
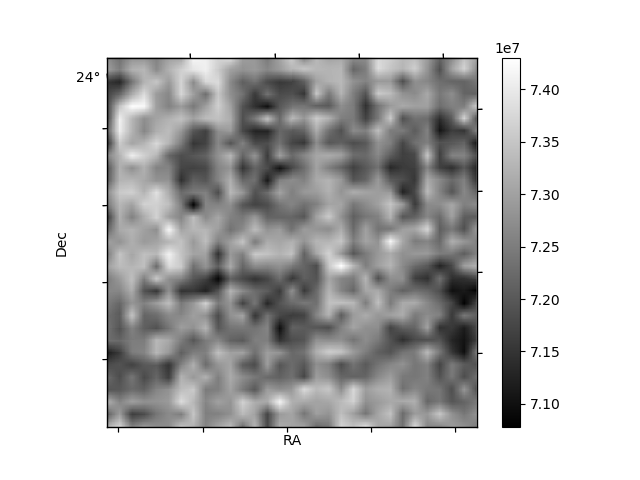
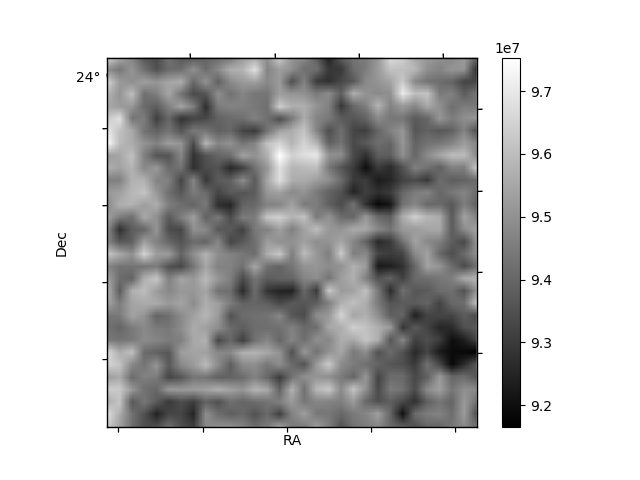
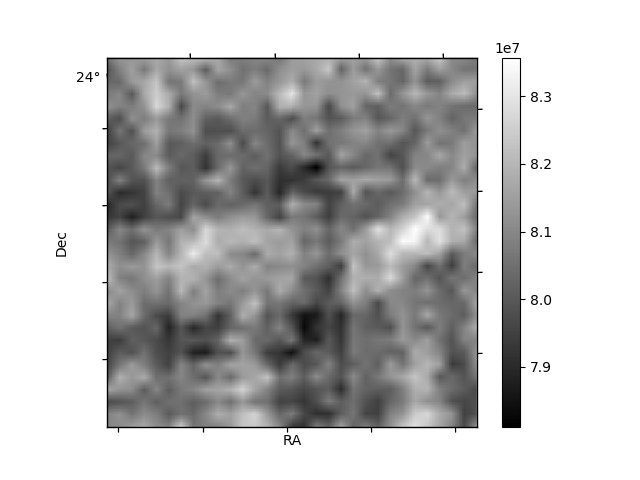
Histogram calculated using DETX and DETY for each event in the final _common_clean file
| Quadrant A | 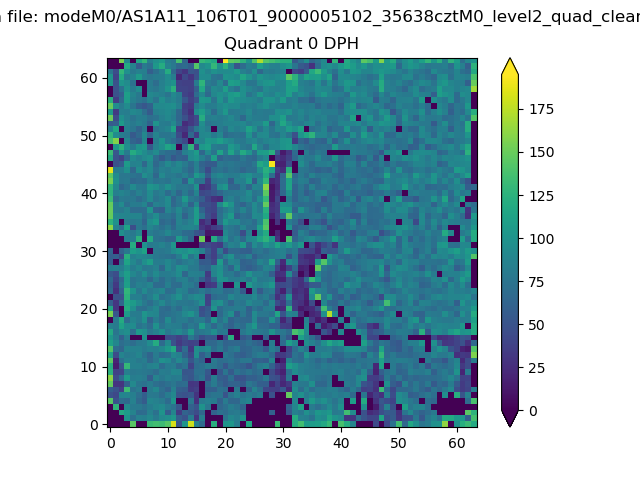 |
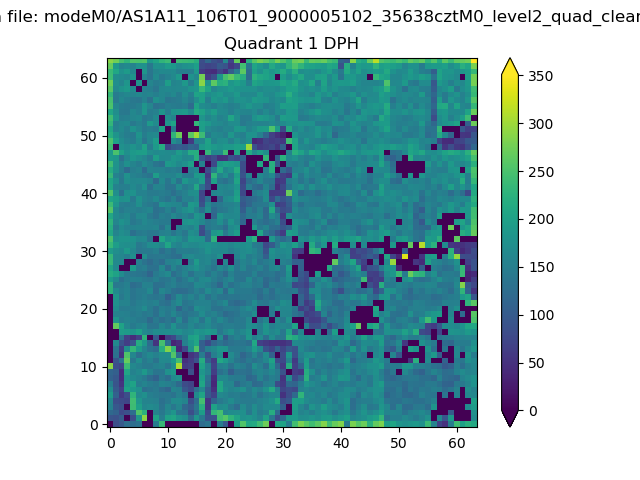 |
Quadrant B |
|---|---|---|---|
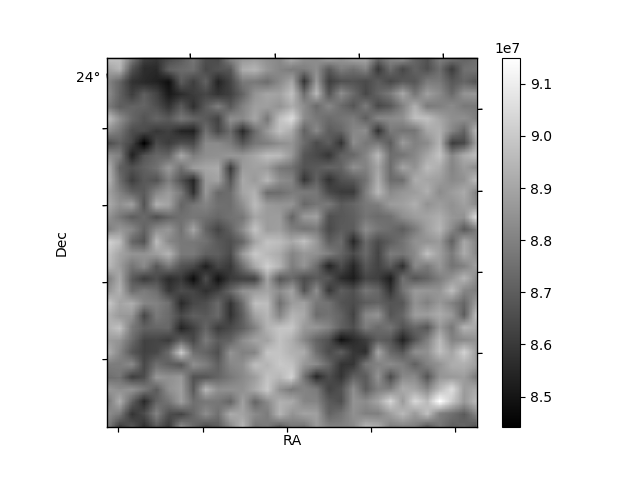
| Quadrant D | 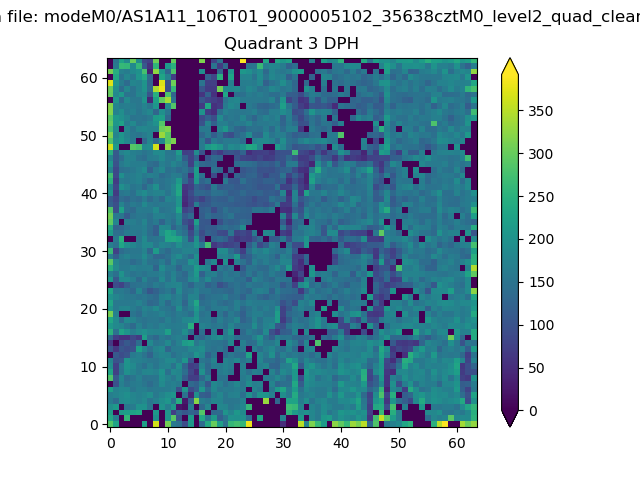 |
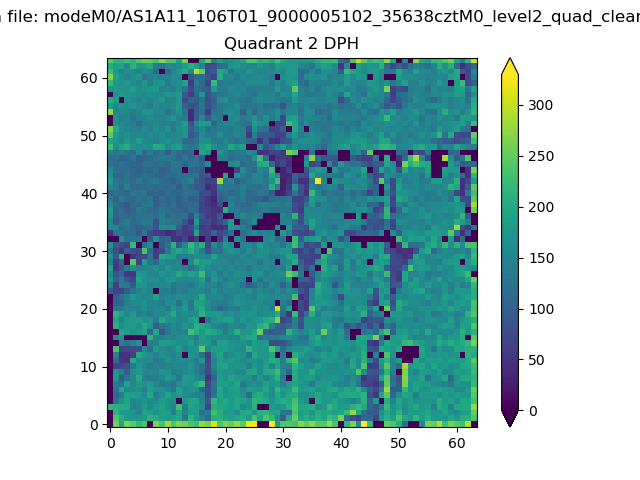 |
Quadrant C |
| Plot type | Count rate plots | Images |
|---|---|---|
| Comparison with Poisson distribution Blue bars denote a histogram of data divided into 1 sec bins. Red curve is a Poisson curve with rate = median count rate of data. |
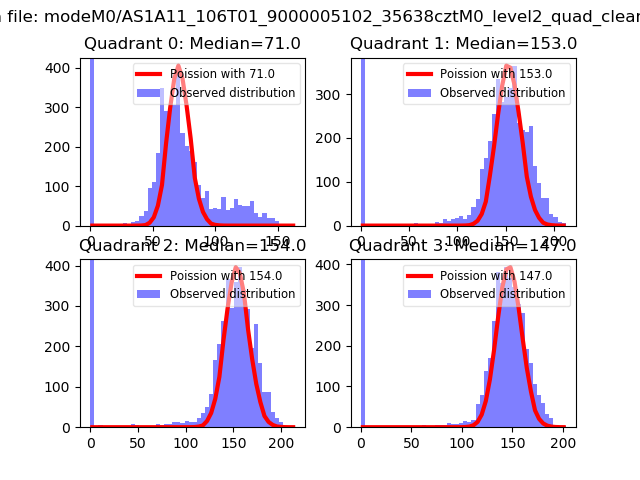 |
 |
| Quadrant-wise count rates Data is divided into 100 sec bins |
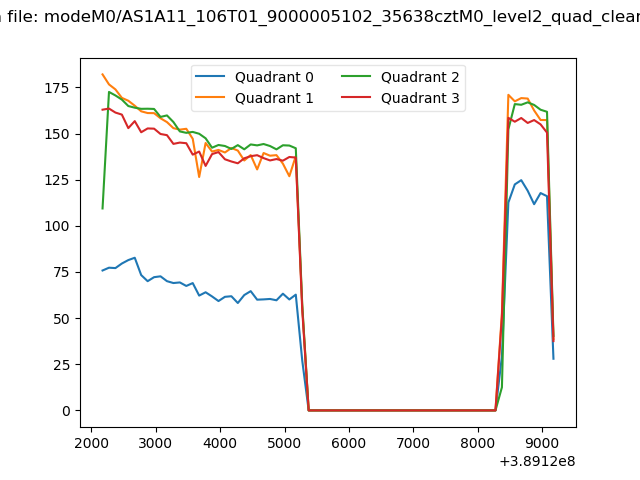 |
|
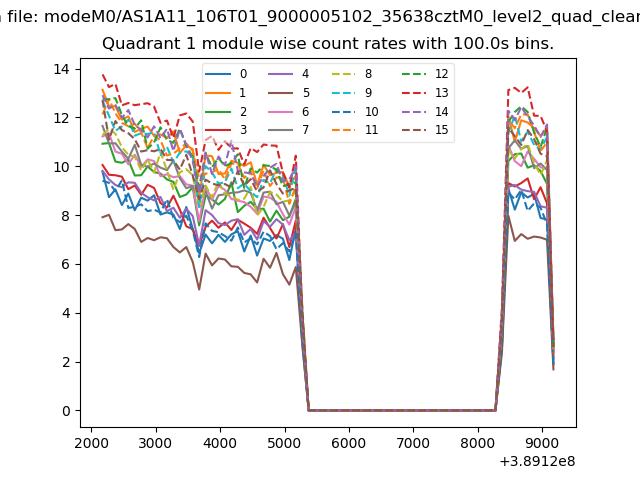
| Module-wise count rates for Quadrant A Data is divided into 100 sec bins |
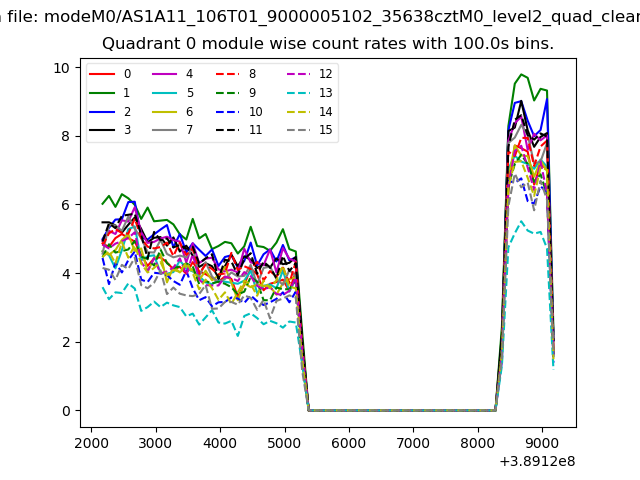 |
 |
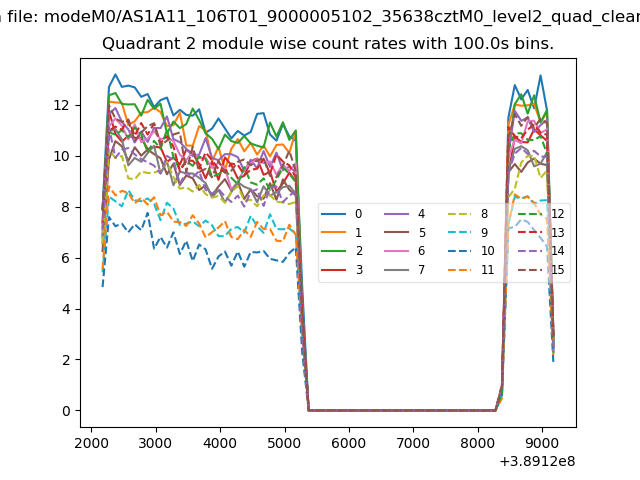
| Module-wise count rates for Quadrant B Data is divided into 100 sec bins |
 |
 |
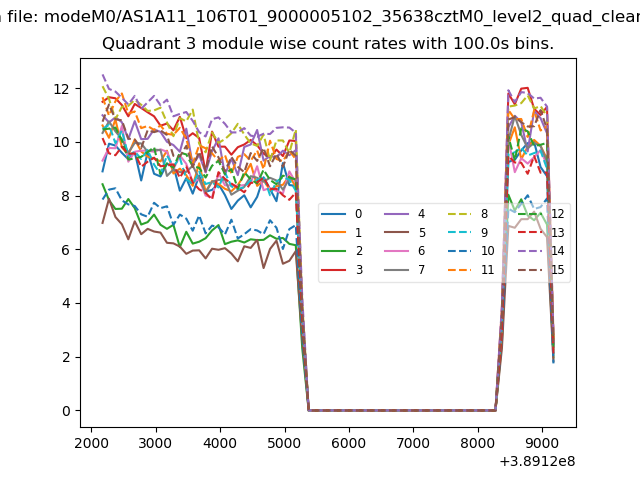
| Module-wise count rates for Quadrant C Data is divided into 100 sec bins |
 |
 |
| Module-wise count rates for Quadrant D Data is divided into 100 sec bins |
 |
 |
| Parameter | Plot |
|---|---|
| CZT HV Monitor |  |
| D_VDD | 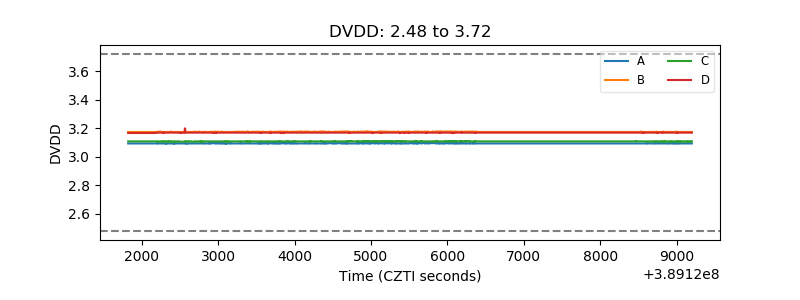 |
| Temperature 1 | 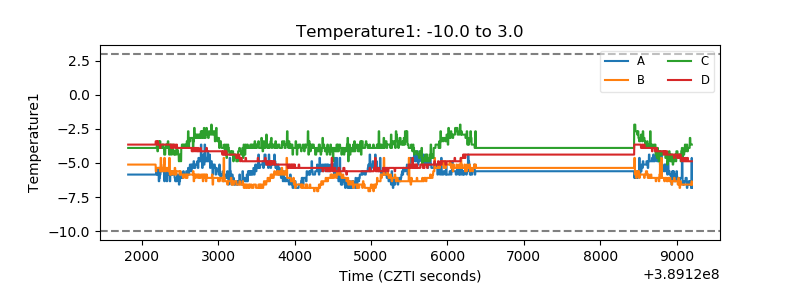 |
| Veto HV Monitor | 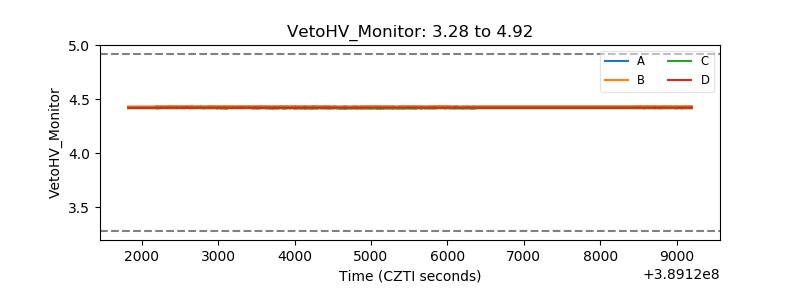 |
| Veto LLD | 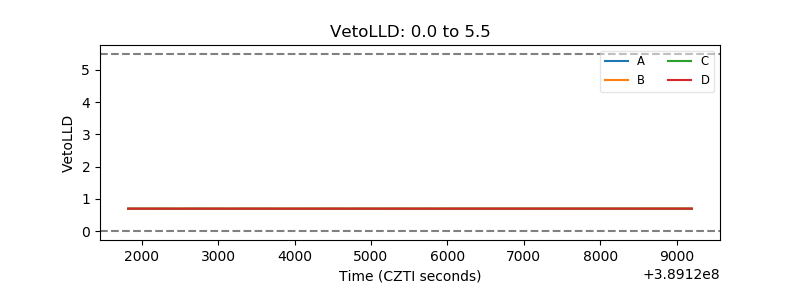 |
| Alpha Counter | 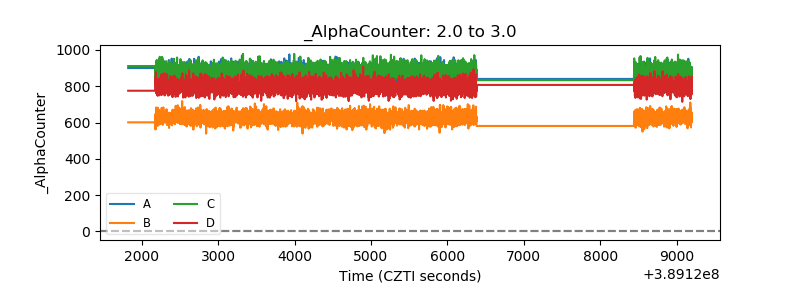 |
| _CPM_Rate | 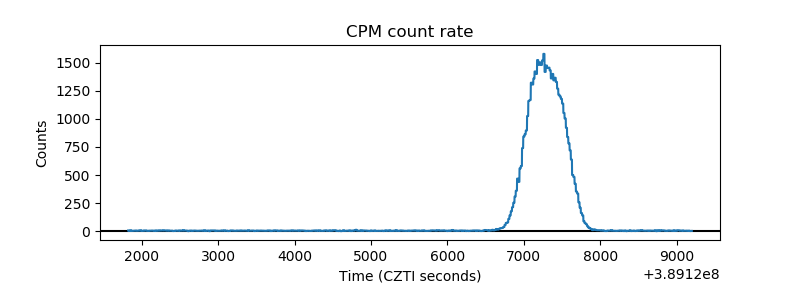 |
| CZT Counter | 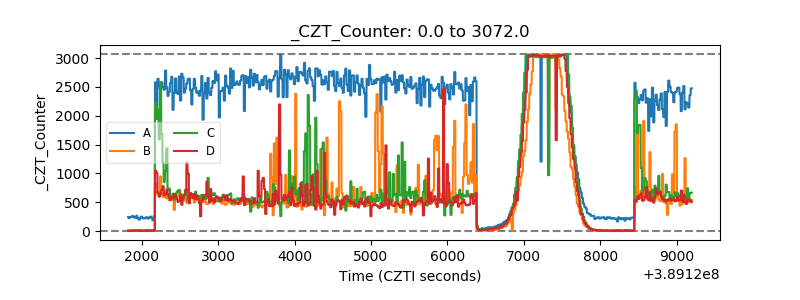 |
| +2.5 Volts monitor | 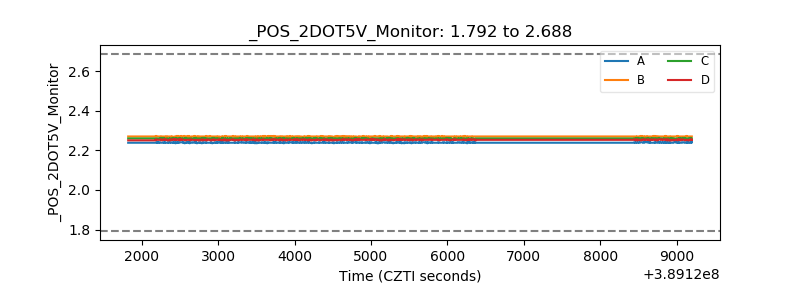 |
| +5 Volts monitor | 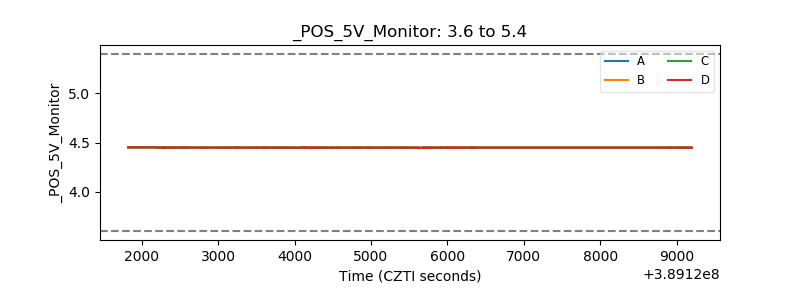 |
| _ROLL_ROT | 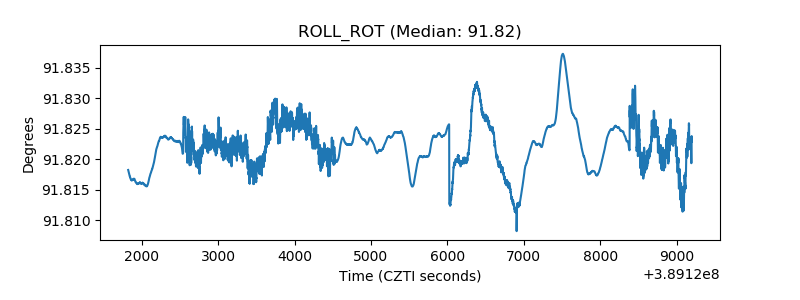 |
| _Roll_DEC | 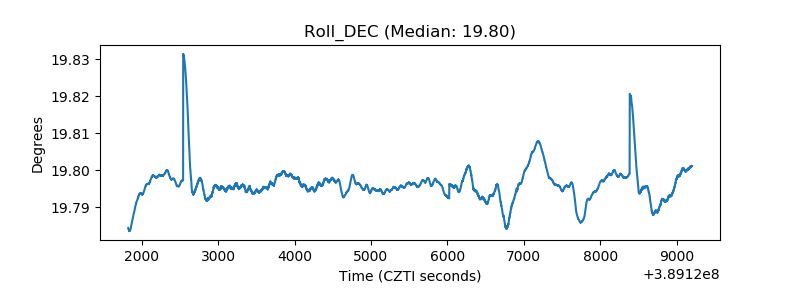 |
| _Roll_RA | 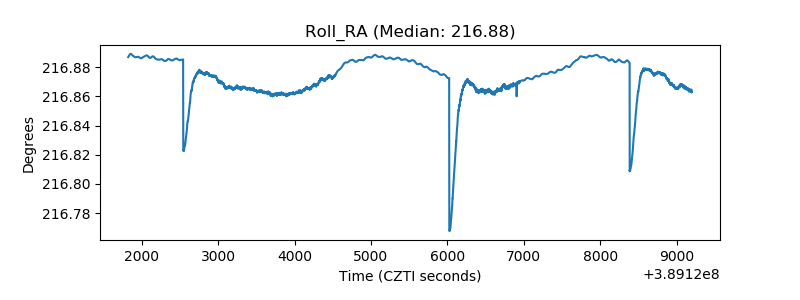 |
| Veto Counter | 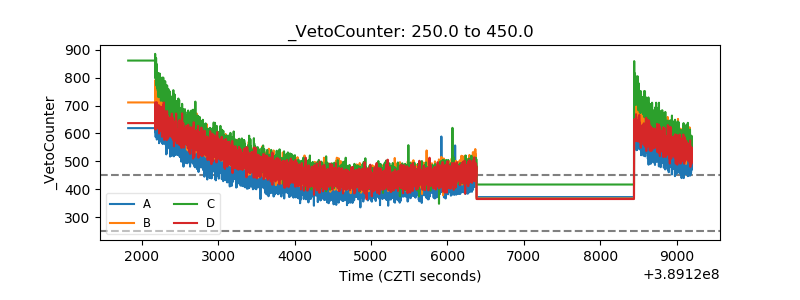 |