| Param | Original file | Final file |
|---|---|---|
| Filename | modeM0/AS1A11_106T01_9000005102_35637cztM0_level2.evt | modeM0/AS1A11_106T01_9000005102_35637cztM0_level2_quad_clean.evt |
| Size (bytes) | 754,896,960 | 83,871,360 |
| Size | 719.9 MB | 80.0 MB |
| Events in quadrant A | 13,041,348 | 257,910 |
| Events in quadrant B | 3,150,009 | 651,887 |
| Events in quadrant C | 3,260,734 | 646,501 |
| Events in quadrant D | 3,064,585 | 623,728 |
| Mode SS | |||
|---|---|---|---|
| Quadrant | BADHDUFLAG | Total packets | Discarded packets |
| A | 0 | 104 | 0 |
| B | 0 | 104 | 0 |
| C | 0 | 104 | 0 |
| D | 0 | 104 | 0 |
| Mode M0 | |||
|---|---|---|---|
| Quadrant | BADHDUFLAG | Total packets | Discarded packets |
| A | 0 | 42290 | 3 |
| B | 0 | 12452 | 2 |
| C | 0 | 12914 | 2 |
| D | 0 | 12414 | 2 |
| Mode M9 | |||
|---|---|---|---|
| Quadrant | BADHDUFLAG | Total packets | Discarded packets |
| A | 0 | 30 | 0 |
| B | 0 | 30 | 0 |
| C | 0 | 30 | 0 |
| D | 0 | 31 | 0 |
| Quadrant | Total seconds | Saturated seconds | Saturation percentage |
|---|---|---|---|
| A | 5104 | 5104 | 100.000000% |
| B | 5104 | 115 | 2.253135% |
| C | 5104 | 157 | 3.076019% |
| D | 5104 | 36 | 0.705329% |
Noise dominated data is calculated using 1-second bins in cleaned event files. If a bin has >2000 counts, and if more than 50% of those come from <1% of pixels, then it is considered to be noise-dominated and hence unusable.
| Quadrant | # 1 sec bins | Bins with >0 counts | Bins with >2000 counts | High rate bins dominated by noise | Noise dominated (total time) | Noise dominated (detector-on time) | Marked lightcurve |
|---|---|---|---|---|---|---|---|
| A | 7077 | 5105 | 5006 | 5006 | 70.74% | 98.06% | 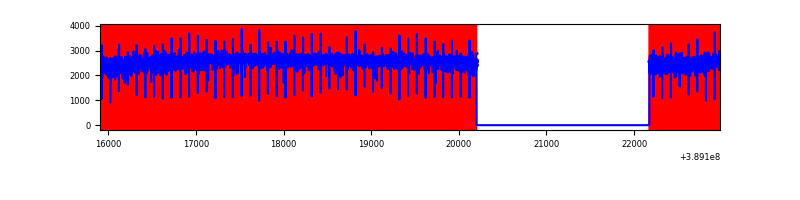 |
| B | 7077 | 5105 | 102 | 102 | 1.44% | 2.00% | 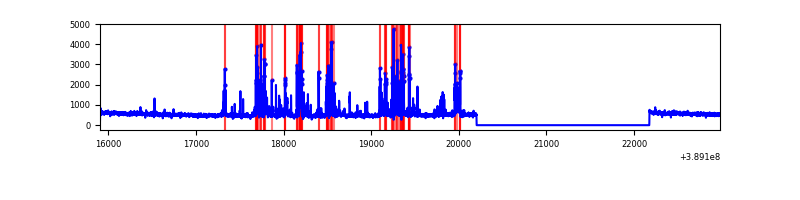 |
| C | 7077 | 5105 | 116 | 116 | 1.64% | 2.27% | 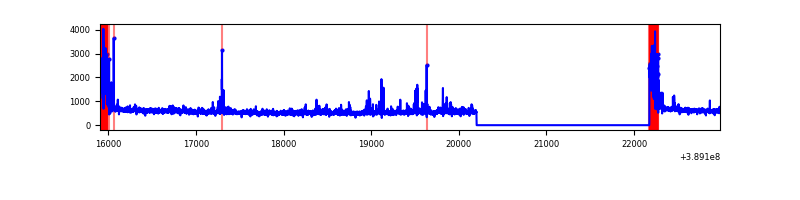 |
| D | 7077 | 5105 | 42 | 42 | 0.59% | 0.82% | 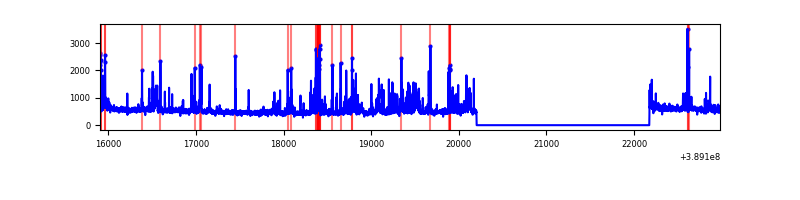 |
Top three noisy pixels from each quadrant. If the there are fewer than three noisy pixels in the level2.evt file, extra rows are filled as -1
| Pixel properties | Quadrant properties | ||||||
|---|---|---|---|---|---|---|---|
| Quadrant | DetID | PixID | Counts | Sigma | Mean | Median | Sigma |
| A | 15 | 169 | 11730146 | 183263.76 | 318 | 313 | 64.0 |
| A | 10 | 83 | 72015 | 1120.25 | 318 | 313 | 64.0 |
| A | 13 | 6 | 5112 | 74.98 | 318 | 313 | 64.0 |
| B | 5 | 172 | 601439 | 4979.77 | 636 | 619 | 120.7 |
| B | 0 | 189 | 42763 | 349.3 | 636 | 619 | 120.7 |
| B | 12 | 111 | 14660 | 116.38 | 636 | 619 | 120.7 |
| C | 0 | 10 | 562258 | 3844.94 | 635 | 641 | 146.1 |
| C | 15 | 214 | 212931 | 1453.38 | 635 | 641 | 146.1 |
| C | 13 | 61 | 4154 | 24.05 | 635 | 641 | 146.1 |
| D | 12 | 217 | 338529 | 2183.8 | 641 | 626 | 154.7 |
| D | 2 | 153 | 135036 | 868.67 | 641 | 626 | 154.7 |
| D | 2 | 249 | 42549 | 270.94 | 641 | 626 | 154.7 |
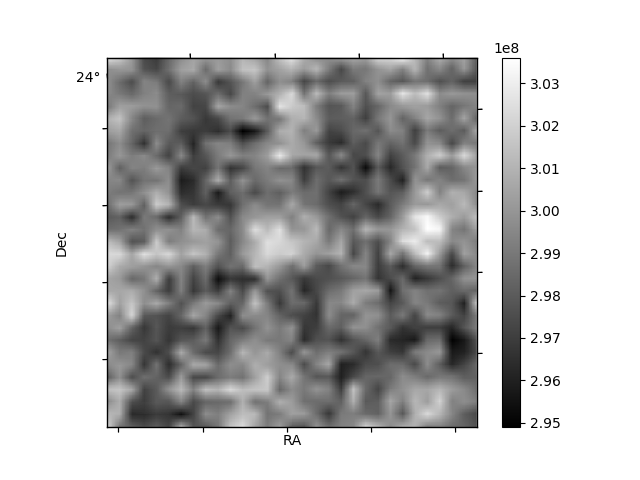
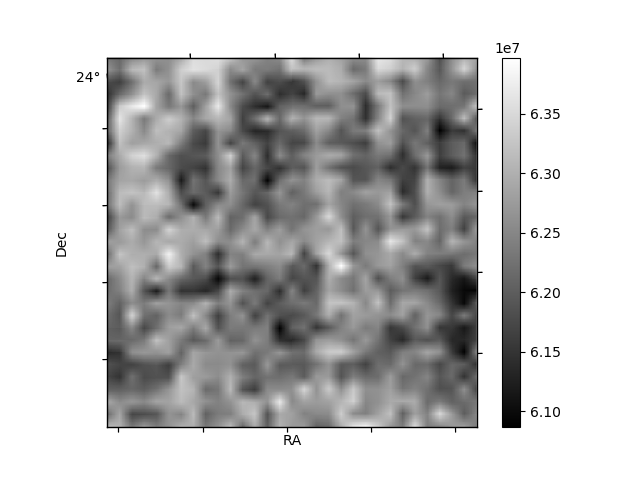
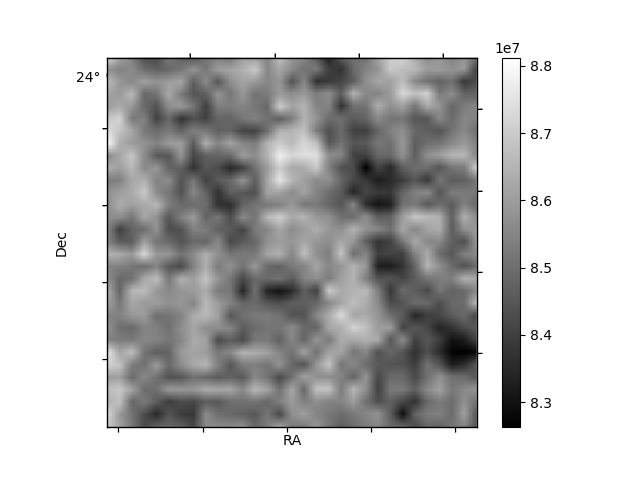
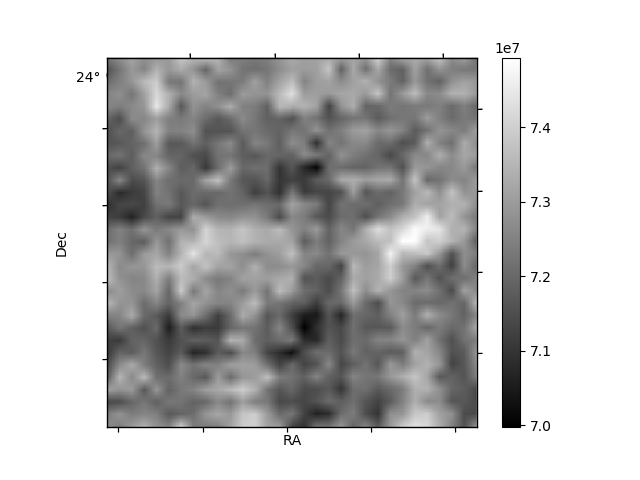
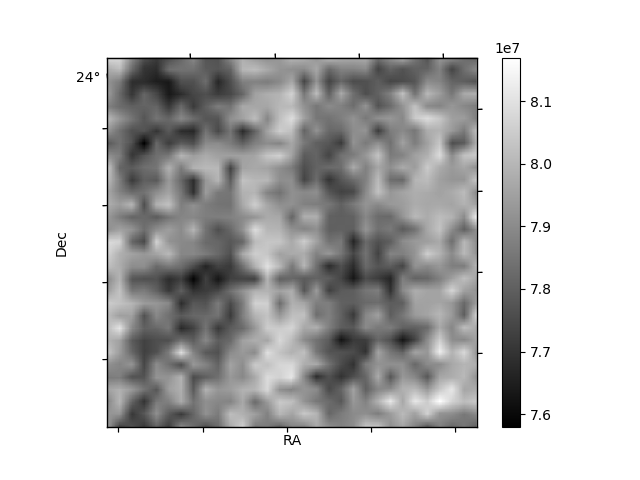
Histogram calculated using DETX and DETY for each event in the final _common_clean file
| Quadrant A | 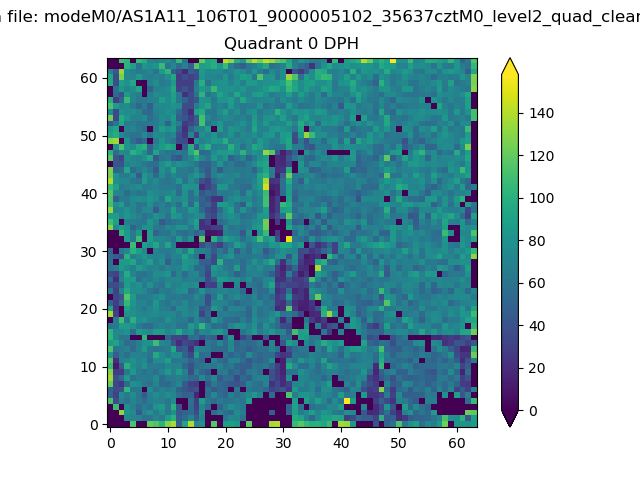 |
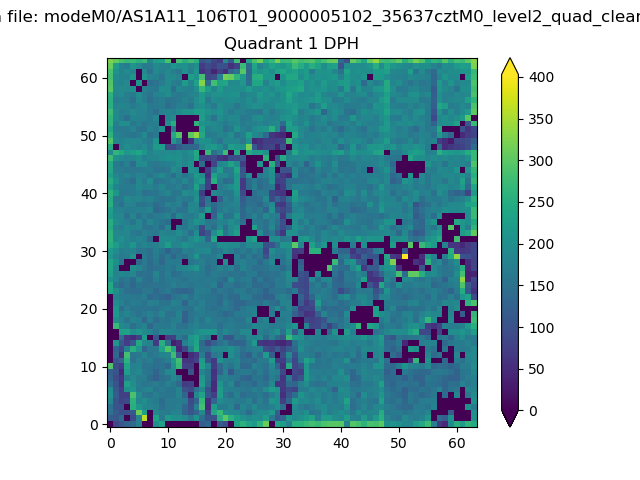 |
Quadrant B |
|---|---|---|---|
| Quadrant D | 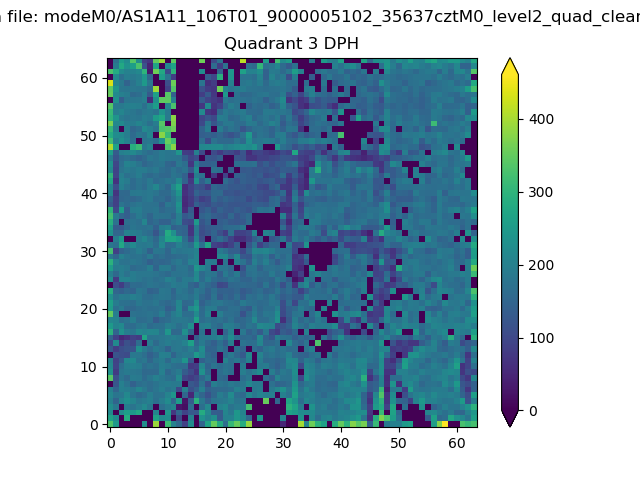 |
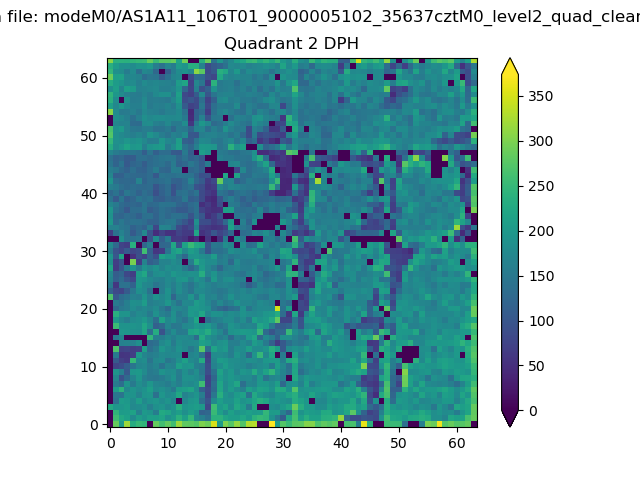 |
Quadrant C |
| Plot type | Count rate plots | Images |
|---|---|---|
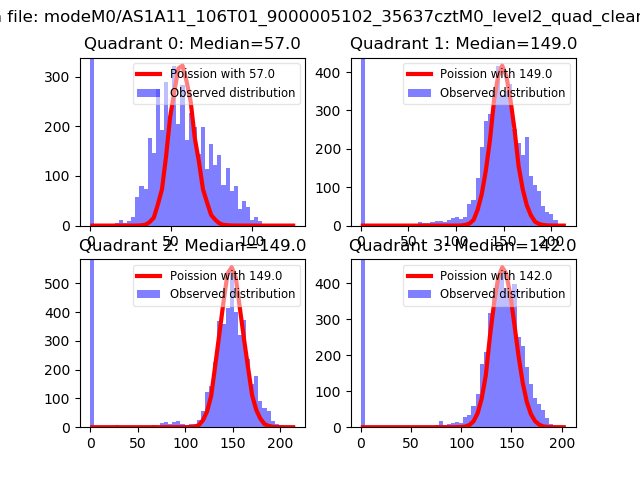
| Comparison with Poisson distribution Blue bars denote a histogram of data divided into 1 sec bins. Red curve is a Poisson curve with rate = median count rate of data. |
 |
 |
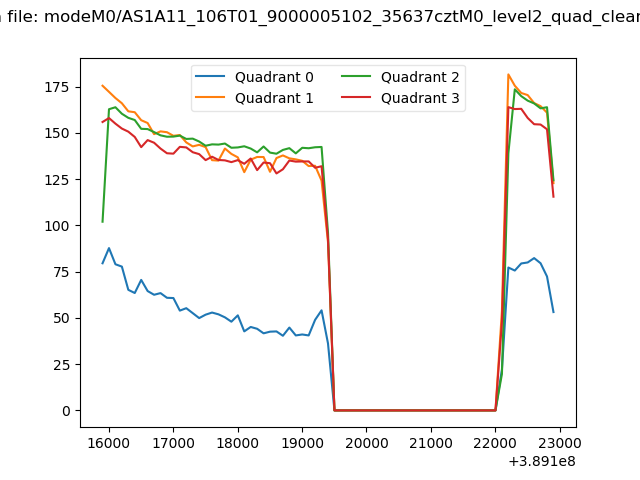
| Quadrant-wise count rates Data is divided into 100 sec bins |
 |
|
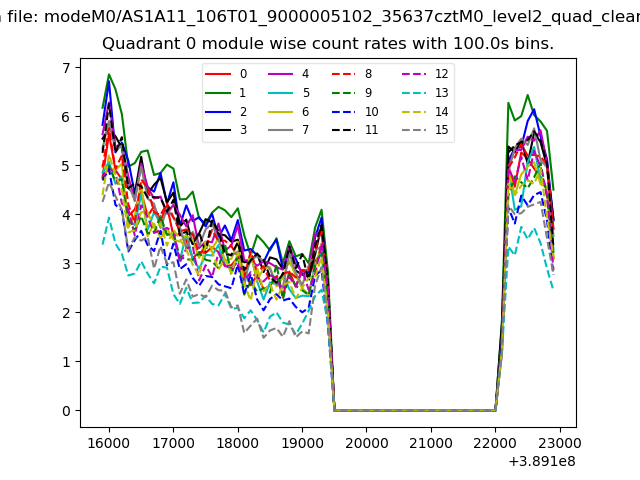
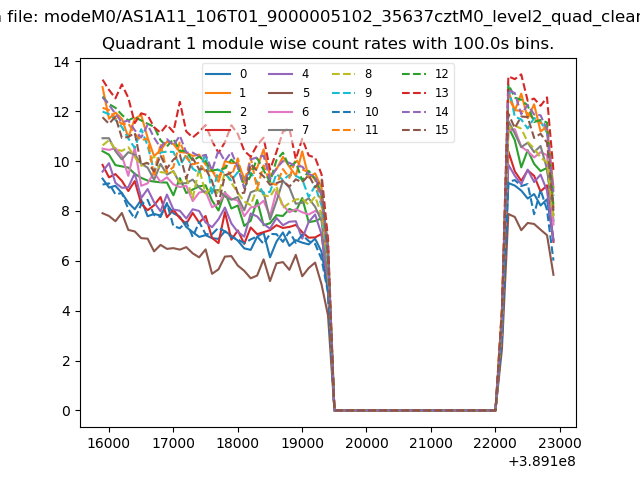
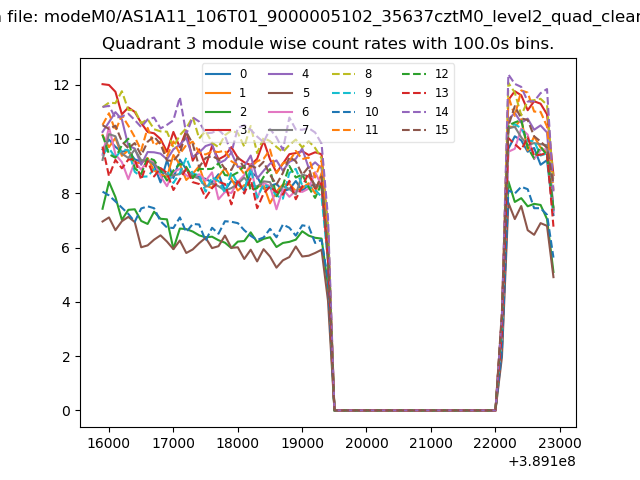
| Module-wise count rates for Quadrant A Data is divided into 100 sec bins |
 |
 |
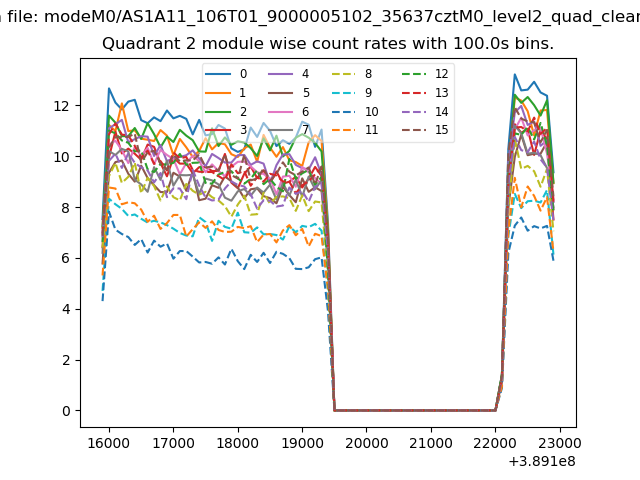
| Module-wise count rates for Quadrant B Data is divided into 100 sec bins |
 |
 |
| Module-wise count rates for Quadrant C Data is divided into 100 sec bins |
 |
 |
| Module-wise count rates for Quadrant D Data is divided into 100 sec bins |
 |
 |
| Parameter | Plot |
|---|---|
| CZT HV Monitor | 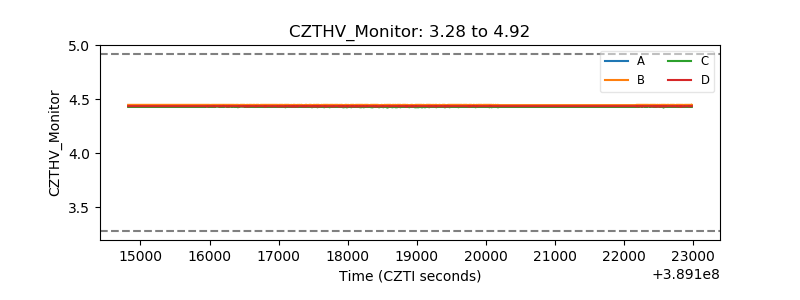 |
| D_VDD | 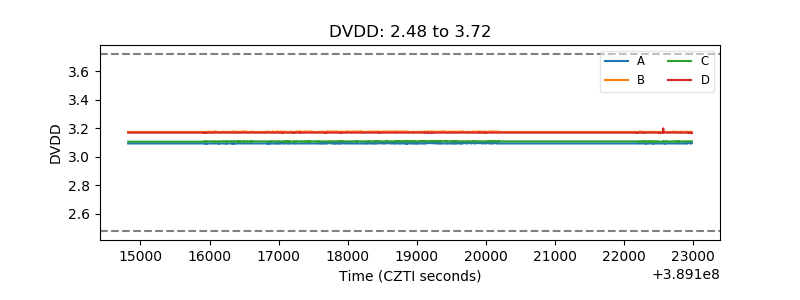 |
| Temperature 1 | 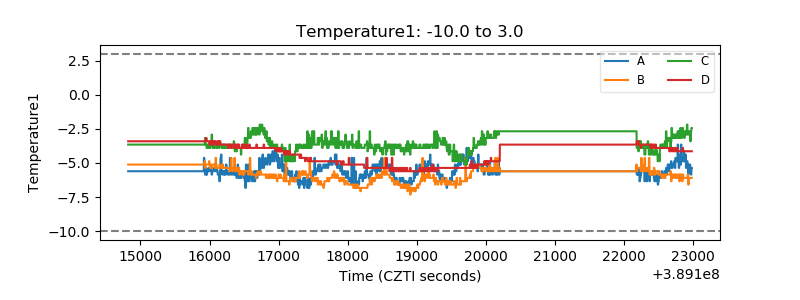 |
| Veto HV Monitor | 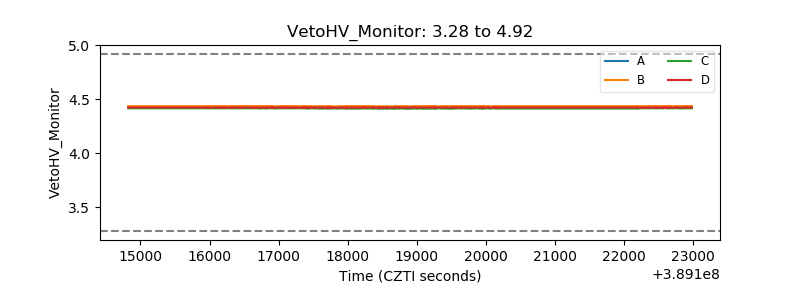 |
| Veto LLD | 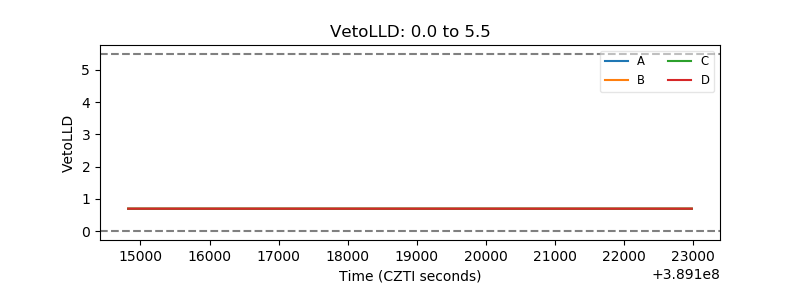 |
| Alpha Counter | 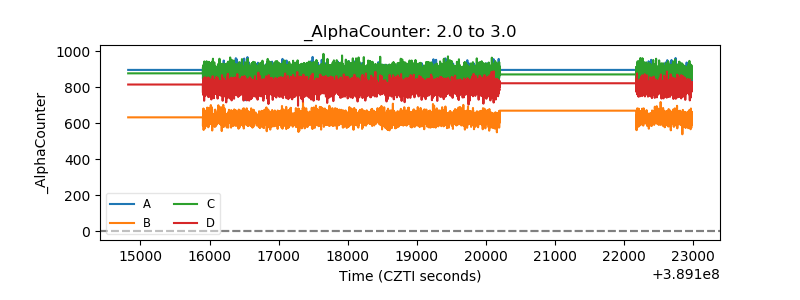 |
| _CPM_Rate | 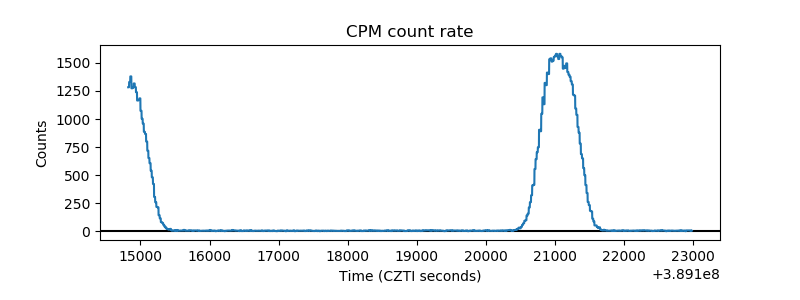 |
| CZT Counter | 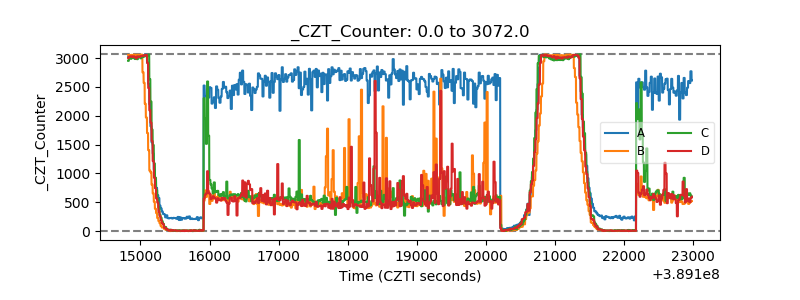 |
| +2.5 Volts monitor | 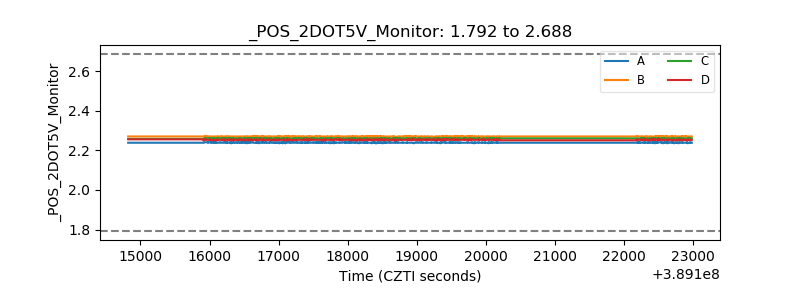 |
| +5 Volts monitor | 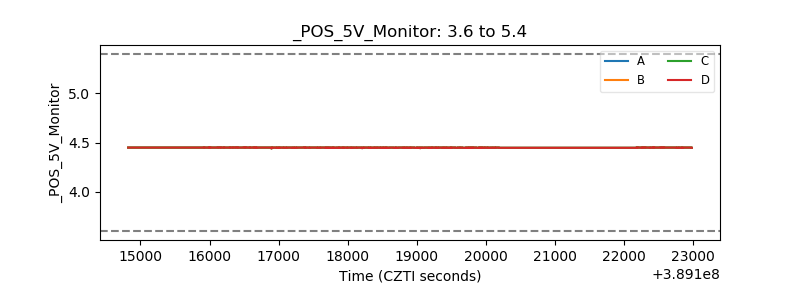 |
| _ROLL_ROT | 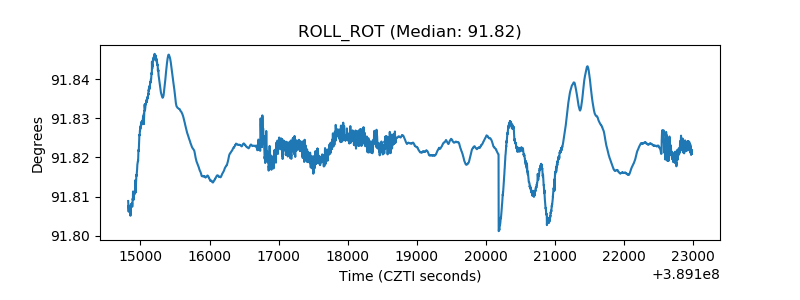 |
| _Roll_DEC | 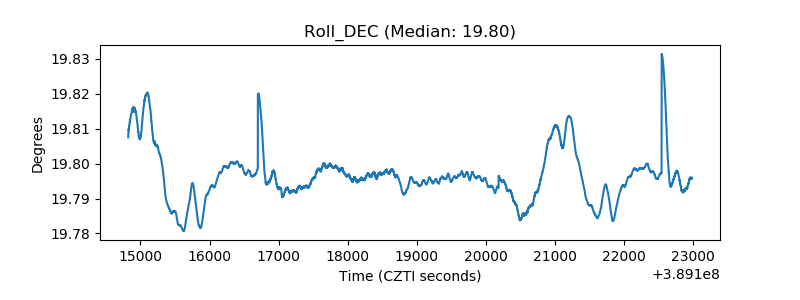 |
| _Roll_RA | 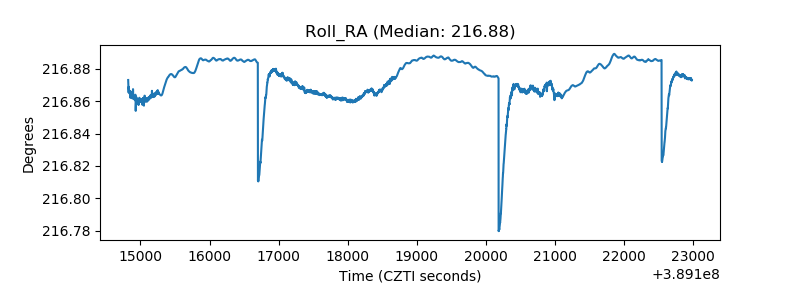 |
| Veto Counter | 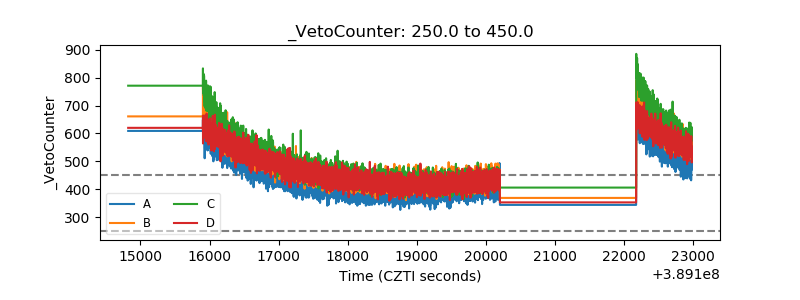 |