| Param | Original file | Final file |
|---|---|---|
| Filename | modeM0/AS1A11_106T01_9000005102_35636cztM0_level2.evt | modeM0/AS1A11_106T01_9000005102_35636cztM0_level2_quad_clean.evt |
| Size (bytes) | 767,666,880 | 84,127,680 |
| Size | 732.1 MB | 80.2 MB |
| Events in quadrant A | 13,522,297 | 318,094 |
| Events in quadrant B | 2,875,706 | 632,522 |
| Events in quadrant C | 3,216,833 | 620,400 |
| Events in quadrant D | 3,264,958 | 593,232 |
| Mode SS | |||
|---|---|---|---|
| Quadrant | BADHDUFLAG | Total packets | Discarded packets |
| A | 0 | 114 | 0 |
| B | 0 | 114 | 0 |
| C | 0 | 114 | 0 |
| D | 0 | 114 | 0 |
| Mode M0 | |||
|---|---|---|---|
| Quadrant | BADHDUFLAG | Total packets | Discarded packets |
| A | 0 | 43811 | 3 |
| B | 0 | 11877 | 2 |
| C | 0 | 12814 | 2 |
| D | 0 | 13172 | 2 |
| Mode M9 | |||
|---|---|---|---|
| Quadrant | BADHDUFLAG | Total packets | Discarded packets |
| A | 0 | 35 | 0 |
| B | 0 | 35 | 0 |
| C | 0 | 35 | 0 |
| D | 0 | 35 | 0 |
| Quadrant | Total seconds | Saturated seconds | Saturation percentage |
|---|---|---|---|
| A | 5445 | 5445 | 100.000000% |
| B | 5445 | 23 | 0.422406% |
| C | 5445 | 147 | 2.699725% |
| D | 5445 | 59 | 1.083563% |
Noise dominated data is calculated using 1-second bins in cleaned event files. If a bin has >2000 counts, and if more than 50% of those come from <1% of pixels, then it is considered to be noise-dominated and hence unusable.
| Quadrant | # 1 sec bins | Bins with >0 counts | Bins with >2000 counts | High rate bins dominated by noise | Noise dominated (total time) | Noise dominated (detector-on time) | Marked lightcurve |
|---|---|---|---|---|---|---|---|
| A | 8997 | 5446 | 5287 | 5287 | 58.76% | 97.08% | 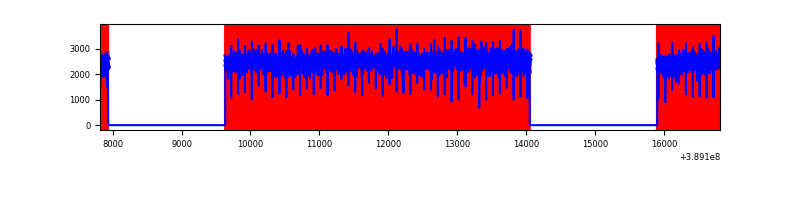 |
| B | 8998 | 5447 | 17 | 17 | 0.19% | 0.31% | 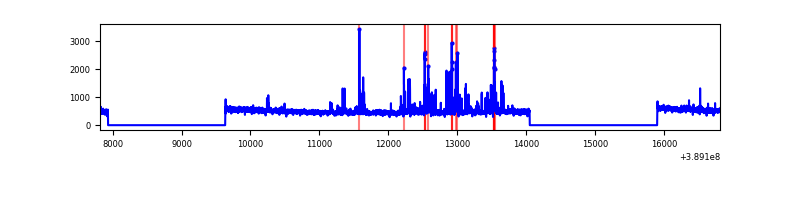 |
| C | 8998 | 5447 | 103 | 103 | 1.14% | 1.89% | 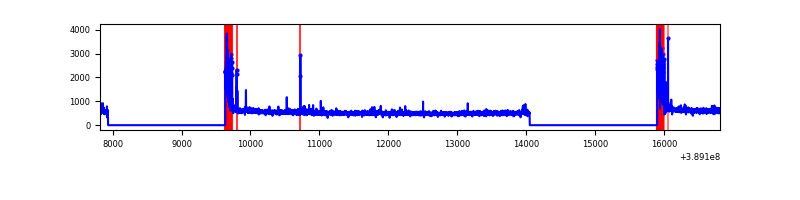 |
| D | 8998 | 5447 | 52 | 52 | 0.58% | 0.95% | 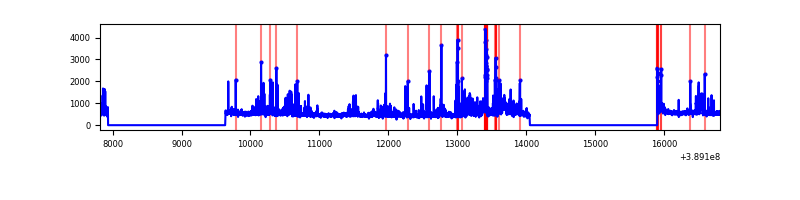 |
Top three noisy pixels from each quadrant. If the there are fewer than three noisy pixels in the level2.evt file, extra rows are filled as -1
| Pixel properties | Quadrant properties | ||||||
|---|---|---|---|---|---|---|---|
| Quadrant | DetID | PixID | Counts | Sigma | Mean | Median | Sigma |
| A | 15 | 169 | 11884497 | 146228.76 | 400 | 393 | 81.3 |
| A | 10 | 83 | 78549 | 961.68 | 400 | 393 | 81.3 |
| A | 13 | 6 | 5803 | 66.57 | 400 | 393 | 81.3 |
| B | 5 | 172 | 235071 | 1823.2 | 667 | 649 | 128.6 |
| B | 12 | 111 | 15884 | 118.49 | 667 | 649 | 128.6 |
| B | 14 | 111 | 14429 | 107.17 | 667 | 649 | 128.6 |
| C | 0 | 10 | 407871 | 2680.79 | 657 | 664 | 151.9 |
| C | 15 | 214 | 227937 | 1496.22 | 657 | 664 | 151.9 |
| C | 15 | 159 | 7073 | 42.19 | 657 | 664 | 151.9 |
| D | 12 | 217 | 440229 | 2810.68 | 660 | 644 | 156.4 |
| D | 2 | 249 | 153504 | 977.38 | 660 | 644 | 156.4 |
| D | 13 | 249 | 52766 | 333.26 | 660 | 644 | 156.4 |
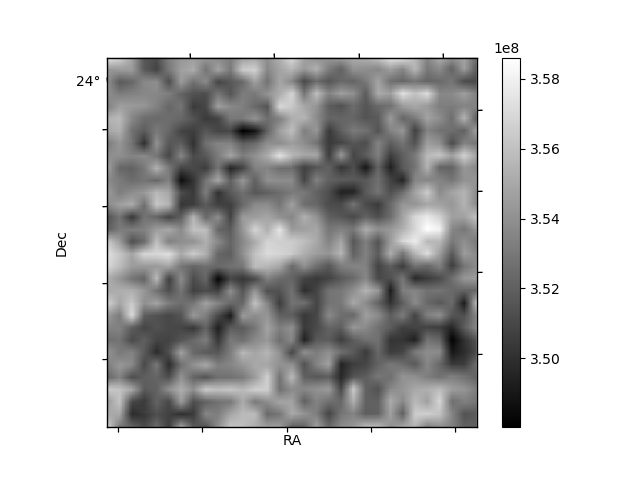
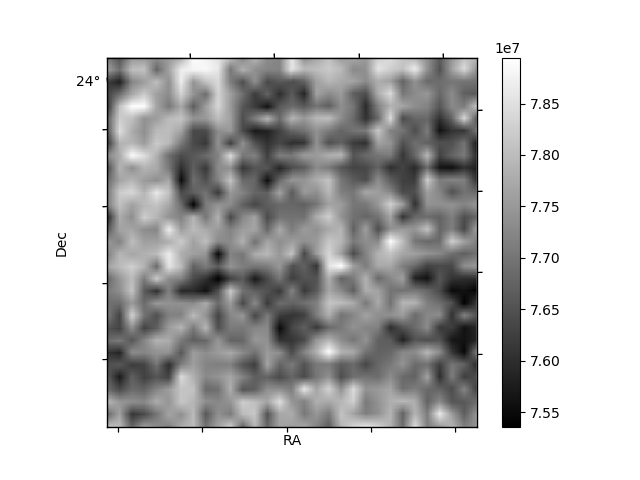
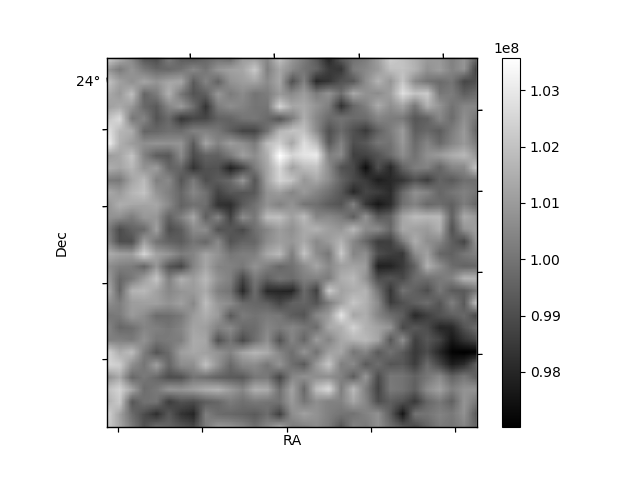
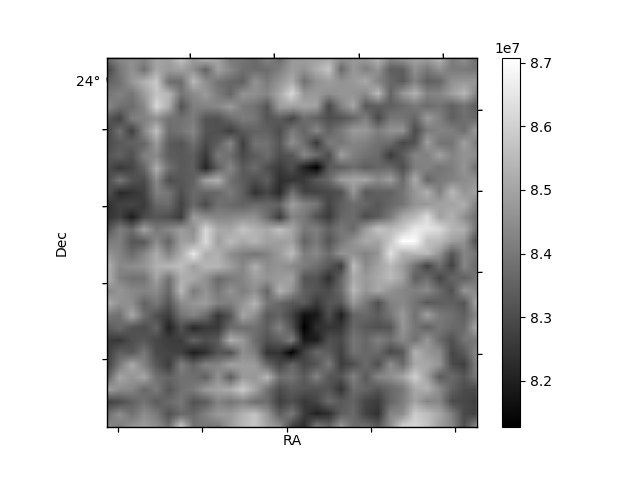
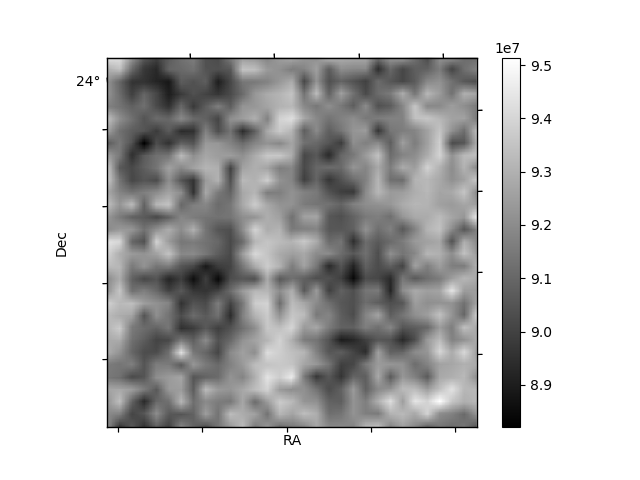
Histogram calculated using DETX and DETY for each event in the final _common_clean file
| Quadrant A | 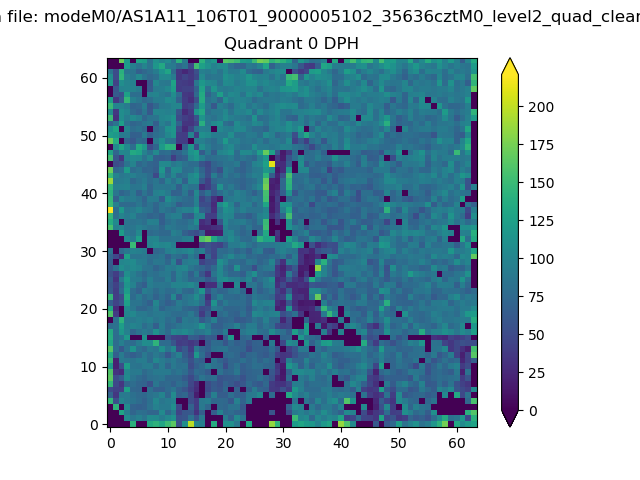 |
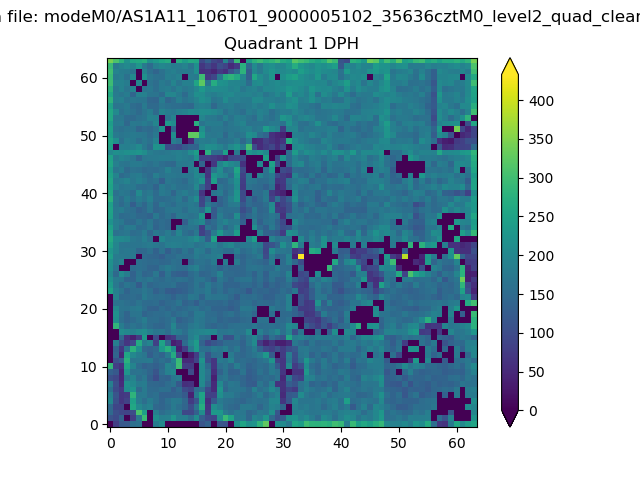 |
Quadrant B |
|---|---|---|---|
| Quadrant D | 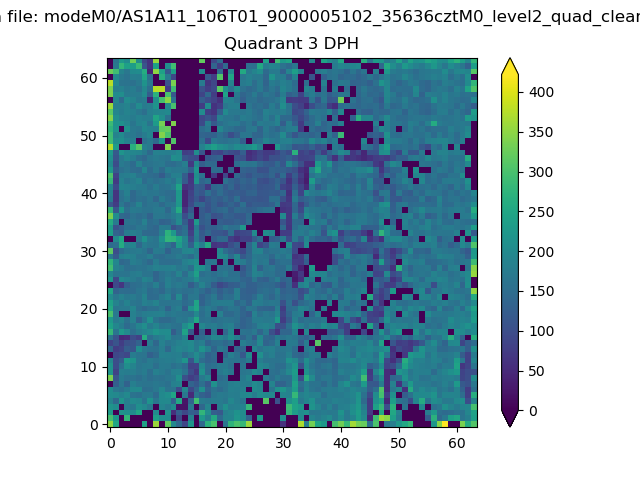 |
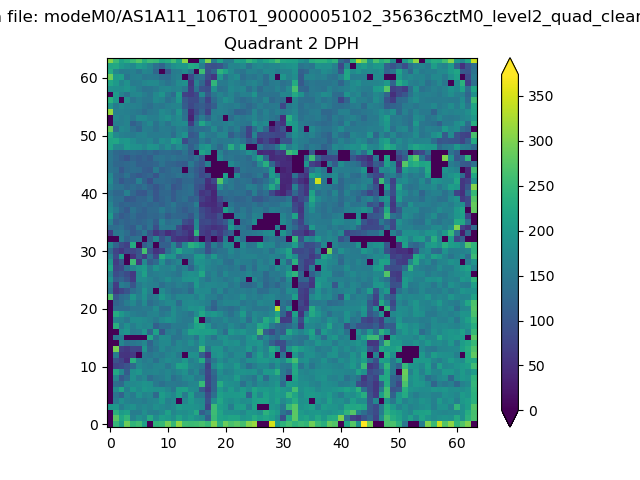 |
Quadrant C |
| Plot type | Count rate plots | Images |
|---|---|---|
| Comparison with Poisson distribution Blue bars denote a histogram of data divided into 1 sec bins. Red curve is a Poisson curve with rate = median count rate of data. |
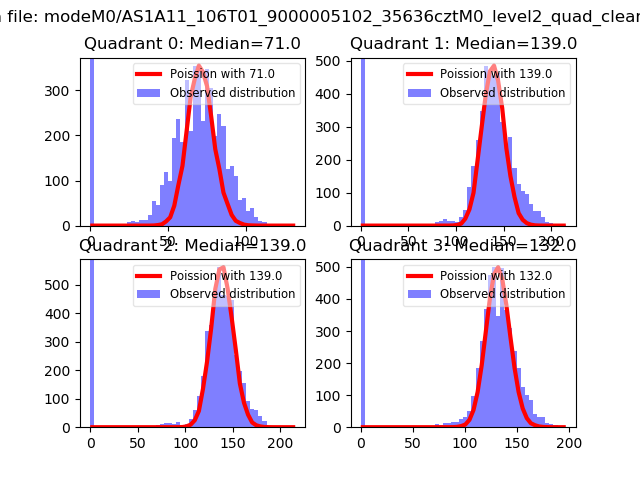 |
 |
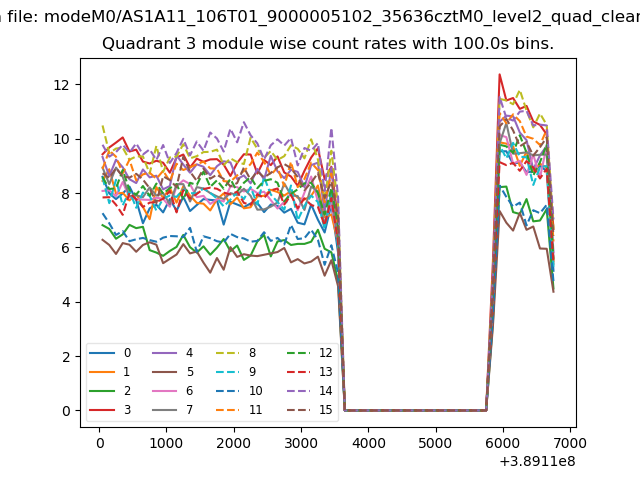
| Quadrant-wise count rates Data is divided into 100 sec bins |
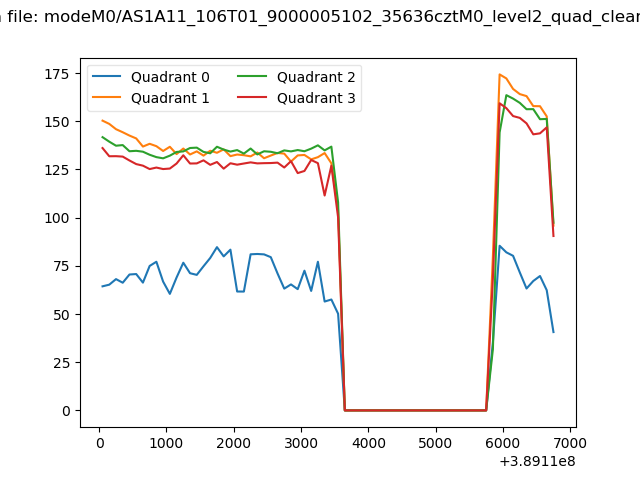 |
|
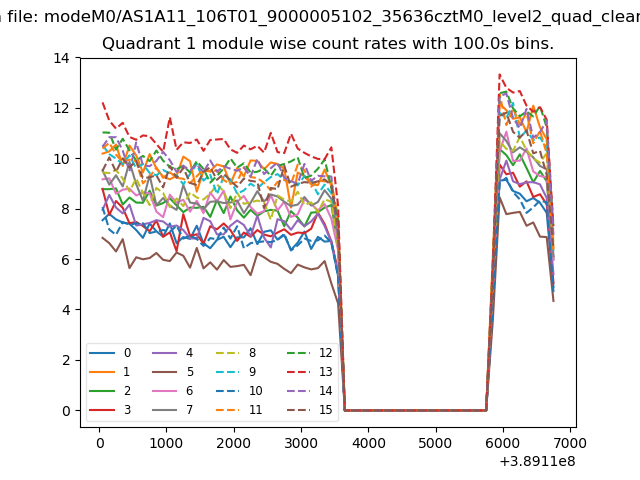
| Module-wise count rates for Quadrant A Data is divided into 100 sec bins |
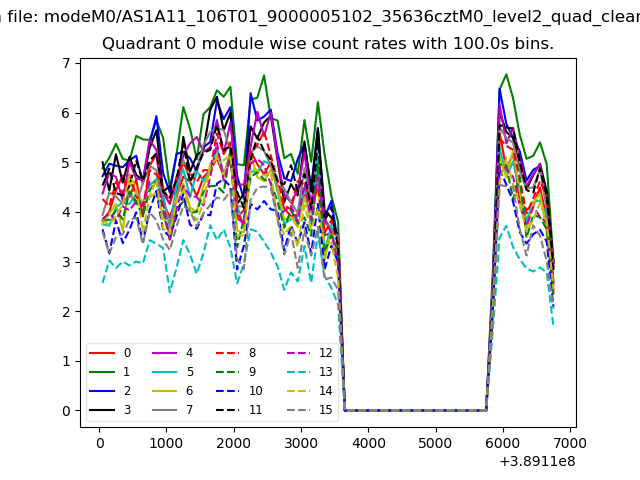 |
 |
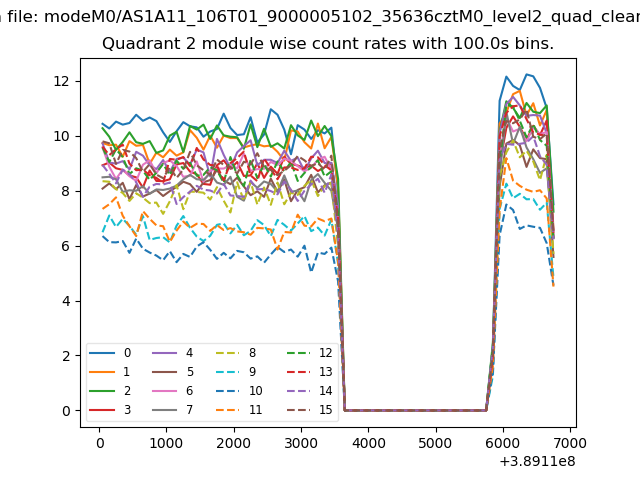
| Module-wise count rates for Quadrant B Data is divided into 100 sec bins |
 |
 |
| Module-wise count rates for Quadrant C Data is divided into 100 sec bins |
 |
 |
| Module-wise count rates for Quadrant D Data is divided into 100 sec bins |
 |
 |
| Parameter | Plot |
|---|---|
| CZT HV Monitor | 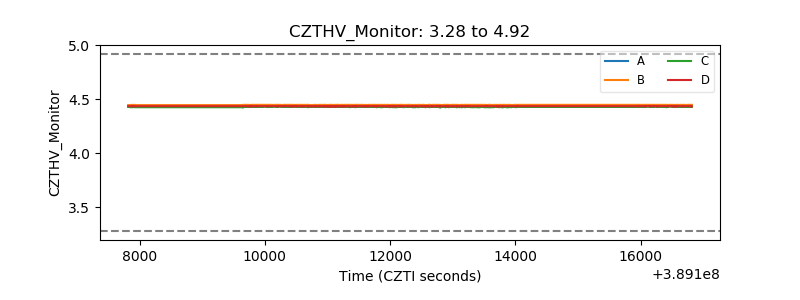 |
| D_VDD | 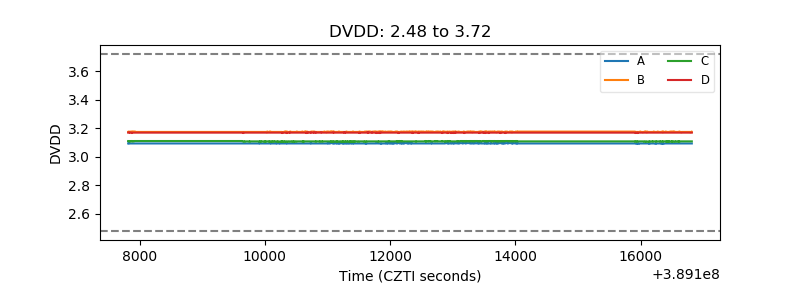 |
| Temperature 1 | 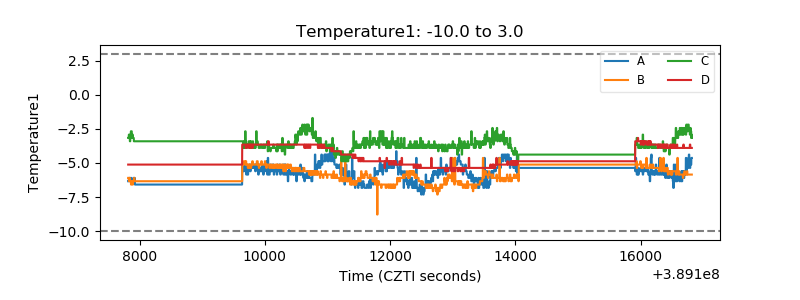 |
| Veto HV Monitor | 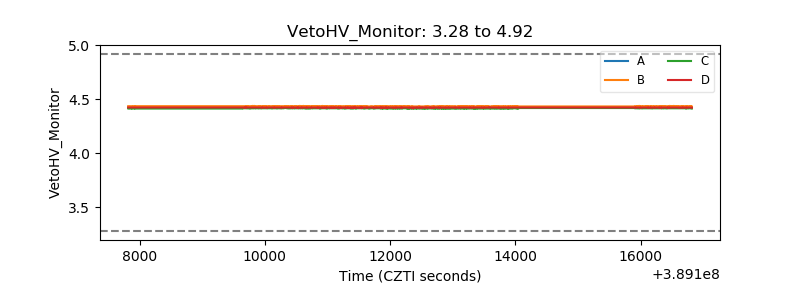 |
| Veto LLD | 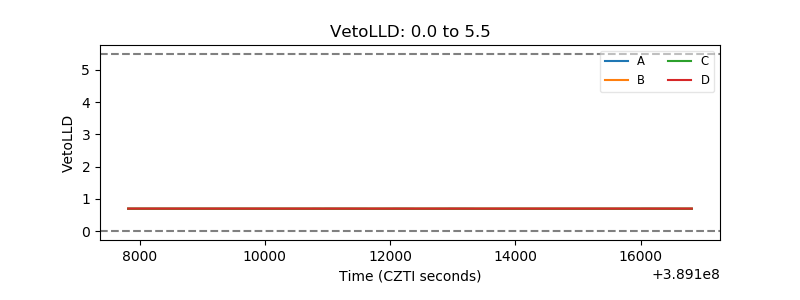 |
| Alpha Counter | 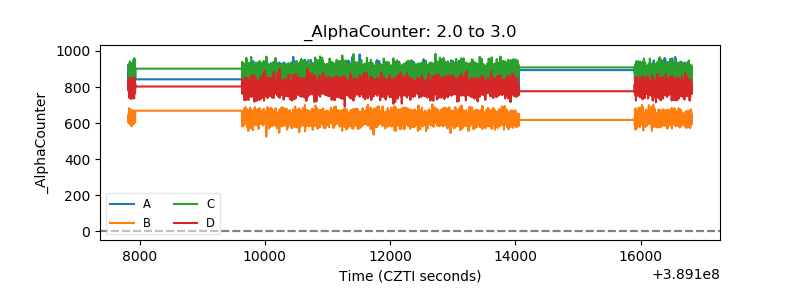 |
| _CPM_Rate | 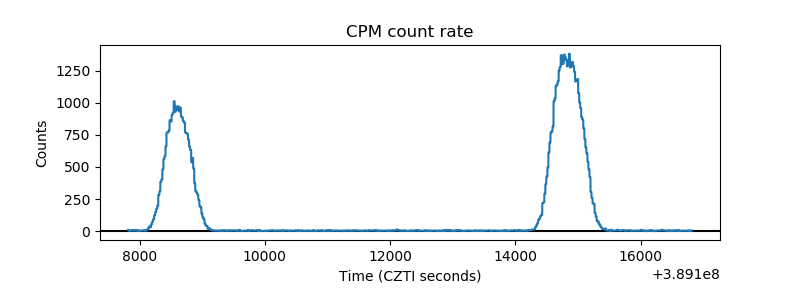 |
| CZT Counter | 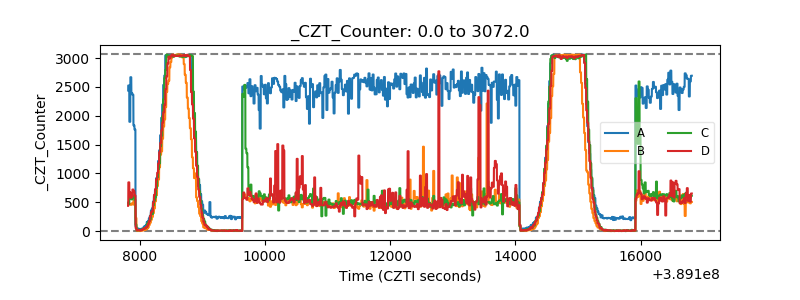 |
| +2.5 Volts monitor | 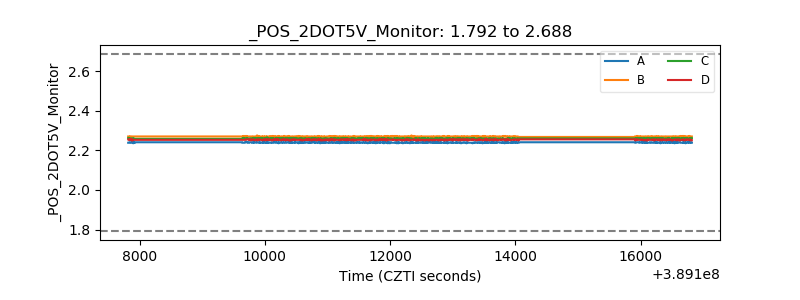 |
| +5 Volts monitor | 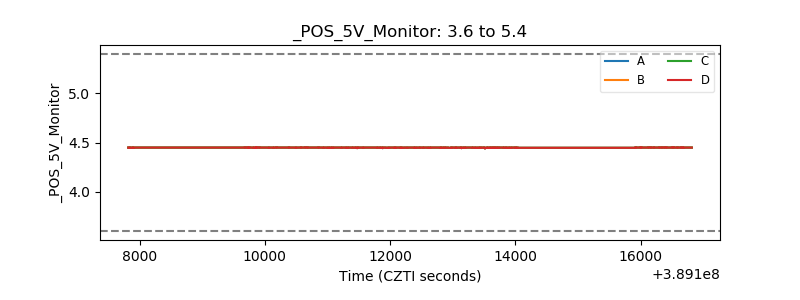 |
| _ROLL_ROT | 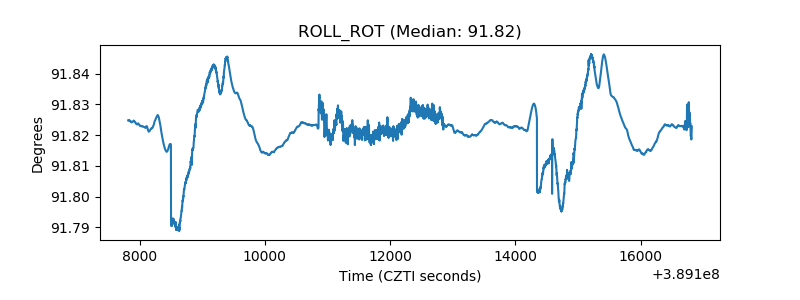 |
| _Roll_DEC | 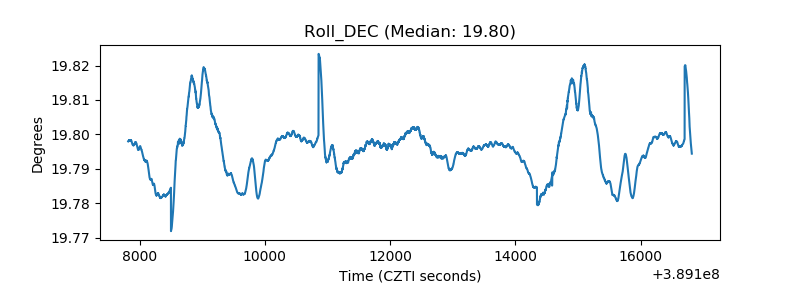 |
| _Roll_RA | 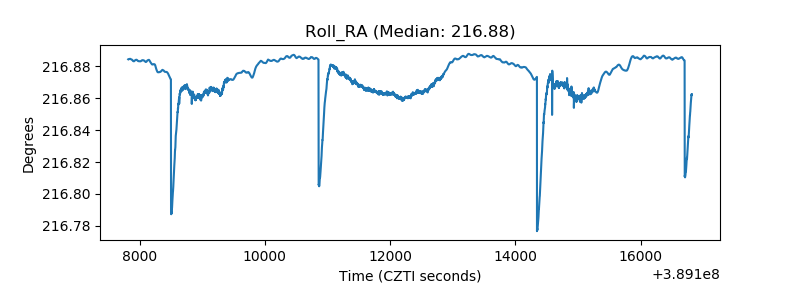 |
| Veto Counter | 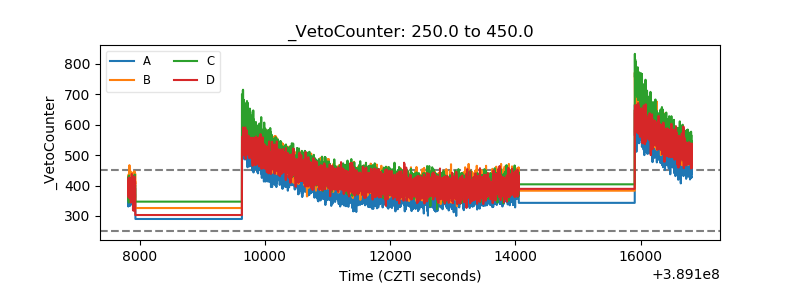 |