| Param | Original file | Final file |
|---|---|---|
| Filename | modeM0/AS1A11_106T01_9000005102_35633cztM0_level2.evt | modeM0/AS1A11_106T01_9000005102_35633cztM0_level2_quad_clean.evt |
| Size (bytes) | 1,453,855,680 | 122,814,720 |
| Size | 1.4 GB | 117.1 MB |
| Events in quadrant A | 25,332,263 | 486,377 |
| Events in quadrant B | 6,456,226 | 847,457 |
| Events in quadrant C | 5,972,610 | 847,369 |
| Events in quadrant D | 5,562,209 | 809,232 |
| Mode SS | |||
|---|---|---|---|
| Quadrant | BADHDUFLAG | Total packets | Discarded packets |
| A | 0 | 214 | 0 |
| B | 0 | 214 | 0 |
| C | 0 | 214 | 0 |
| D | 0 | 214 | 0 |
| Mode M0 | |||
|---|---|---|---|
| Quadrant | BADHDUFLAG | Total packets | Discarded packets |
| A | 0 | 82211 | 4 |
| B | 0 | 25817 | 3 |
| C | 0 | 23662 | 3 |
| D | 0 | 23193 | 3 |
| Mode M9 | |||
|---|---|---|---|
| Quadrant | BADHDUFLAG | Total packets | Discarded packets |
| A | 0 | 39 | 0 |
| B | 0 | 39 | 0 |
| C | 0 | 39 | 0 |
| D | 0 | 39 | 0 |
| Quadrant | Total seconds | Saturated seconds | Saturation percentage |
|---|---|---|---|
| A | 10475 | 10475 | 100.000000% |
| B | 10475 | 396 | 3.780430% |
| C | 10475 | 237 | 2.262530% |
| D | 10475 | 103 | 0.983294% |
Noise dominated data is calculated using 1-second bins in cleaned event files. If a bin has >2000 counts, and if more than 50% of those come from <1% of pixels, then it is considered to be noise-dominated and hence unusable.
| Quadrant | # 1 sec bins | Bins with >0 counts | Bins with >2000 counts | High rate bins dominated by noise | Noise dominated (total time) | Noise dominated (detector-on time) | Marked lightcurve |
|---|---|---|---|---|---|---|---|
| A | 13579 | 10477 | 10006 | 10006 | 73.69% | 95.50% | 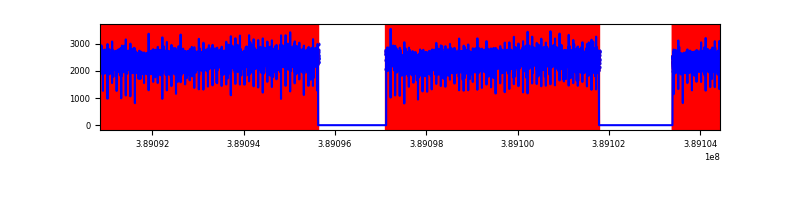 |
| B | 13579 | 10477 | 265 | 265 | 1.95% | 2.53% | 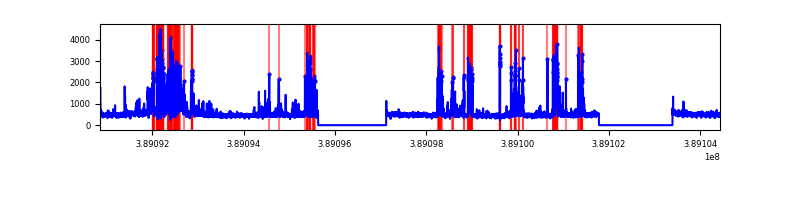 |
| C | 13579 | 10477 | 171 | 171 | 1.26% | 1.63% | 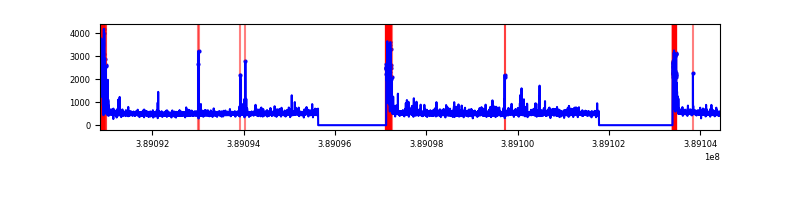 |
| D | 13579 | 10477 | 77 | 77 | 0.57% | 0.73% | 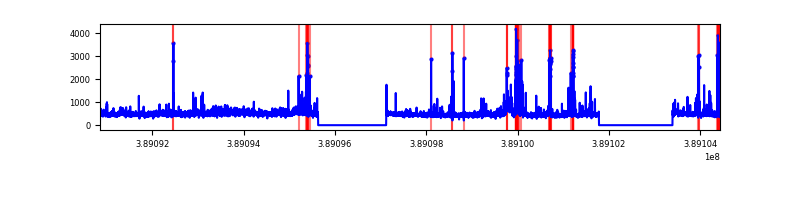 |
Top three noisy pixels from each quadrant. If the there are fewer than three noisy pixels in the level2.evt file, extra rows are filled as -1
| Pixel properties | Quadrant properties | ||||||
|---|---|---|---|---|---|---|---|
| Quadrant | DetID | PixID | Counts | Sigma | Mean | Median | Sigma |
| A | 15 | 169 | 22088647 | 137527.51 | 797 | 781 | 160.6 |
| A | 10 | 83 | 140914 | 872.52 | 797 | 781 | 160.6 |
| A | 13 | 254 | 9408 | 53.72 | 797 | 781 | 160.6 |
| B | 5 | 172 | 1621568 | 6950.32 | 1201 | 1167 | 233.1 |
| B | 0 | 189 | 68868 | 290.39 | 1201 | 1167 | 233.1 |
| B | 12 | 111 | 29703 | 122.4 | 1201 | 1167 | 233.1 |
| C | 0 | 10 | 897283 | 3262.04 | 1182 | 1188 | 274.7 |
| C | 15 | 214 | 432822 | 1571.27 | 1182 | 1188 | 274.7 |
| C | 9 | 69 | 16066 | 54.16 | 1182 | 1188 | 274.7 |
| D | 7 | 80 | 274398 | 944.22 | 1191 | 1158 | 289.4 |
| D | 1 | 52 | 263415 | 906.27 | 1191 | 1158 | 289.4 |
| D | 13 | 249 | 155742 | 534.19 | 1191 | 1158 | 289.4 |
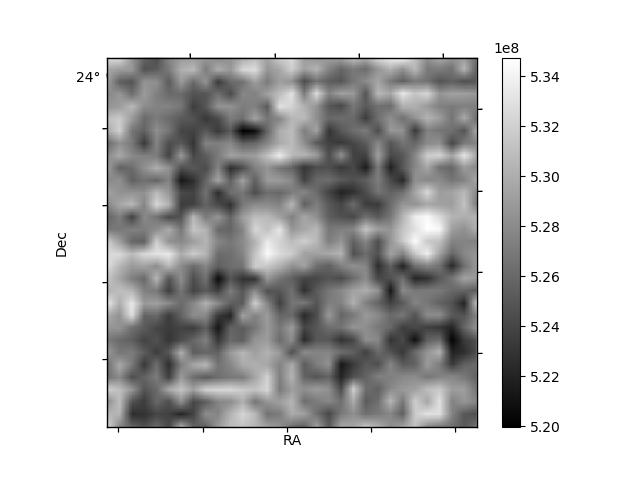
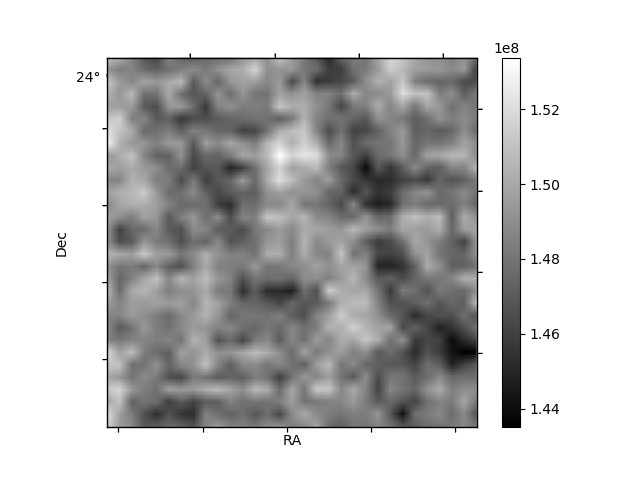
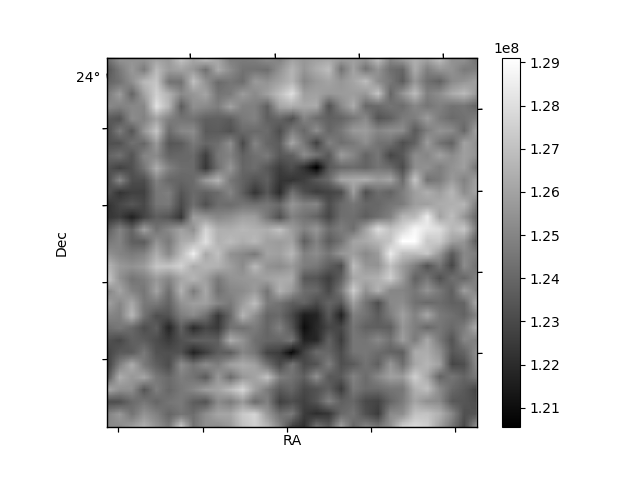
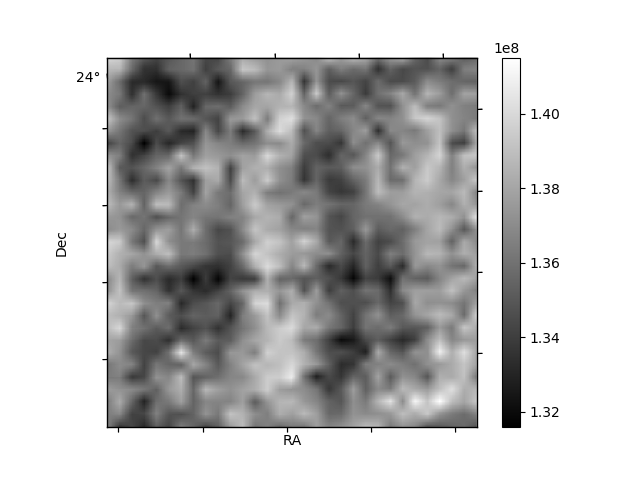
Histogram calculated using DETX and DETY for each event in the final _common_clean file
| Quadrant A | 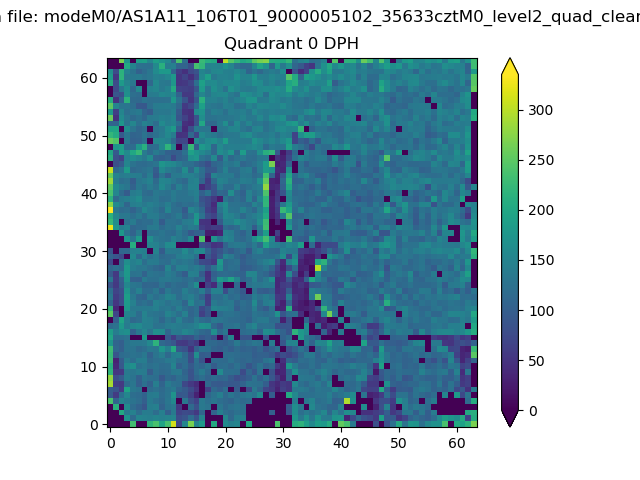 |
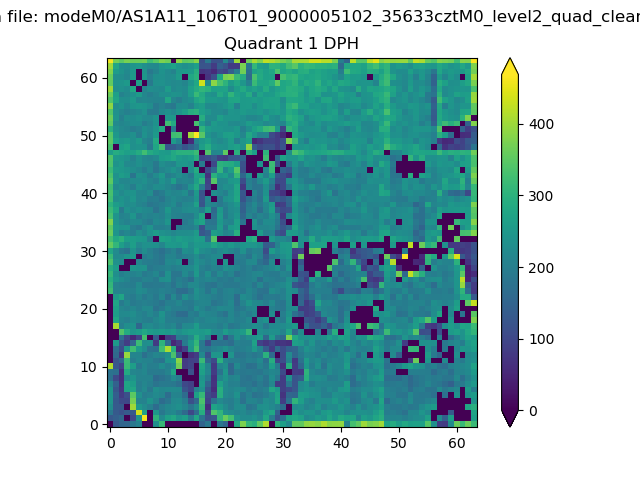 |
Quadrant B |
|---|---|---|---|
| Quadrant D | 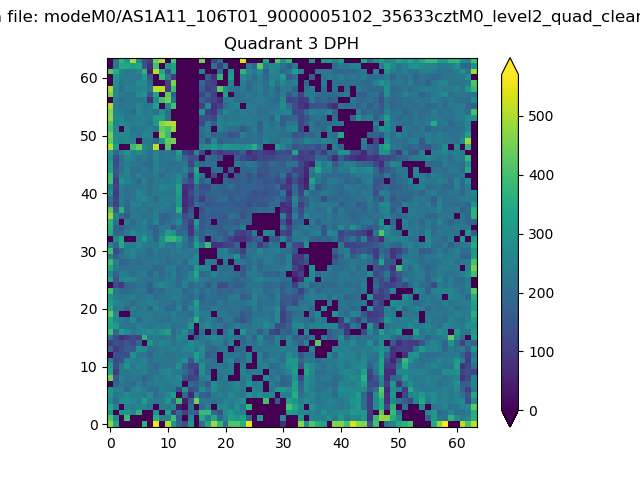 |
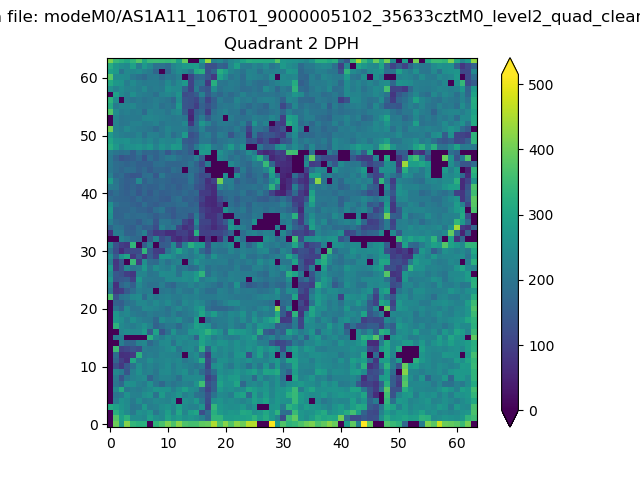 |
Quadrant C |
| Plot type | Count rate plots | Images |
|---|---|---|
| Comparison with Poisson distribution Blue bars denote a histogram of data divided into 1 sec bins. Red curve is a Poisson curve with rate = median count rate of data. |
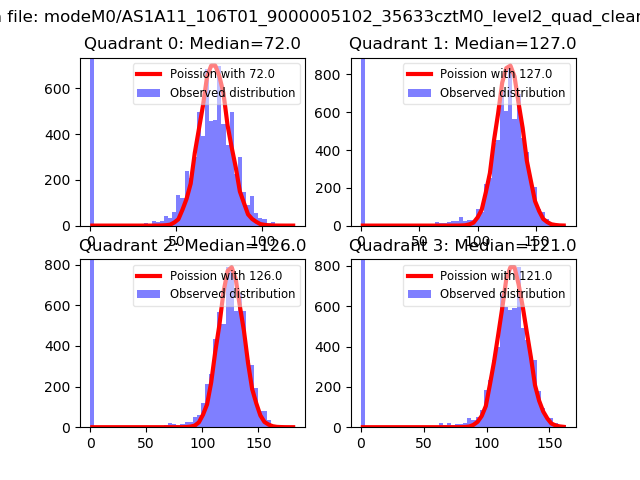 |
 |
| Quadrant-wise count rates Data is divided into 100 sec bins |
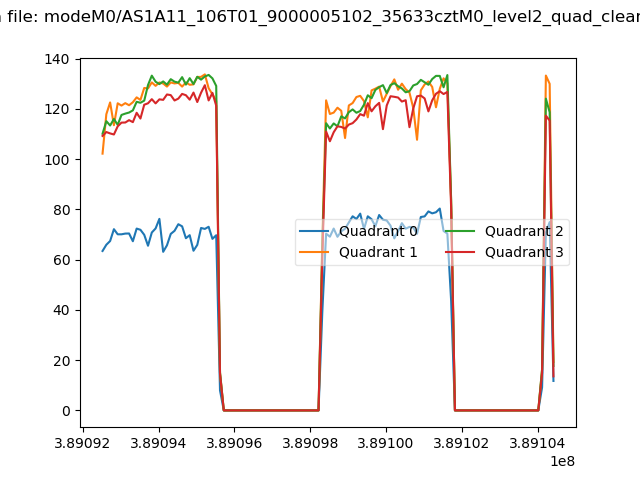 |
|
| Module-wise count rates for Quadrant A Data is divided into 100 sec bins |
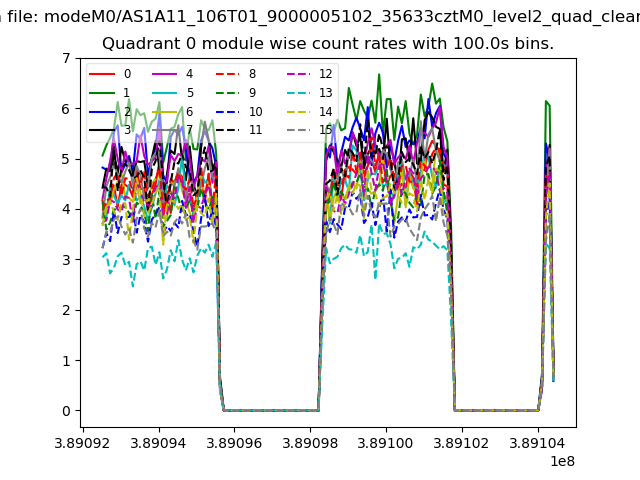 |
 |
| Module-wise count rates for Quadrant B Data is divided into 100 sec bins |
 |
 |
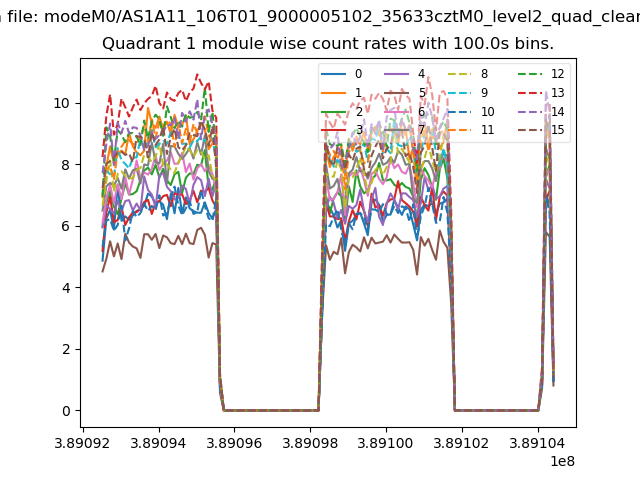
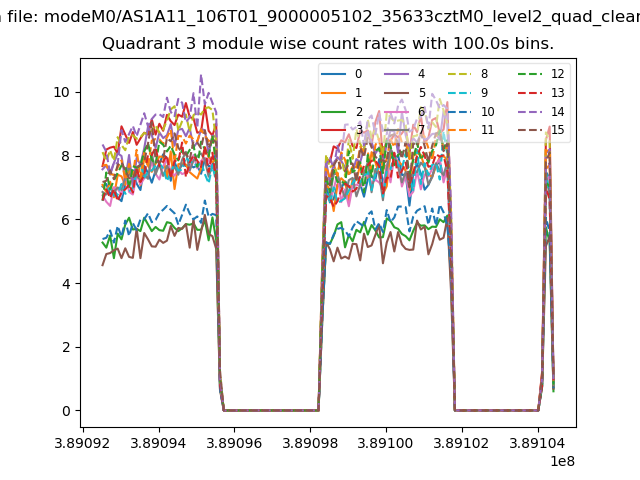
| Module-wise count rates for Quadrant C Data is divided into 100 sec bins |
 |
 |
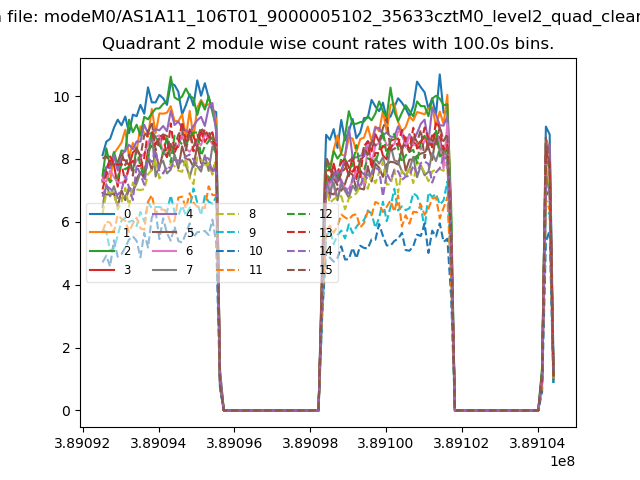
| Module-wise count rates for Quadrant D Data is divided into 100 sec bins |
 |
 |
| Parameter | Plot |
|---|---|
| CZT HV Monitor | 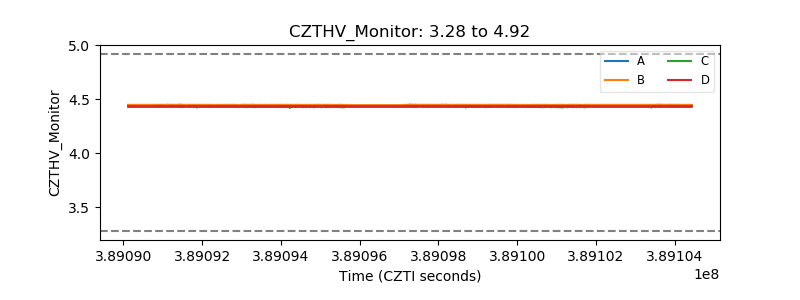 |
| D_VDD | 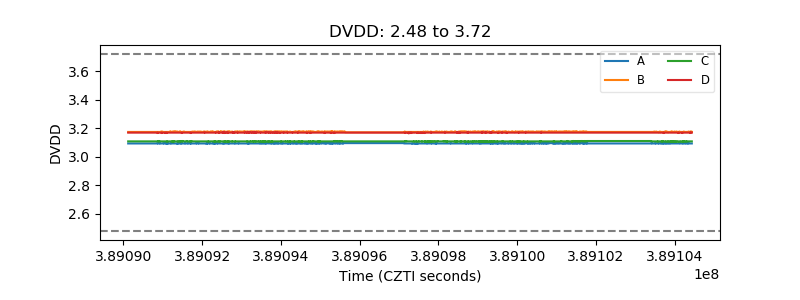 |
| Temperature 1 | 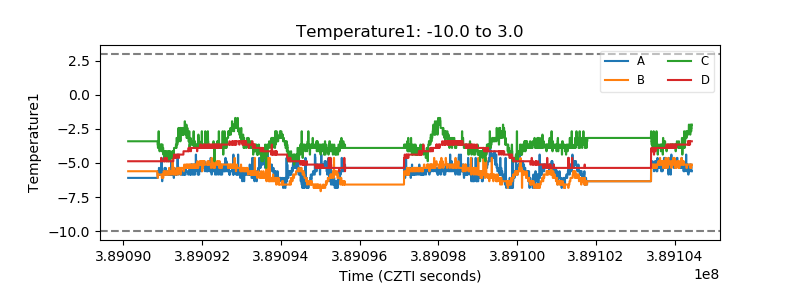 |
| Veto HV Monitor | 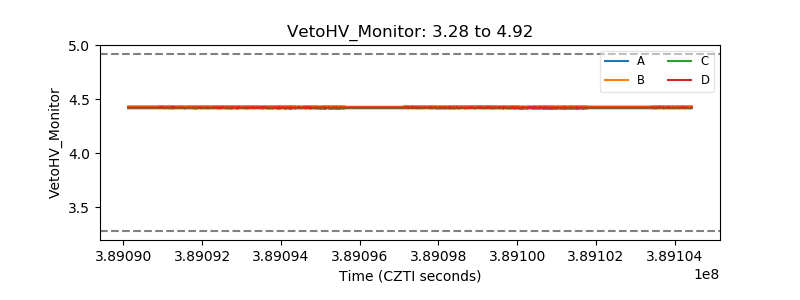 |
| Veto LLD | 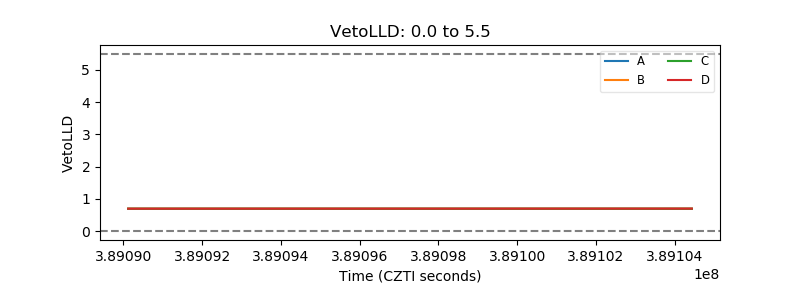 |
| Alpha Counter | 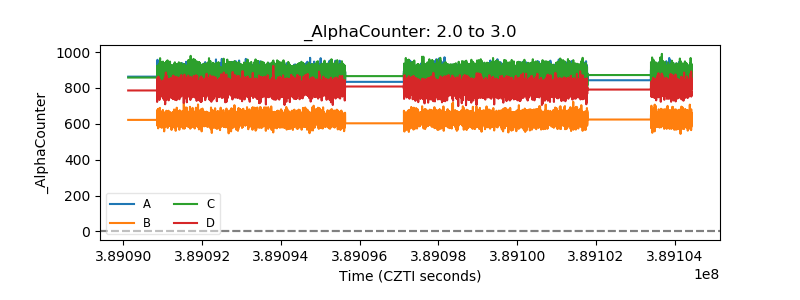 |
| _CPM_Rate | 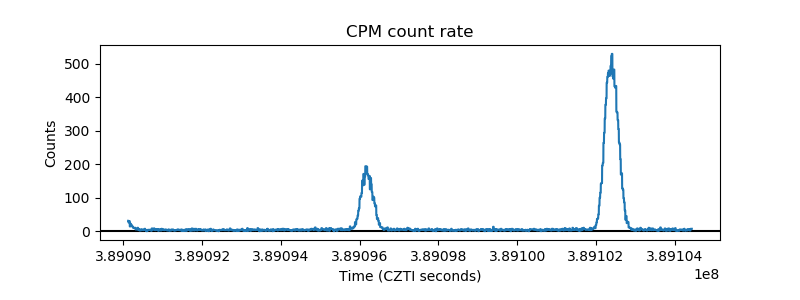 |
| CZT Counter | 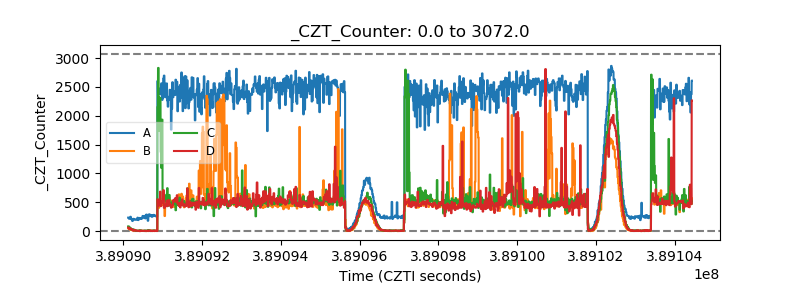 |
| +2.5 Volts monitor | 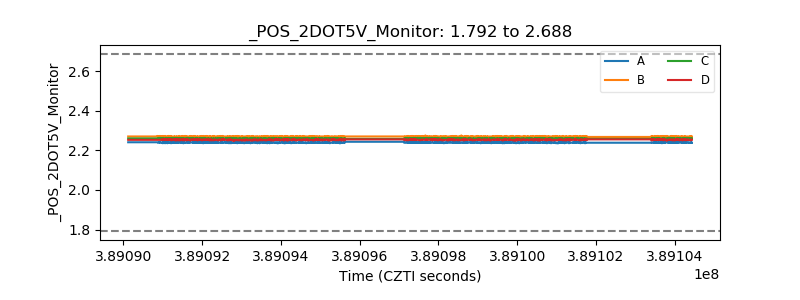 |
| +5 Volts monitor | 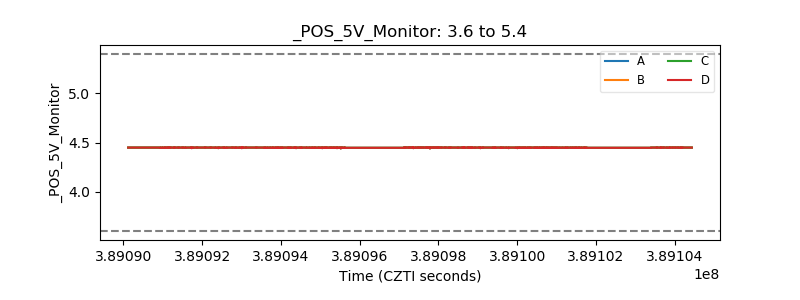 |
| _ROLL_ROT | 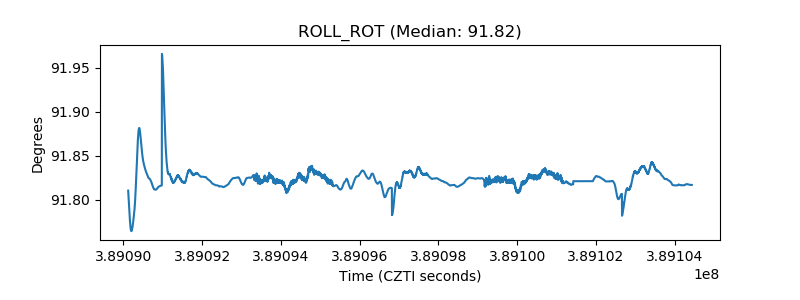 |
| _Roll_DEC | 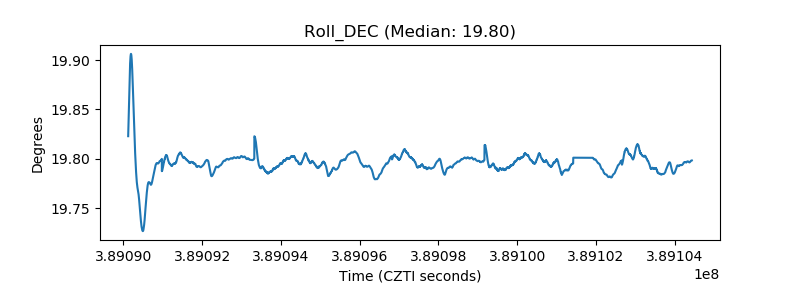 |
| _Roll_RA | 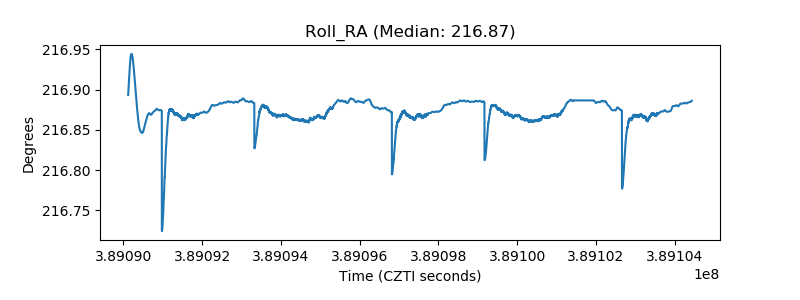 |
| Veto Counter | 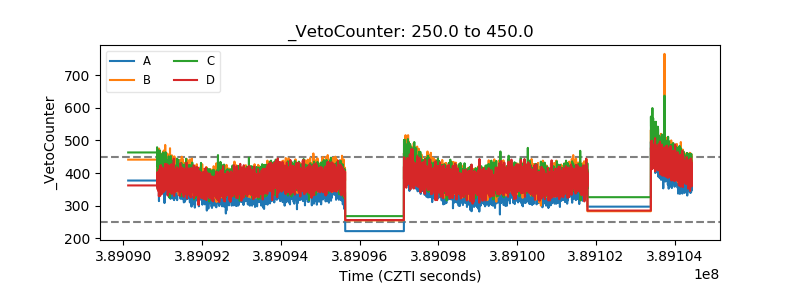 |