| Param | Original file | Final file |
|---|---|---|
| Filename | modeM0/AS1A11_106T01_9000005102cztM0_level2_bc.evt | modeM0/AS1A11_106T01_9000005102cztM0_level2_quad_clean.evt |
| Size (bytes) | 7,167,153,600 | 859,826,880 |
| Size | 6.7 GB | 820.0 MB |
| Events in quadrant A | 146,596,179 | 3,192,722 |
| Events in quadrant B | 22,166,665 | 6,055,095 |
| Events in quadrant C | 23,508,744 | 6,042,964 |
| Events in quadrant D | 19,917,500 | 5,814,822 |
| Mode SS | |||
|---|---|---|---|
| Quadrant | BADHDUFLAG | Total packets | Discarded packets |
| A | 0 | 1464 | 0 |
| B | 0 | 1464 | 0 |
| C | 0 | 1464 | 0 |
| D | 0 | 1464 | 0 |
| Mode M0 | |||
|---|---|---|---|
| Quadrant | BADHDUFLAG | Total packets | Discarded packets |
| A | 0 | 570531 | 0 |
| B | 0 | 173706 | 0 |
| C | 0 | 170341 | 0 |
| D | 0 | 160311 | 0 |
| Mode M9 | |||
|---|---|---|---|
| Quadrant | BADHDUFLAG | Total packets | Discarded packets |
| A | 0 | 261 | 0 |
| B | 0 | 261 | 0 |
| C | 0 | 261 | 0 |
| D | 0 | 261 | 0 |
| Quadrant | Total seconds | Saturated seconds | Saturation percentage |
|---|---|---|---|
| A | 71686 | 71182 | 99.296934% |
| B | 71686 | 2063 | 2.877828% |
| C | 71686 | 1663 | 2.319839% |
| D | 71686 | 753 | 1.050414% |
Noise dominated data is calculated using 1-second bins in cleaned event files. If a bin has >2000 counts, and if more than 50% of those come from <1% of pixels, then it is considered to be noise-dominated and hence unusable.
| Quadrant | # 1 sec bins | Bins with >0 counts | Bins with >2000 counts | High rate bins dominated by noise | Noise dominated (total time) | Noise dominated (detector-on time) | Marked lightcurve |
|---|---|---|---|---|---|---|---|
| A | 97017 | 71700 | 46528 | 46528 | 47.96% | 64.89% | 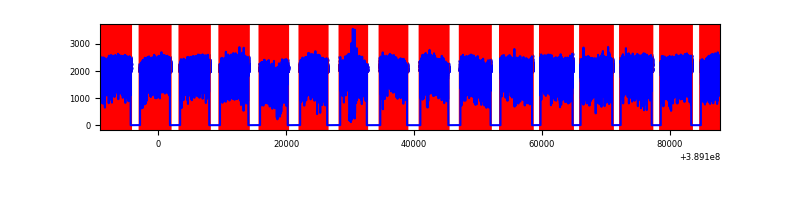 |
| B | 97016 | 71685 | 180 | 180 | 0.19% | 0.25% | 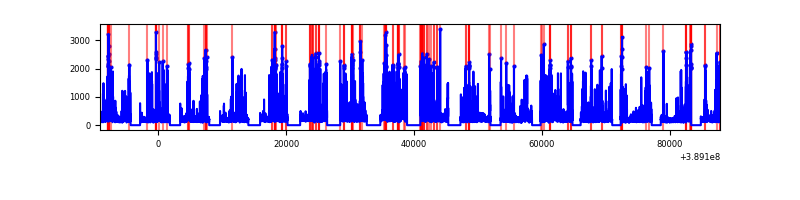 |
| C | 97016 | 71683 | 302 | 302 | 0.31% | 0.42% | 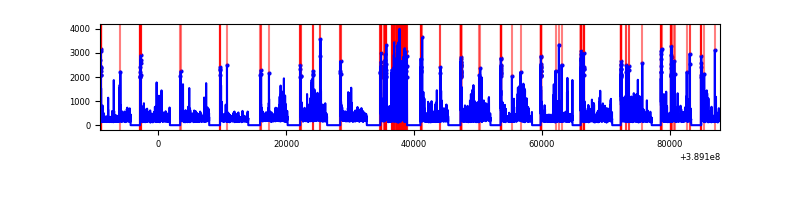 |
| D | 97016 | 71687 | 277 | 277 | 0.29% | 0.39% | 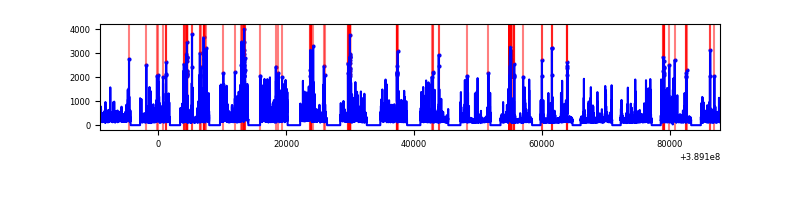 |
Top three noisy pixels from each quadrant. If the there are fewer than three noisy pixels in the level2.evt file, extra rows are filled as -1
| Pixel properties | Quadrant properties | ||||||
|---|---|---|---|---|---|---|---|
| Quadrant | DetID | PixID | Counts | Sigma | Mean | Median | Sigma |
| A | 15 | 169 | 137261689 | 282953.43 | 2169 | 2135 | 485.1 |
| A | 10 | 83 | 815884 | 1677.5 | 2169 | 2135 | 485.1 |
| A | 13 | 6 | 54403 | 107.75 | 2169 | 2135 | 485.1 |
| B | 5 | 172 | 7343377 | 10134.42 | 3693 | 3612 | 724.2 |
| B | 0 | 189 | 289183 | 394.3 | 3693 | 3612 | 724.2 |
| B | 0 | 197 | 275050 | 374.79 | 3693 | 3612 | 724.2 |
| C | 0 | 10 | 5205105 | 6202.76 | 3653 | 3620 | 838.6 |
| C | 15 | 214 | 2785912 | 3317.88 | 3653 | 3620 | 838.6 |
| C | 9 | 187 | 385350 | 455.21 | 3653 | 3620 | 838.6 |
| D | 12 | 217 | 1614294 | 1884.42 | 3671 | 3560 | 854.8 |
| D | 2 | 153 | 783434 | 912.38 | 3671 | 3560 | 854.8 |
| D | 13 | 249 | 659969 | 767.94 | 3671 | 3560 | 854.8 |
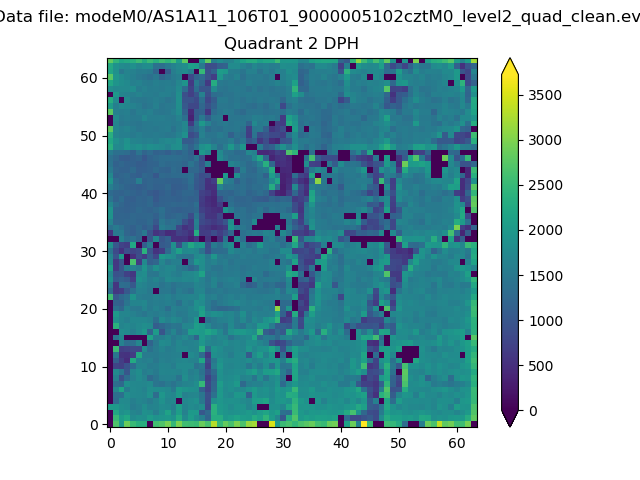
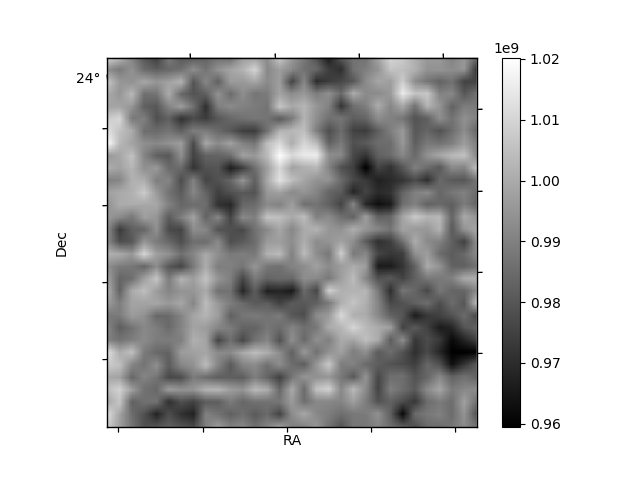
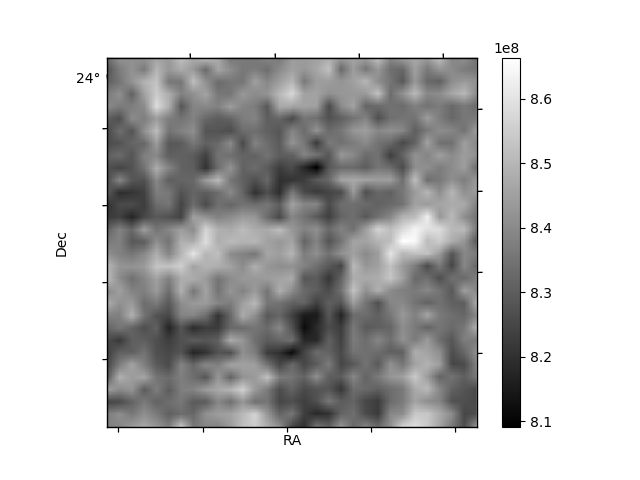
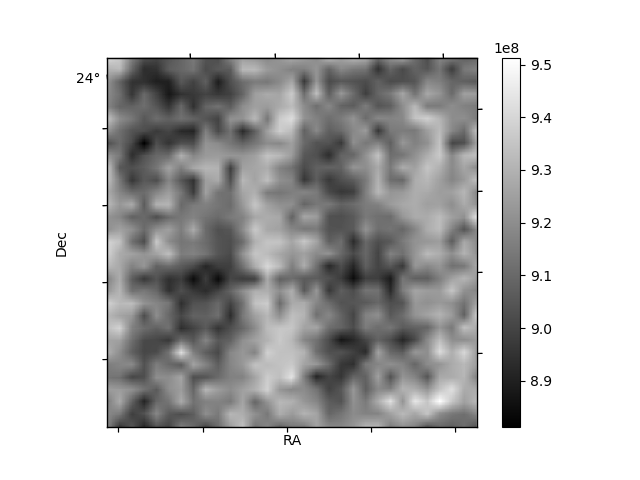
Histogram calculated using DETX and DETY for each event in the final _common_clean file
| Quadrant A | 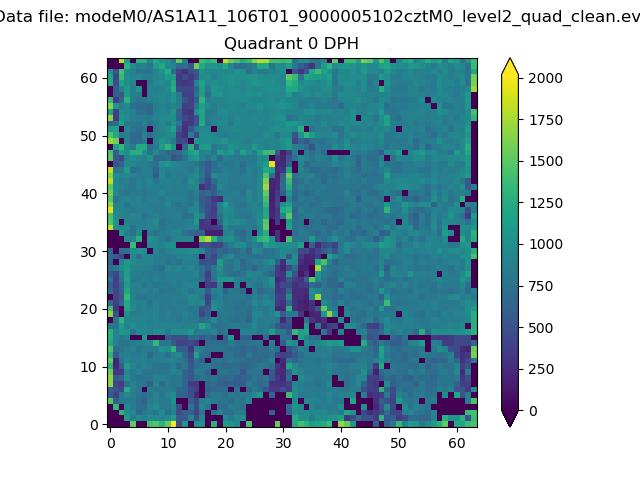 |
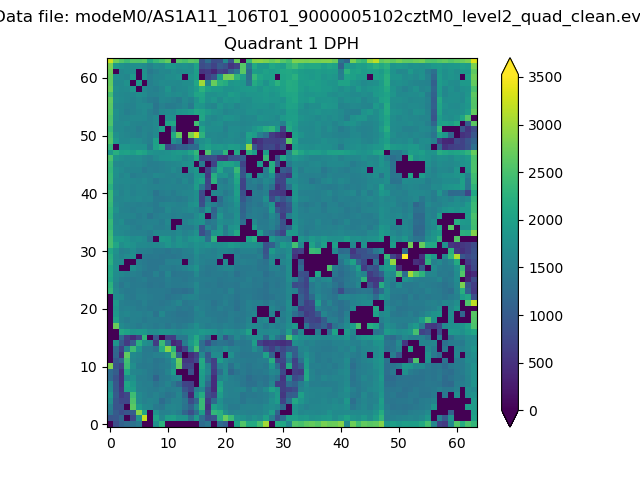 |
Quadrant B |
|---|---|---|---|
| Quadrant D | 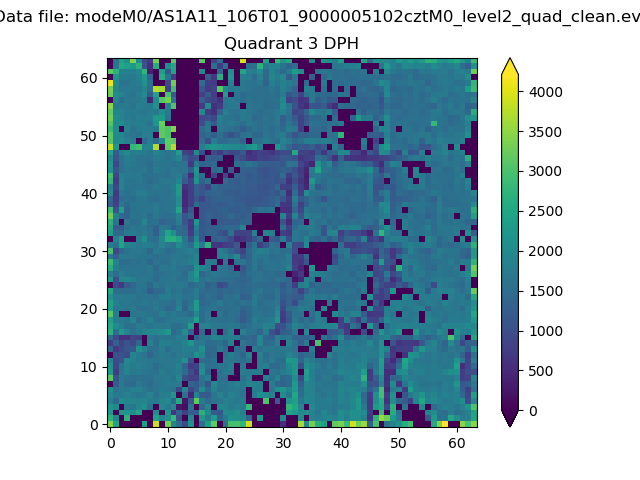 |
 |
Quadrant C |
| Plot type | Count rate plots | Images |
|---|---|---|
| Comparison with Poisson distribution Blue bars denote a histogram of data divided into 1 sec bins. Red curve is a Poisson curve with rate = median count rate of data. |
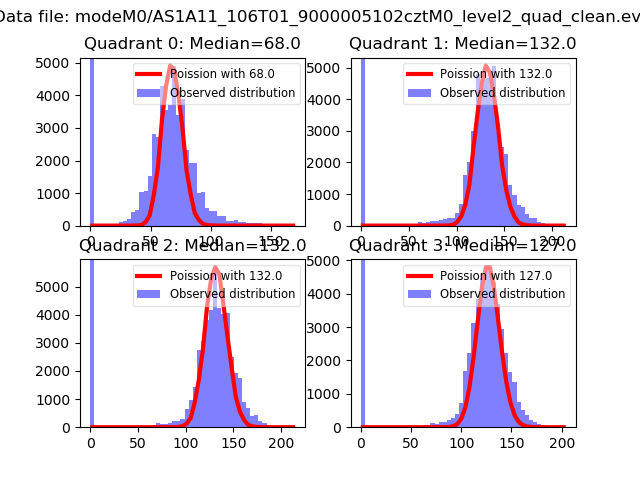 |
 |
| Quadrant-wise count rates Data is divided into 100 sec bins |
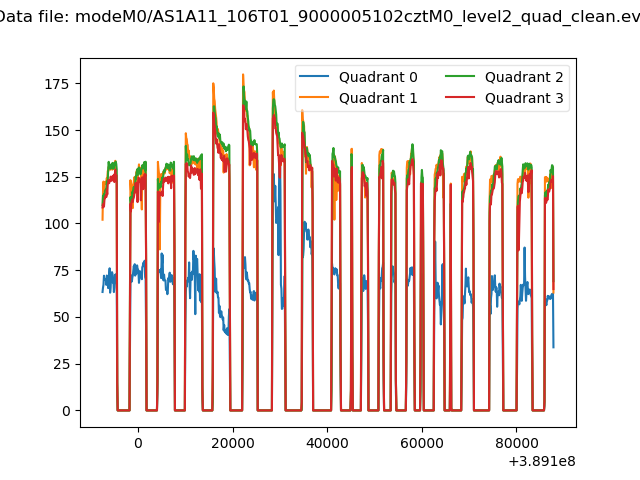 |
|
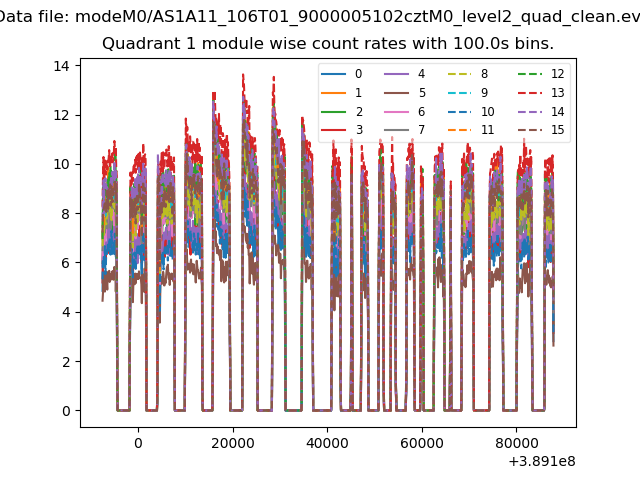
| Module-wise count rates for Quadrant A Data is divided into 100 sec bins |
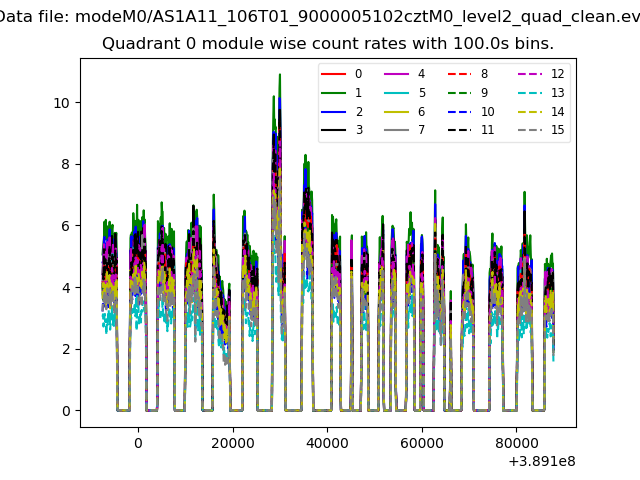 |
 |
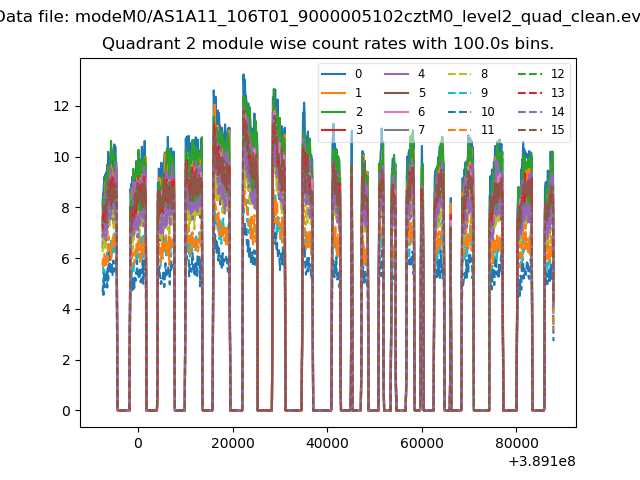
| Module-wise count rates for Quadrant B Data is divided into 100 sec bins |
 |
 |
| Module-wise count rates for Quadrant C Data is divided into 100 sec bins |
 |
 |
| Module-wise count rates for Quadrant D Data is divided into 100 sec bins |
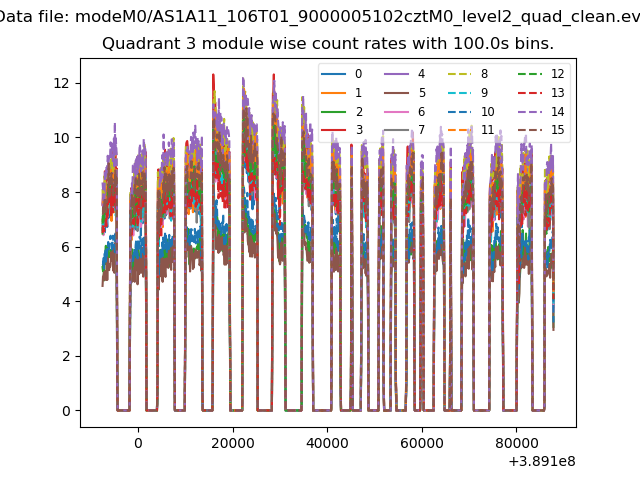 |
 |
| Parameter | Plot |
|---|---|
| CZT HV Monitor | 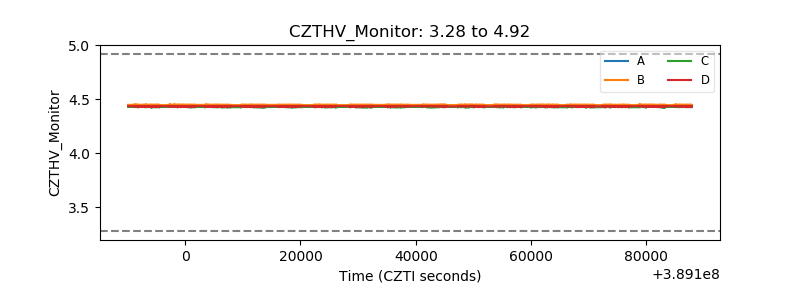 |
| D_VDD | 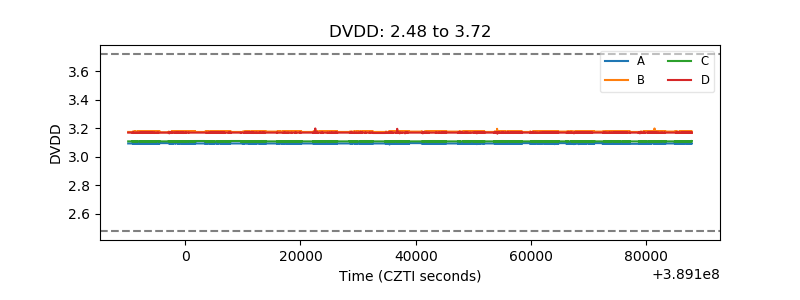 |
| Temperature 1 | 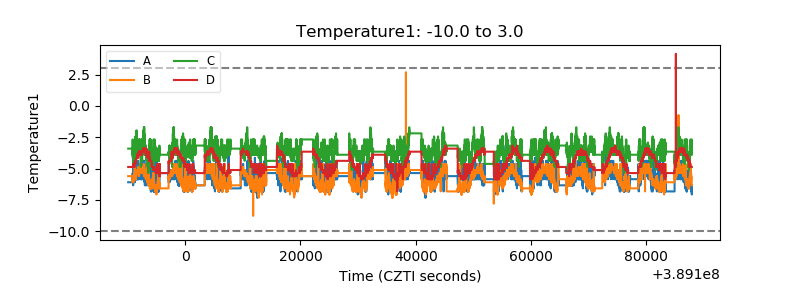 |
| Veto HV Monitor | 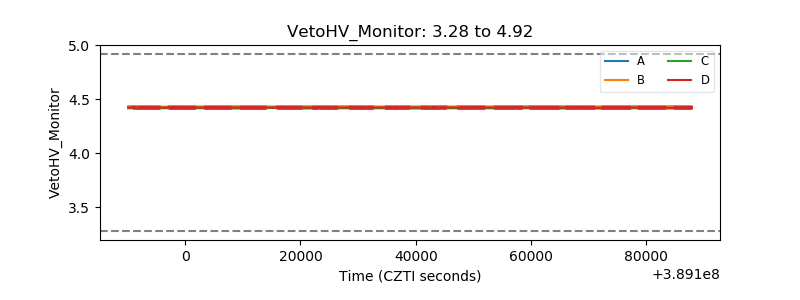 |
| Veto LLD | 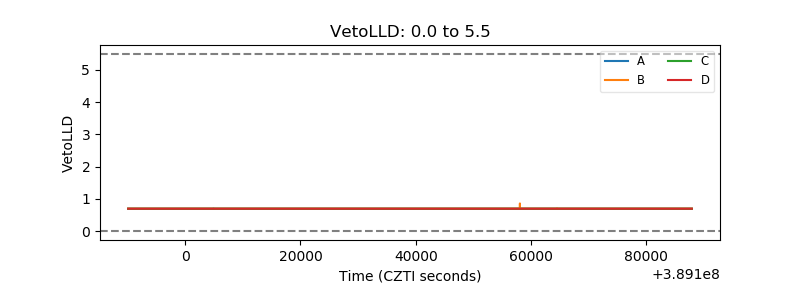 |
| Alpha Counter | 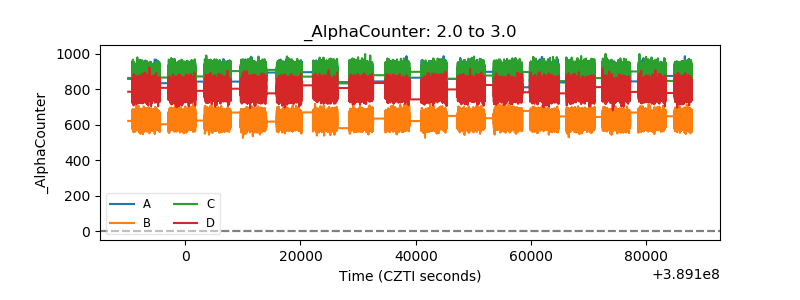 |
| _CPM_Rate | 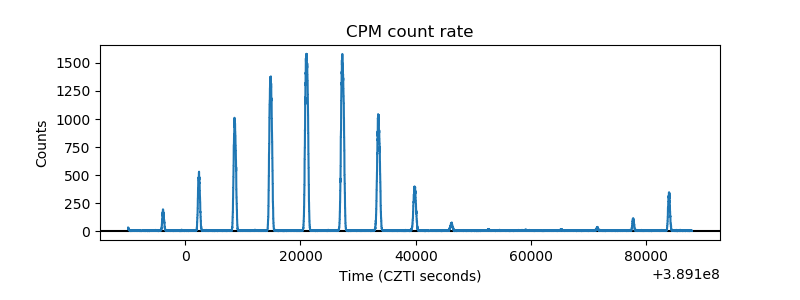 |
| CZT Counter | 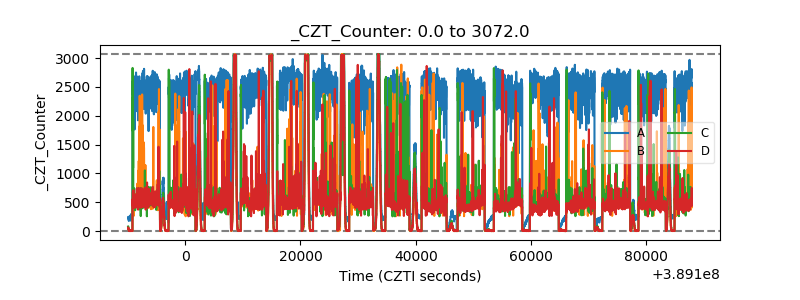 |
| +2.5 Volts monitor | 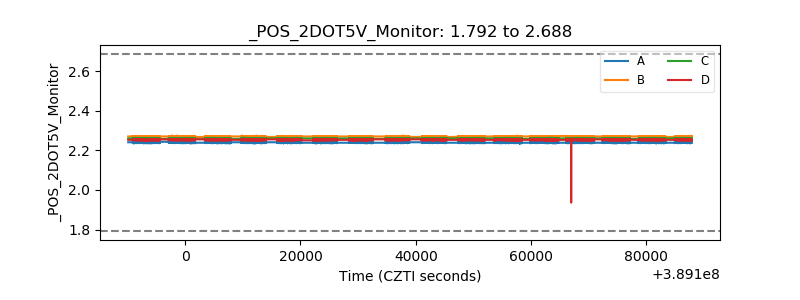 |
| +5 Volts monitor | 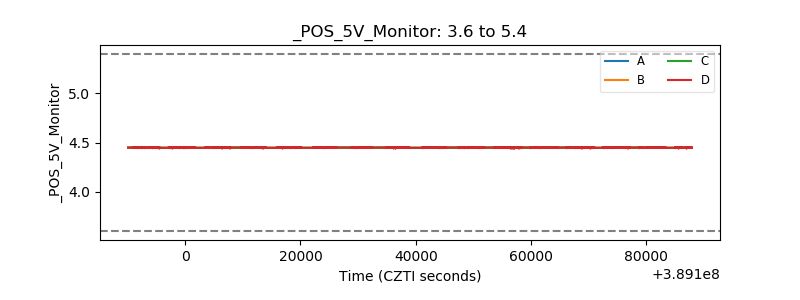 |
| _ROLL_ROT | 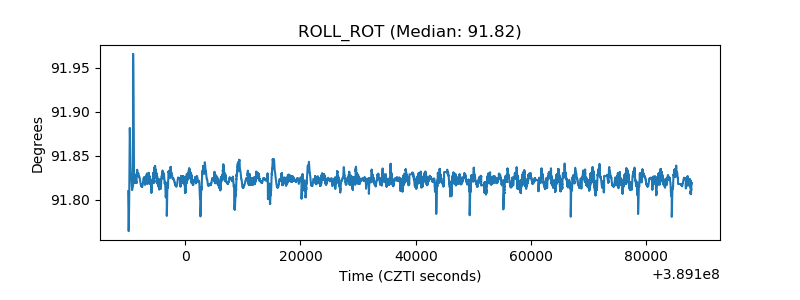 |
| _Roll_DEC | 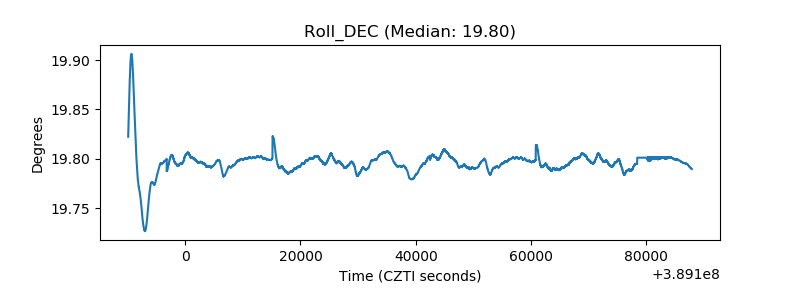 |
| _Roll_RA | 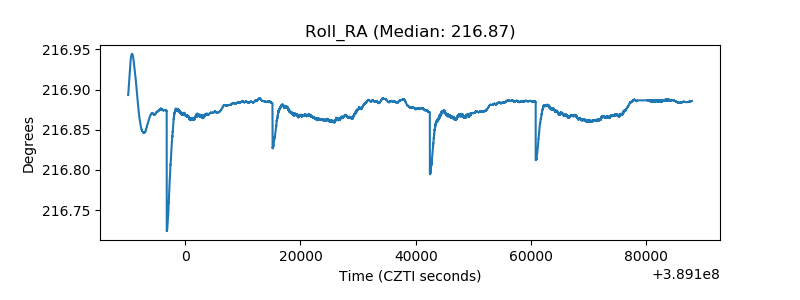 |
| Veto Counter | 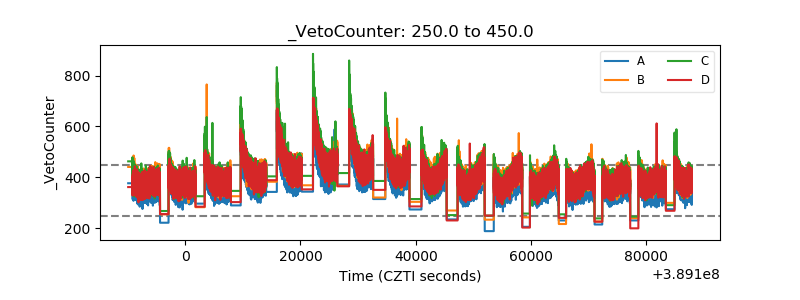 |