| Param | Original file | Final file |
|---|---|---|
| Filename | modeM0/AS1T05_028T01_9000005100_35632cztM0_level2.evt | modeM0/AS1T05_028T01_9000005100_35632cztM0_level2_quad_clean.evt |
| Size (bytes) | 2,212,090,560 | 202,979,520 |
| Size | 2.1 GB | 193.6 MB |
| Events in quadrant A | 26,228,158 | 1,043,553 |
| Events in quadrant B | 15,834,206 | 1,275,679 |
| Events in quadrant C | 10,766,895 | 1,290,655 |
| Events in quadrant D | 12,891,804 | 1,231,711 |
| Mode M9 | |||
|---|---|---|---|
| Quadrant | BADHDUFLAG | Total packets | Discarded packets |
| A | 0 | 57 | 0 |
| B | 0 | 57 | 0 |
| C | 0 | 57 | 0 |
| D | 0 | 58 | 0 |
| Mode M0 | |||
|---|---|---|---|
| Quadrant | BADHDUFLAG | Total packets | Discarded packets |
| A | 0 | 91245 | 1134 |
| B | 0 | 59631 | 241 |
| C | 0 | 43148 | 130 |
| D | 0 | 50536 | 147 |
| Mode SS | |||
|---|---|---|---|
| Quadrant | BADHDUFLAG | Total packets | Discarded packets |
| A | 0 | 386 | 0 |
| B | 0 | 386 | 0 |
| C | 0 | 385 | 0 |
| D | 0 | 386 | 0 |
| Quadrant | Total seconds | Saturated seconds | Saturation percentage |
|---|---|---|---|
| A | 18841 | 8928 | 47.386020% |
| B | 18920 | 2478 | 13.097252% |
| C | 18923 | 371 | 1.960577% |
| D | 18929 | 604 | 3.190871% |
Noise dominated data is calculated using 1-second bins in cleaned event files. If a bin has >2000 counts, and if more than 50% of those come from <1% of pixels, then it is considered to be noise-dominated and hence unusable.
| Quadrant | # 1 sec bins | Bins with >0 counts | Bins with >2000 counts | High rate bins dominated by noise | Noise dominated (total time) | Noise dominated (detector-on time) | Marked lightcurve |
|---|---|---|---|---|---|---|---|
| A | 23092 | 18958 | 8402 | 8402 | 36.38% | 44.32% | 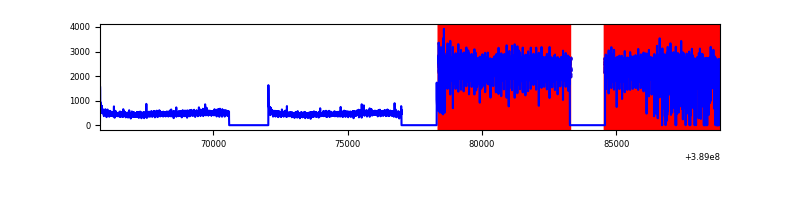 |
| B | 23092 | 18971 | 1817 | 1817 | 7.87% | 9.58% | 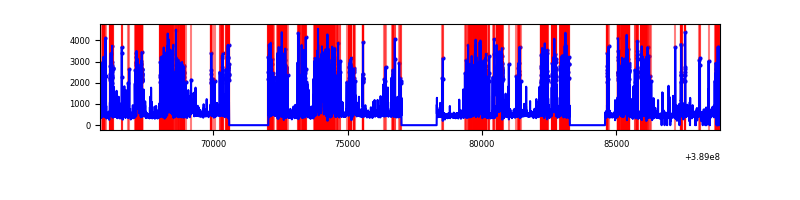 |
| C | 23092 | 18979 | 293 | 293 | 1.27% | 1.54% | 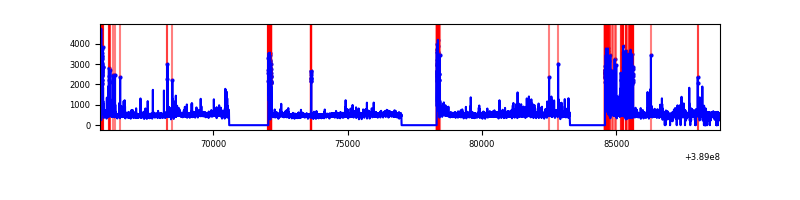 |
| D | 23092 | 18985 | 521 | 521 | 2.26% | 2.74% | 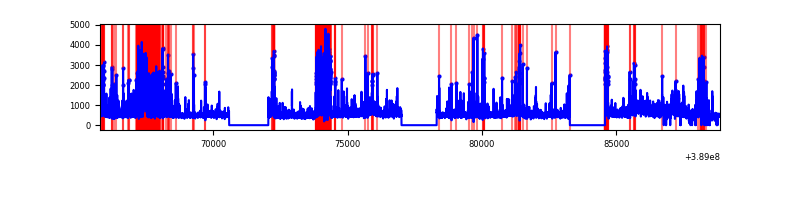 |
Top three noisy pixels from each quadrant. If the there are fewer than three noisy pixels in the level2.evt file, extra rows are filled as -1
| Pixel properties | Quadrant properties | ||||||
|---|---|---|---|---|---|---|---|
| Quadrant | DetID | PixID | Counts | Sigma | Mean | Median | Sigma |
| A | 15 | 169 | 18857400 | 52156.92 | 1813 | 1782 | 361.5 |
| A | 10 | 83 | 328471 | 903.66 | 1813 | 1782 | 361.5 |
| A | 13 | 6 | 27146 | 70.16 | 1813 | 1782 | 361.5 |
| B | 5 | 172 | 6893321 | 17722.75 | 2055 | 2000 | 388.8 |
| B | 5 | 200 | 678515 | 1739.83 | 2055 | 2000 | 388.8 |
| B | 0 | 189 | 52715 | 130.43 | 2055 | 2000 | 388.8 |
| C | 0 | 10 | 1548677 | 3175.52 | 2113 | 2134 | 487.0 |
| C | 15 | 214 | 768784 | 1574.16 | 2113 | 2134 | 487.0 |
| C | 10 | 49 | 91355 | 183.2 | 2113 | 2134 | 487.0 |
| D | 14 | 52 | 1445586 | 2800.35 | 2110 | 2054 | 515.5 |
| D | 7 | 80 | 1039265 | 2012.12 | 2110 | 2054 | 515.5 |
| D | 1 | 52 | 631698 | 1221.47 | 2110 | 2054 | 515.5 |
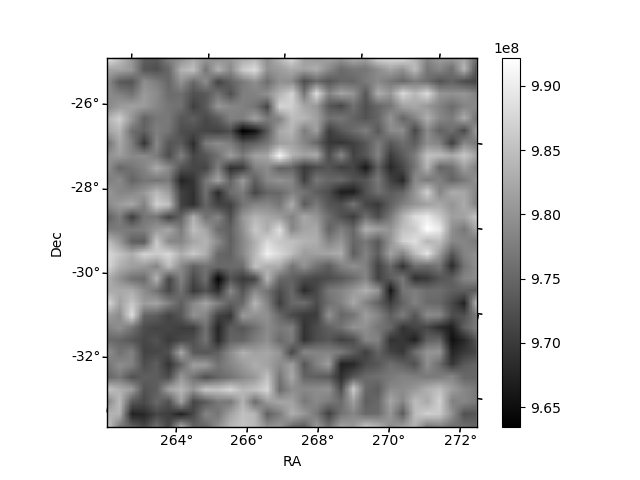
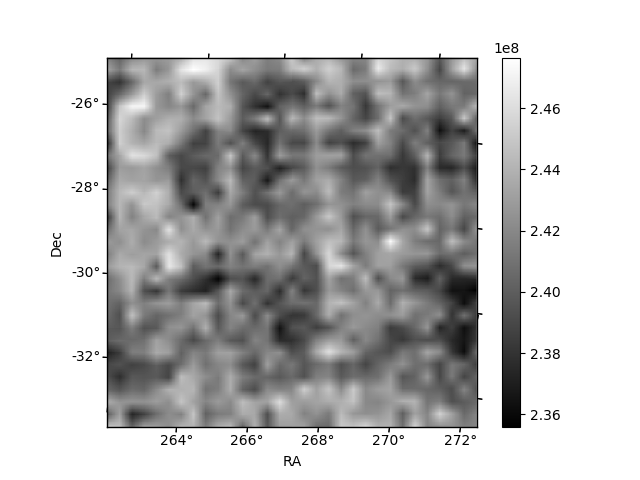
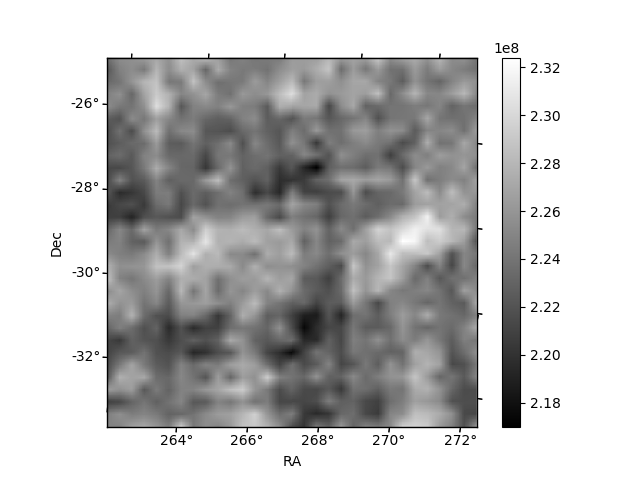
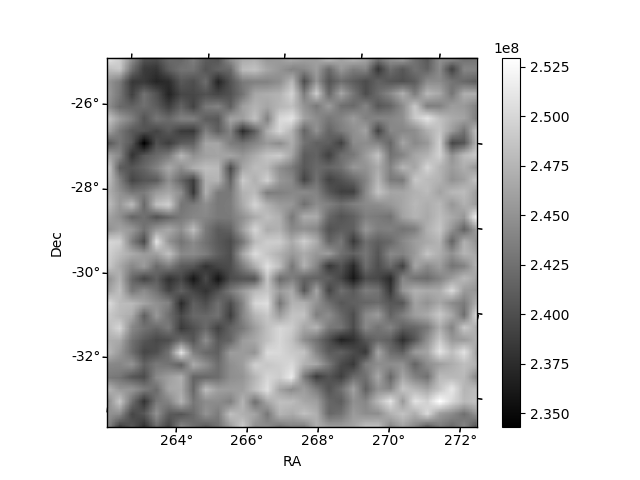
Histogram calculated using DETX and DETY for each event in the final _common_clean file
| Quadrant A | 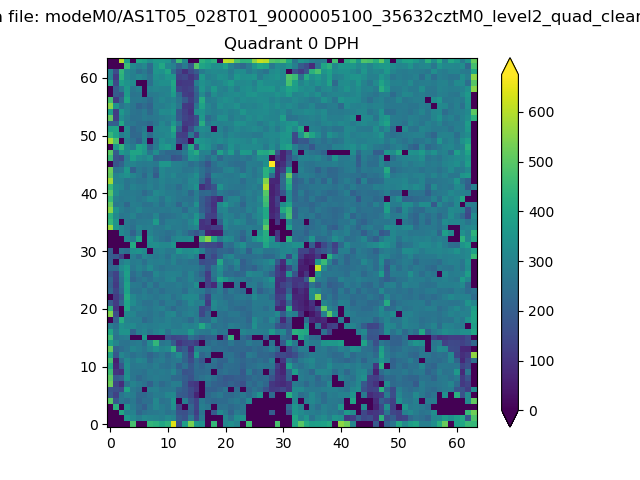 |
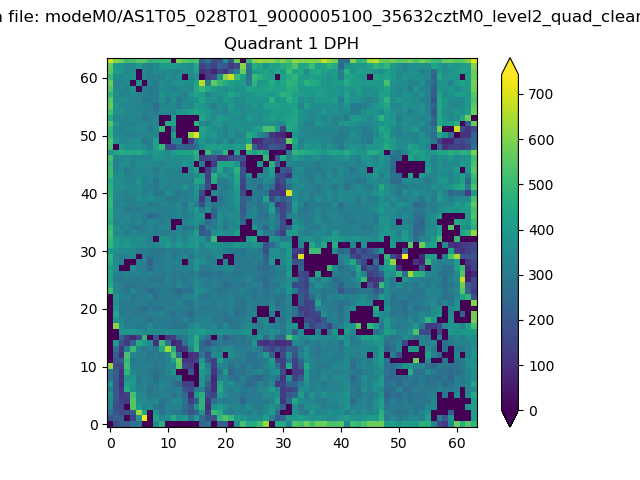 |
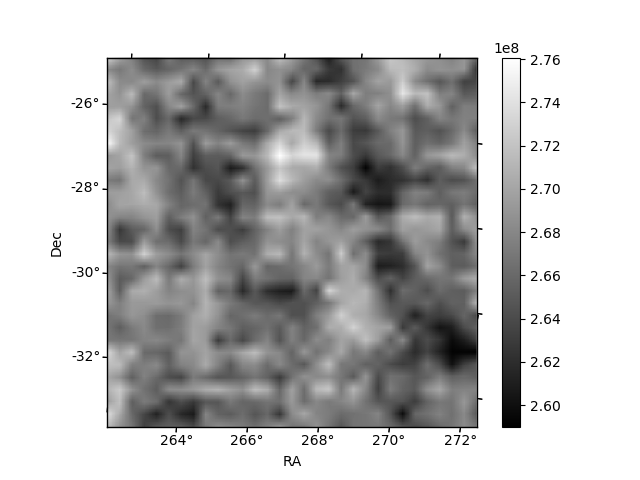
Quadrant B |
|---|---|---|---|
| Quadrant D | 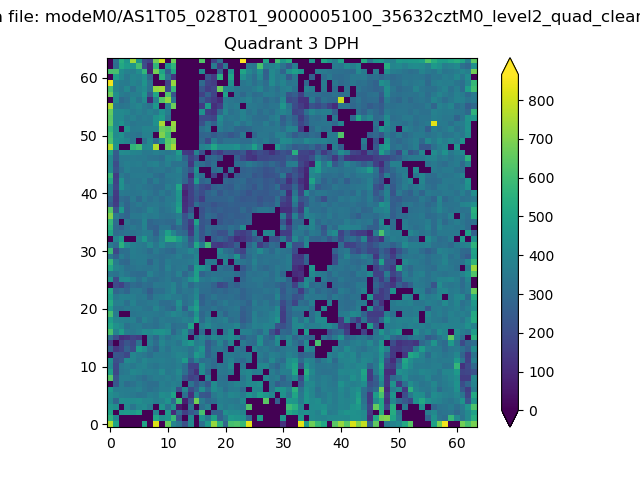 |
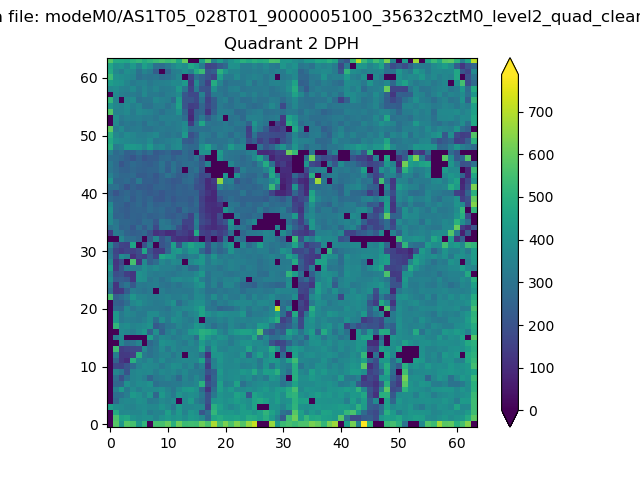 |
Quadrant C |
| Plot type | Count rate plots | Images |
|---|---|---|
| Comparison with Poisson distribution Blue bars denote a histogram of data divided into 1 sec bins. Red curve is a Poisson curve with rate = median count rate of data. |
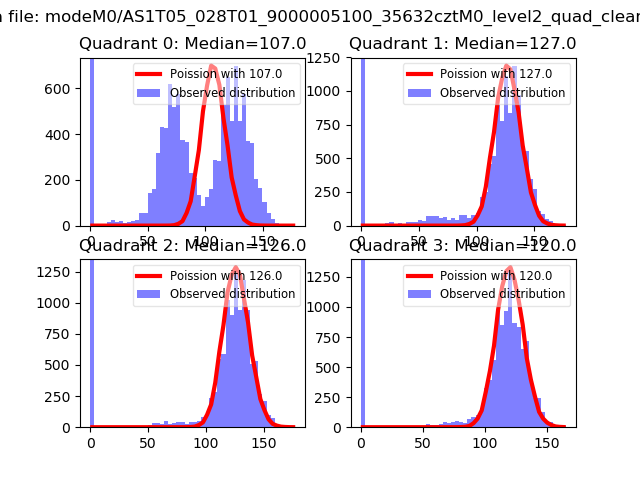 |
 |
| Quadrant-wise count rates Data is divided into 100 sec bins |
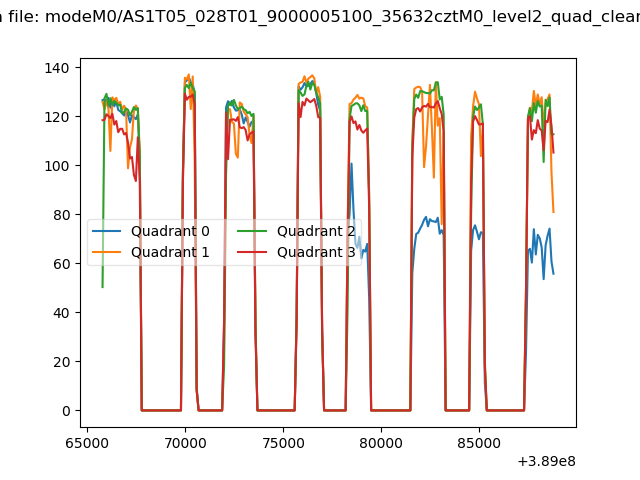 |
|
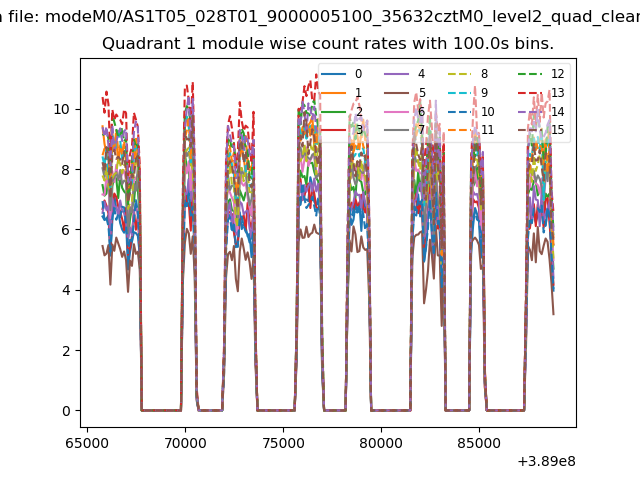
| Module-wise count rates for Quadrant A Data is divided into 100 sec bins |
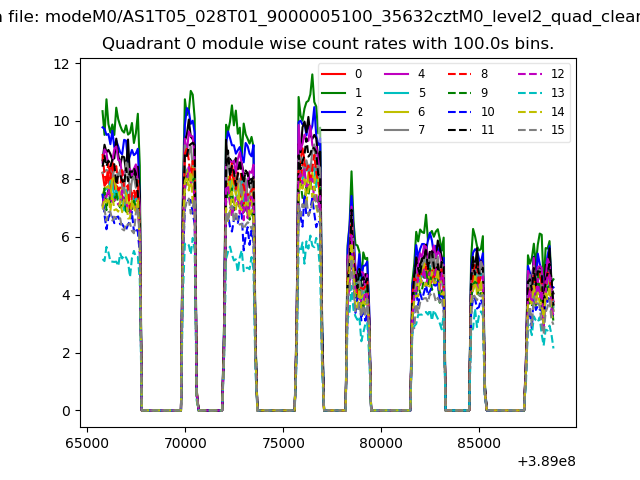 |
 |
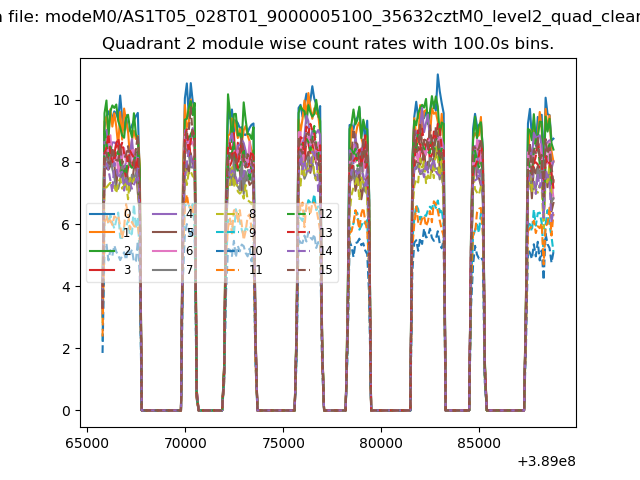
| Module-wise count rates for Quadrant B Data is divided into 100 sec bins |
 |
 |
| Module-wise count rates for Quadrant C Data is divided into 100 sec bins |
 |
 |
| Module-wise count rates for Quadrant D Data is divided into 100 sec bins |
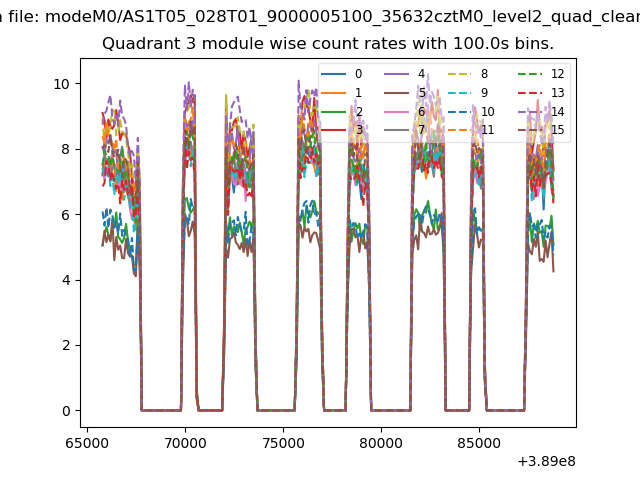 |
 |
| Parameter | Plot |
|---|---|
| CZT HV Monitor | 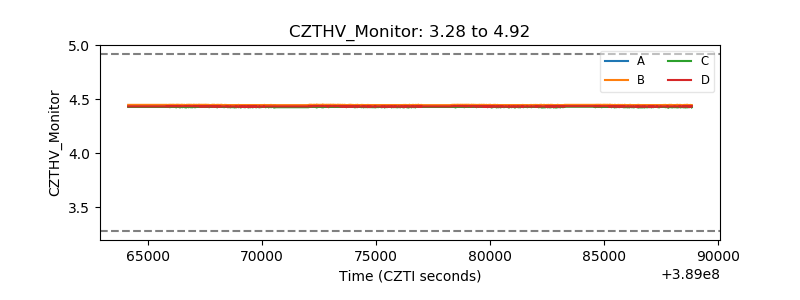 |
| D_VDD | 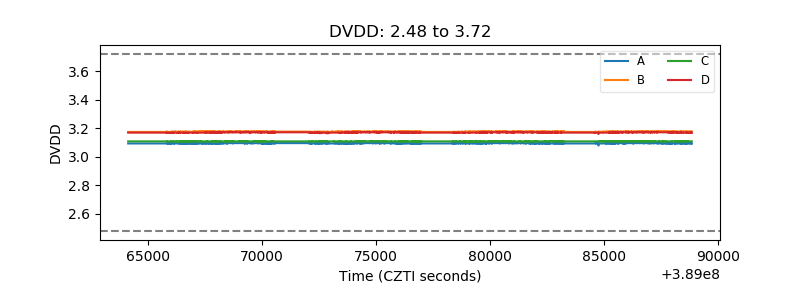 |
| Temperature 1 | 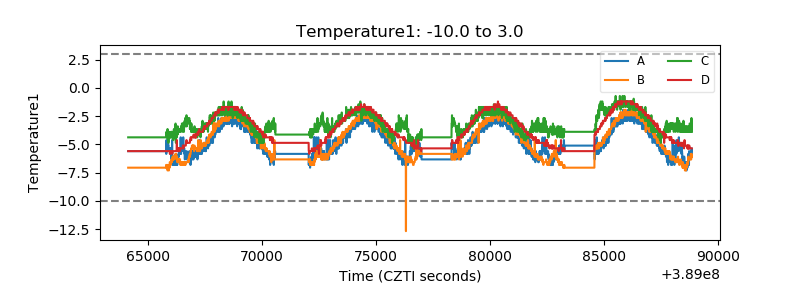 |
| Veto HV Monitor | 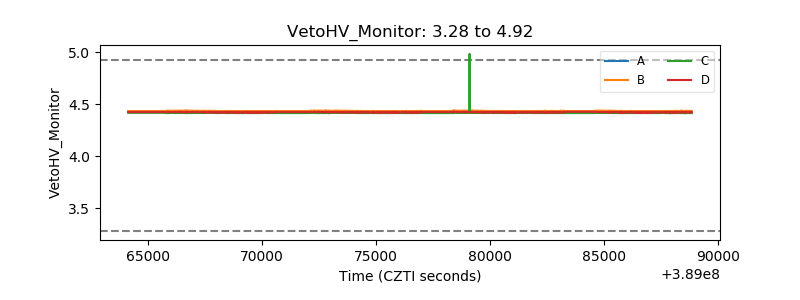 |
| Veto LLD | 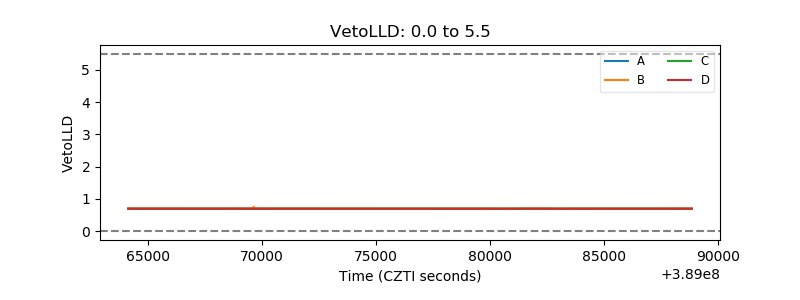 |
| Alpha Counter | 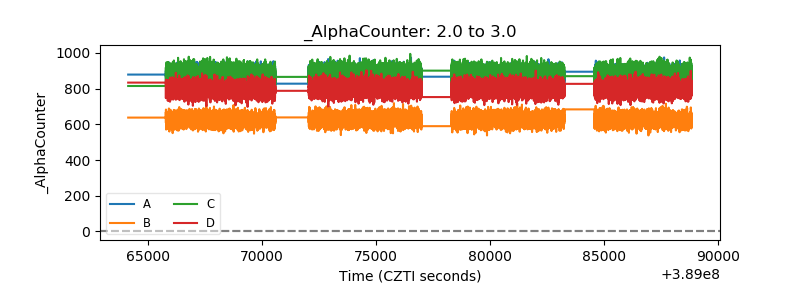 |
| _CPM_Rate | 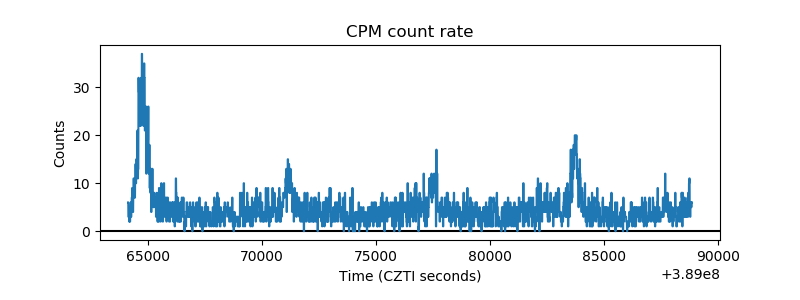 |
| CZT Counter | 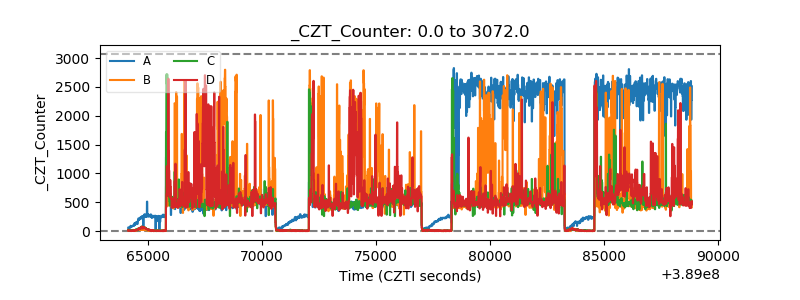 |
| +2.5 Volts monitor | 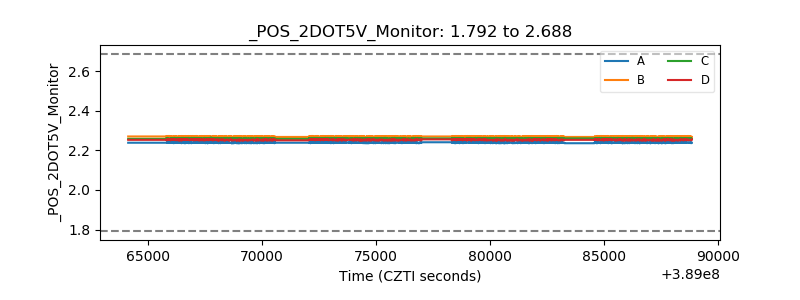 |
| +5 Volts monitor | 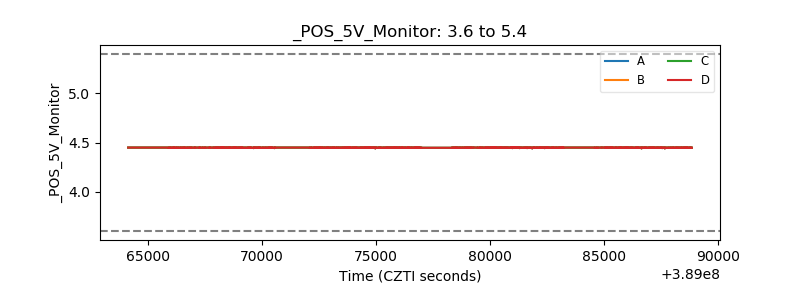 |
| _ROLL_ROT | 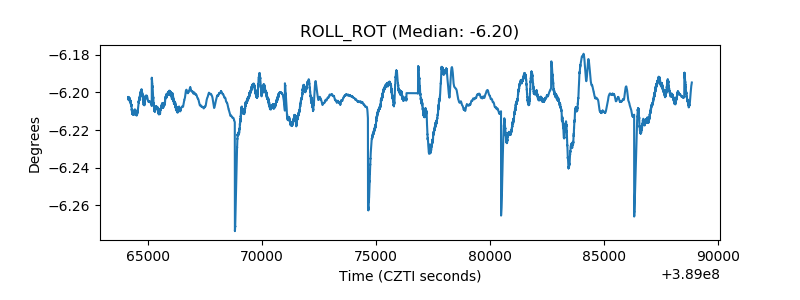 |
| _Roll_DEC | 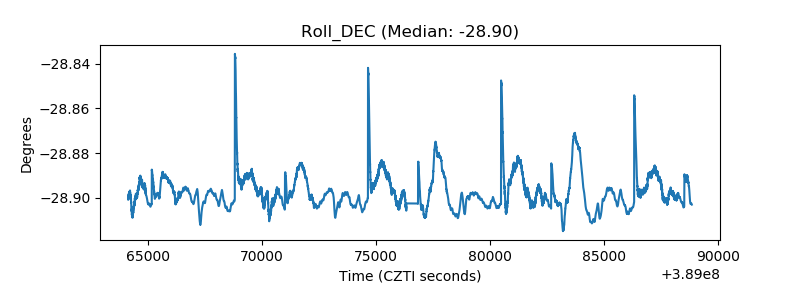 |
| _Roll_RA | 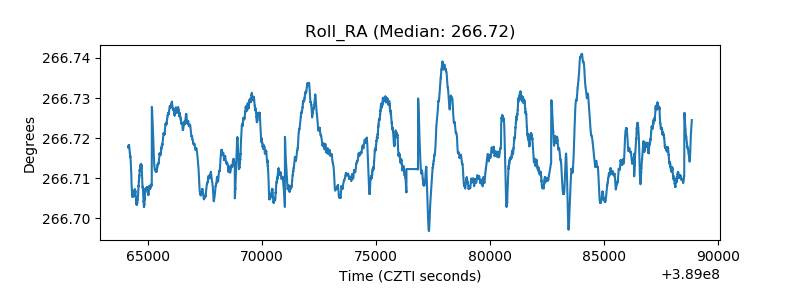 |
| Veto Counter | 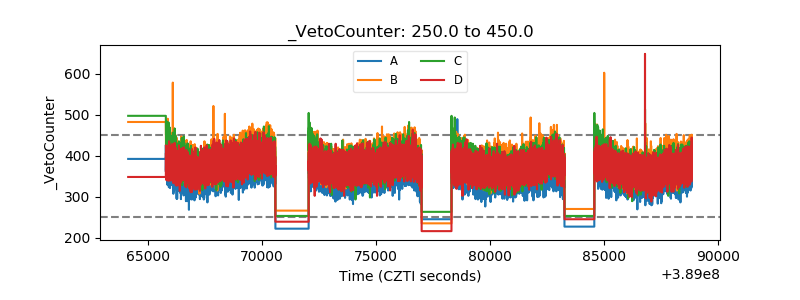 |