| Param | Original file | Final file |
|---|---|---|
| Filename | modeM0/AS1T05_028T01_9000005100_35626cztM0_level2.evt | modeM0/AS1T05_028T01_9000005100_35626cztM0_level2_quad_clean.evt |
| Size (bytes) | 454,429,440 | 73,748,160 |
| Size | 433.4 MB | 70.3 MB |
| Events in quadrant A | 3,027,069 | 470,119 |
| Events in quadrant B | 3,860,877 | 473,684 |
| Events in quadrant C | 3,269,058 | 461,909 |
| Events in quadrant D | 3,237,244 | 447,770 |
| Mode M9 | |||
|---|---|---|---|
| Quadrant | BADHDUFLAG | Total packets | Discarded packets |
| A | 0 | 42 | 0 |
| B | 0 | 42 | 0 |
| C | 0 | 42 | 0 |
| D | 0 | 42 | 0 |
| Mode M0 | |||
|---|---|---|---|
| Quadrant | BADHDUFLAG | Total packets | Discarded packets |
| A | 0 | 12578 | 3 |
| B | 0 | 15092 | 2 |
| C | 0 | 12827 | 2 |
| D | 0 | 13224 | 2 |
| Mode SS | |||
|---|---|---|---|
| Quadrant | BADHDUFLAG | Total packets | Discarded packets |
| A | 0 | 114 | 0 |
| B | 0 | 114 | 0 |
| C | 0 | 114 | 0 |
| D | 0 | 114 | 0 |
| Quadrant | Total seconds | Saturated seconds | Saturation percentage |
|---|---|---|---|
| A | 5416 | 120 | 2.215657% |
| B | 5416 | 289 | 5.336041% |
| C | 5416 | 218 | 4.025111% |
| D | 5416 | 120 | 2.215657% |
Noise dominated data is calculated using 1-second bins in cleaned event files. If a bin has >2000 counts, and if more than 50% of those come from <1% of pixels, then it is considered to be noise-dominated and hence unusable.
| Quadrant | # 1 sec bins | Bins with >0 counts | Bins with >2000 counts | High rate bins dominated by noise | Noise dominated (total time) | Noise dominated (detector-on time) | Marked lightcurve |
|---|---|---|---|---|---|---|---|
| A | 9629 | 5418 | 56 | 56 | 0.58% | 1.03% | 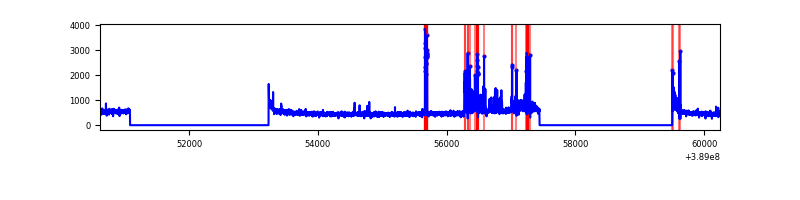 |
| B | 9629 | 5418 | 207 | 207 | 2.15% | 3.82% | 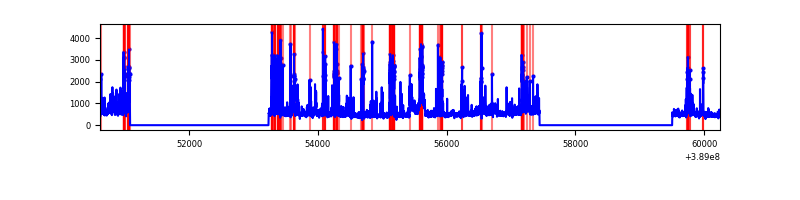 |
| C | 9629 | 5418 | 183 | 183 | 1.90% | 3.38% | 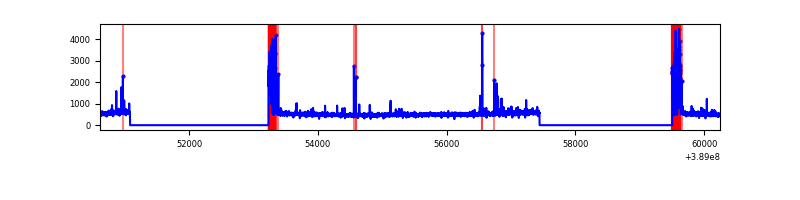 |
| D | 9629 | 5418 | 106 | 106 | 1.10% | 1.96% | 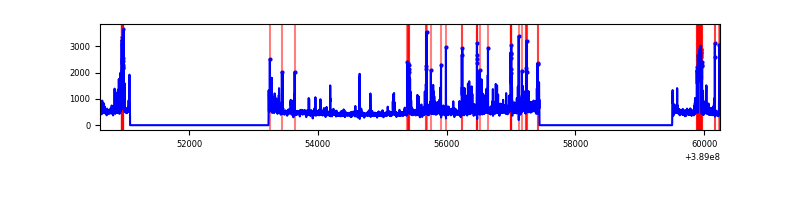 |
Top three noisy pixels from each quadrant. If the there are fewer than three noisy pixels in the level2.evt file, extra rows are filled as -1
| Pixel properties | Quadrant properties | ||||||
|---|---|---|---|---|---|---|---|
| Quadrant | DetID | PixID | Counts | Sigma | Mean | Median | Sigma |
| A | 15 | 169 | 362670 | 2846.5 | 631 | 619 | 127.2 |
| A | 10 | 83 | 139894 | 1095.0 | 631 | 619 | 127.2 |
| A | 7 | 16 | 64893 | 505.33 | 631 | 619 | 127.2 |
| B | 5 | 172 | 1169678 | 9847.22 | 627 | 611 | 118.7 |
| B | 0 | 189 | 155814 | 1307.3 | 627 | 611 | 118.7 |
| B | 0 | 245 | 28214 | 232.5 | 627 | 611 | 118.7 |
| C | 0 | 10 | 625019 | 4377.65 | 618 | 623 | 142.6 |
| C | 15 | 214 | 218277 | 1525.98 | 618 | 623 | 142.6 |
| C | 14 | 67 | 10574 | 69.77 | 618 | 623 | 142.6 |
| D | 1 | 52 | 180077 | 1176.55 | 624 | 607 | 152.5 |
| D | 13 | 249 | 85316 | 555.33 | 624 | 607 | 152.5 |
| D | 2 | 31 | 83149 | 541.12 | 624 | 607 | 152.5 |
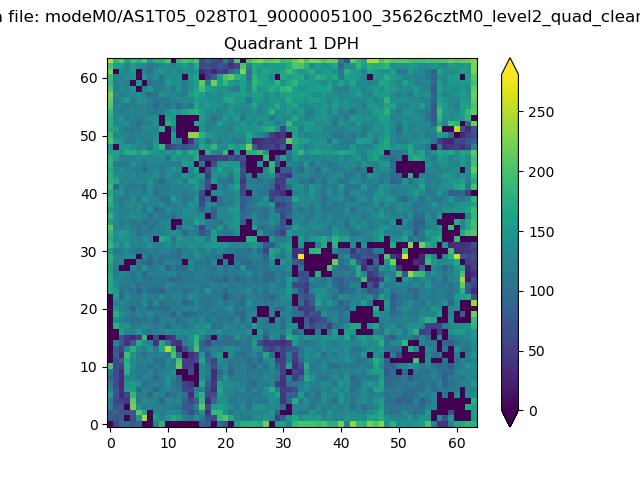
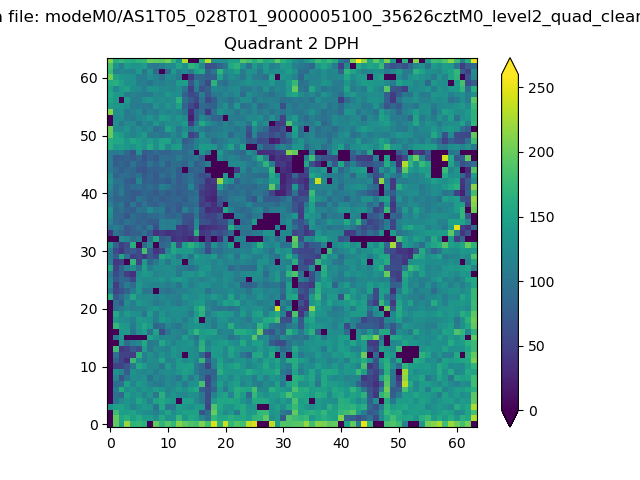
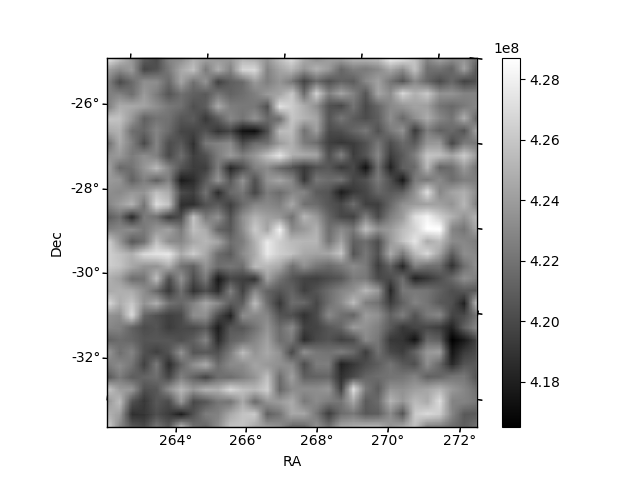
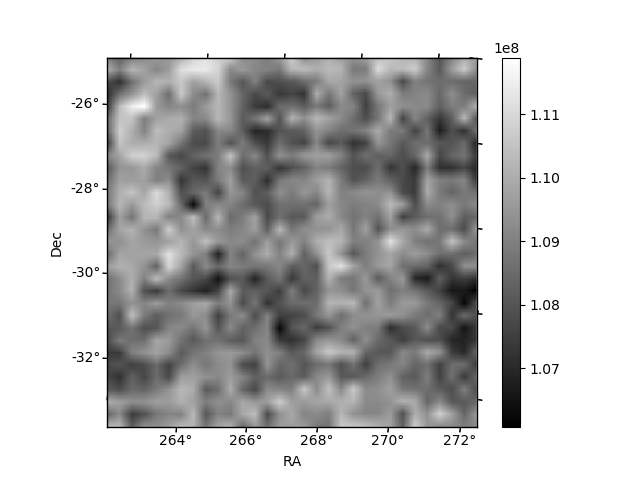
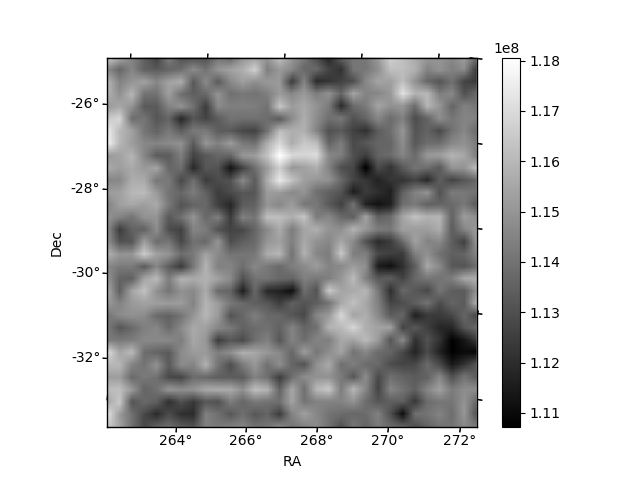
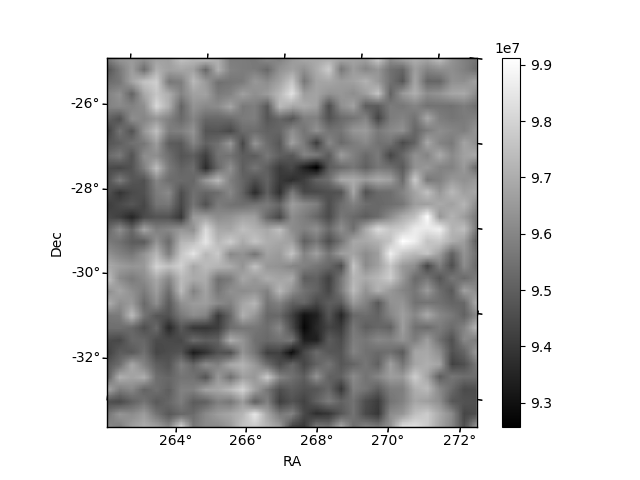
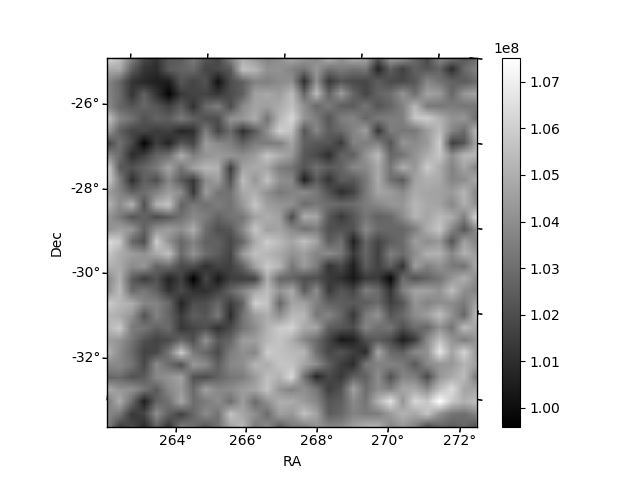
Histogram calculated using DETX and DETY for each event in the final _common_clean file
| Quadrant A |  |
 |
Quadrant B |
|---|---|---|---|
| Quadrant D | 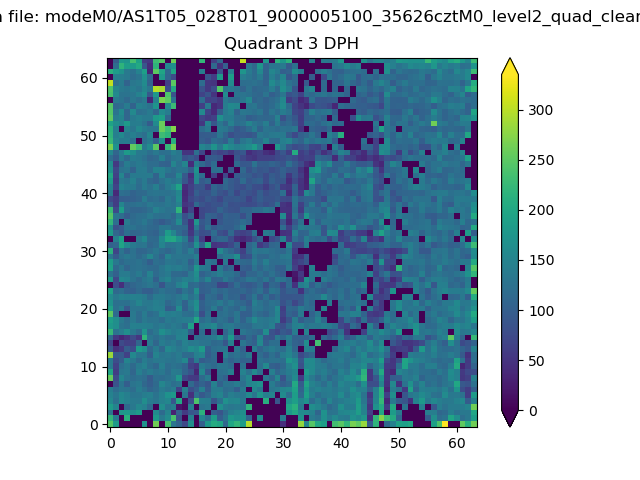 |
 |
Quadrant C |
| Plot type | Count rate plots | Images |
|---|---|---|
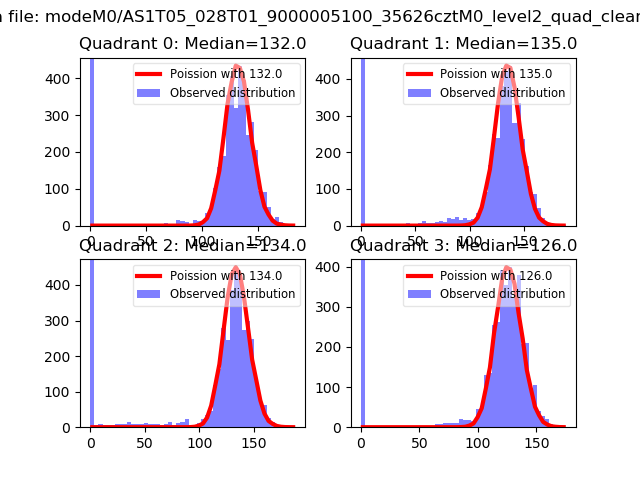
| Comparison with Poisson distribution Blue bars denote a histogram of data divided into 1 sec bins. Red curve is a Poisson curve with rate = median count rate of data. |
 |
 |
| Quadrant-wise count rates Data is divided into 100 sec bins |
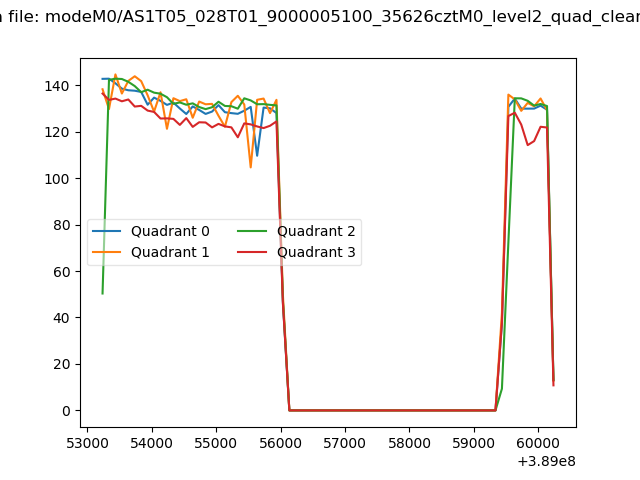 |
|
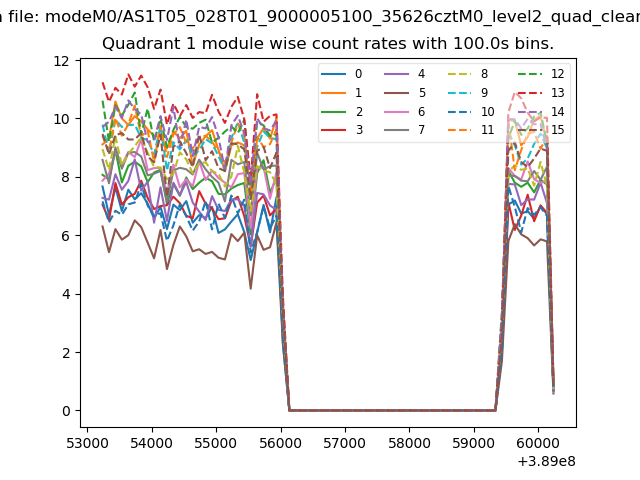
| Module-wise count rates for Quadrant A Data is divided into 100 sec bins |
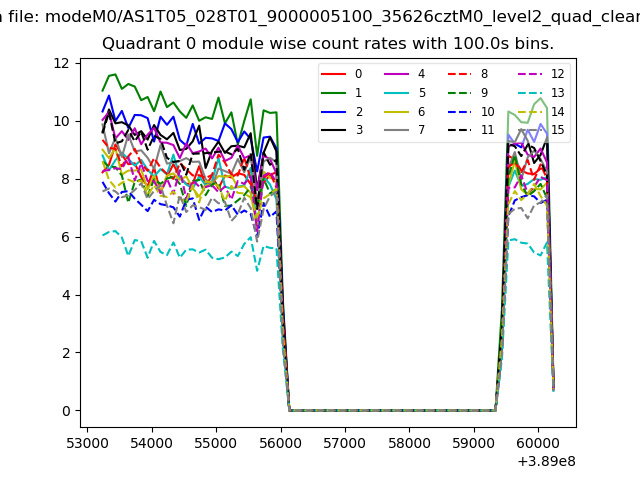 |
 |
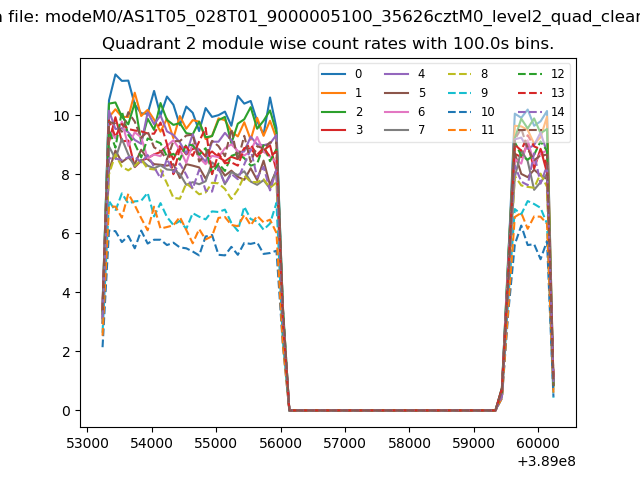
| Module-wise count rates for Quadrant B Data is divided into 100 sec bins |
 |
 |
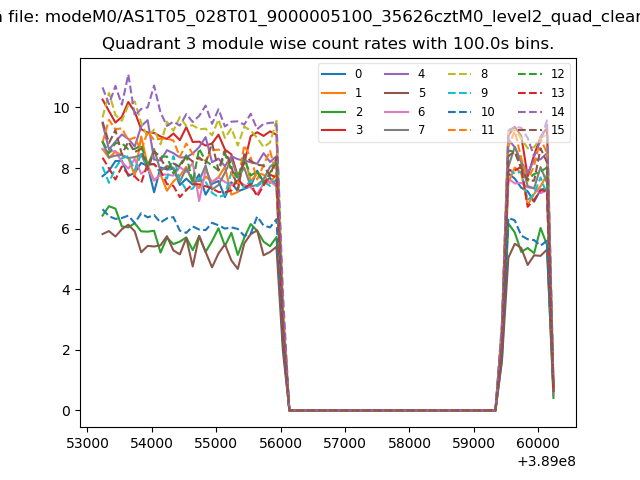
| Module-wise count rates for Quadrant C Data is divided into 100 sec bins |
 |
 |
| Module-wise count rates for Quadrant D Data is divided into 100 sec bins |
 |
 |
| Parameter | Plot |
|---|---|
| CZT HV Monitor |  |
| D_VDD | 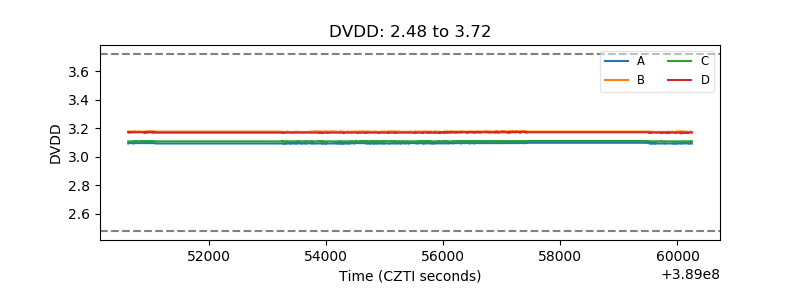 |
| Temperature 1 | 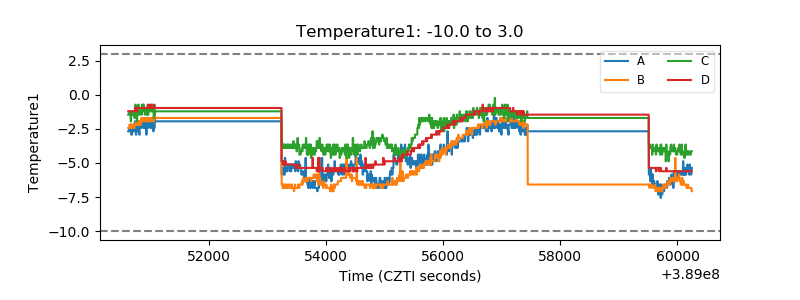 |
| Veto HV Monitor | 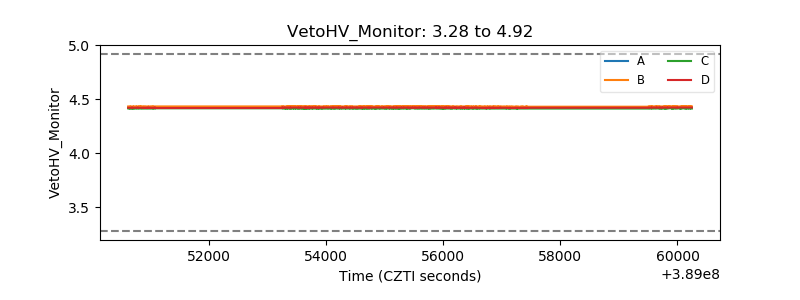 |
| Veto LLD | 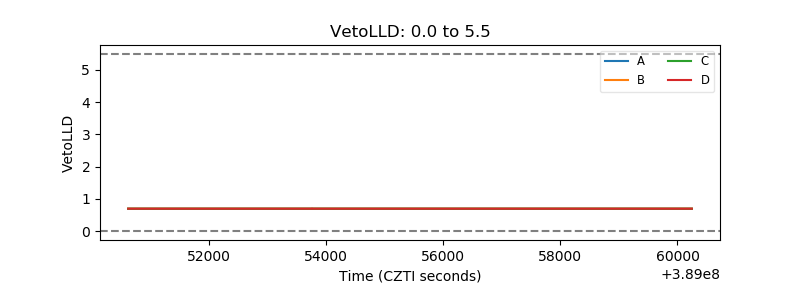 |
| Alpha Counter | 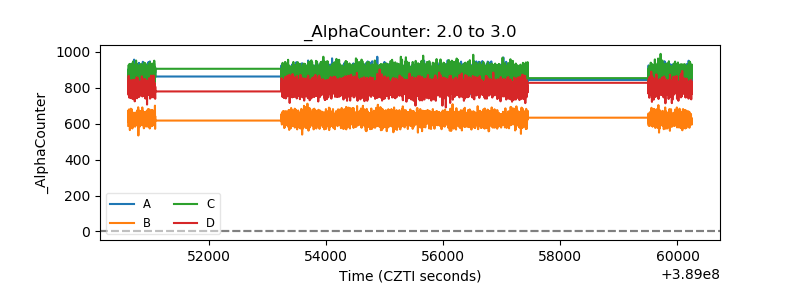 |
| _CPM_Rate | 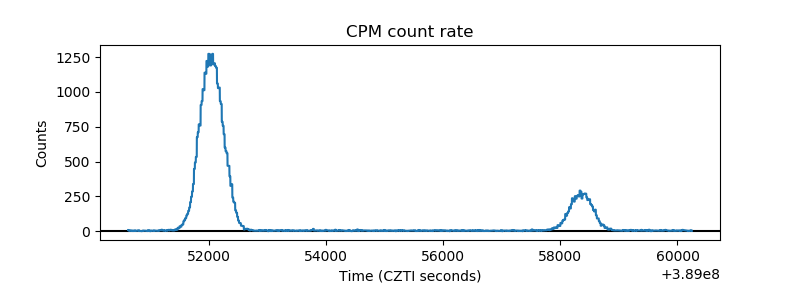 |
| CZT Counter | 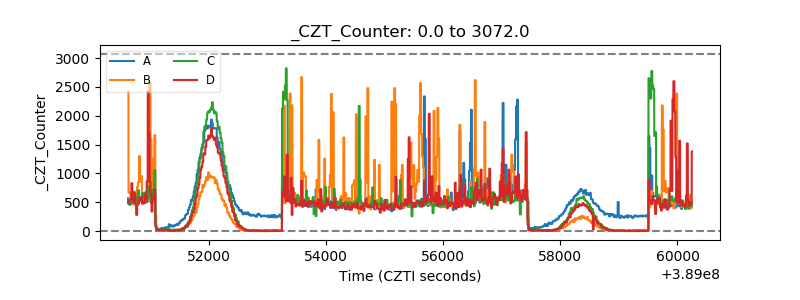 |
| +2.5 Volts monitor | 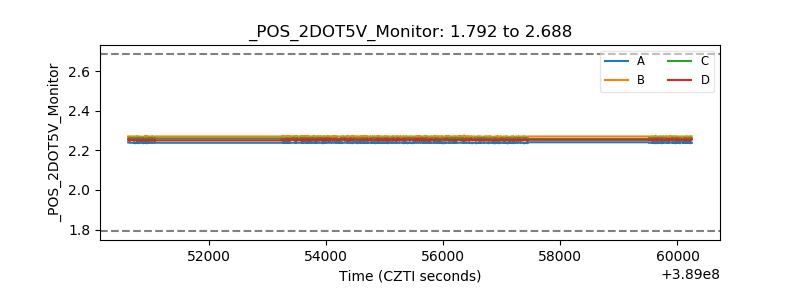 |
| +5 Volts monitor | 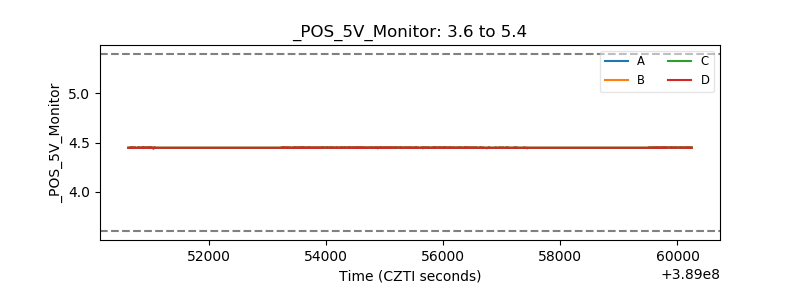 |
| _ROLL_ROT | 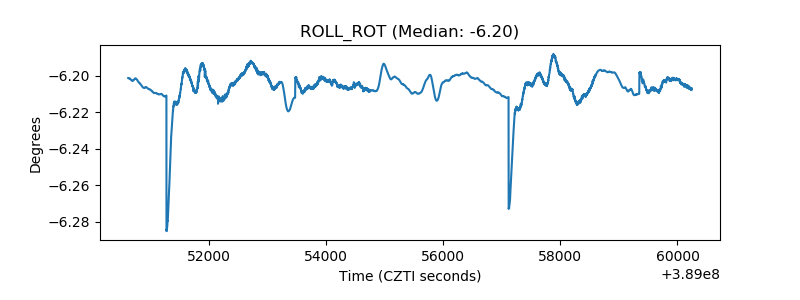 |
| _Roll_DEC | 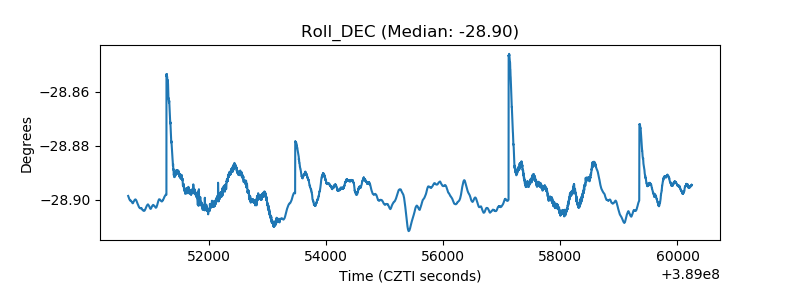 |
| _Roll_RA | 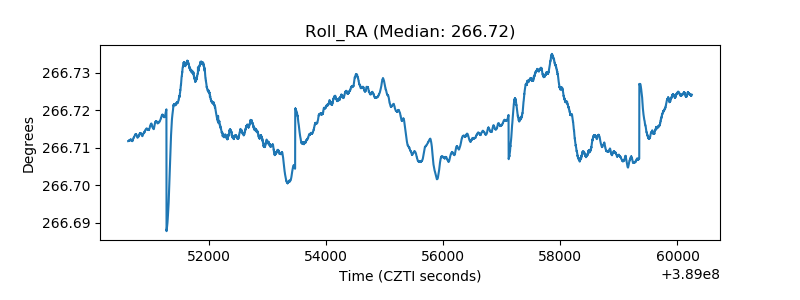 |
| Veto Counter | 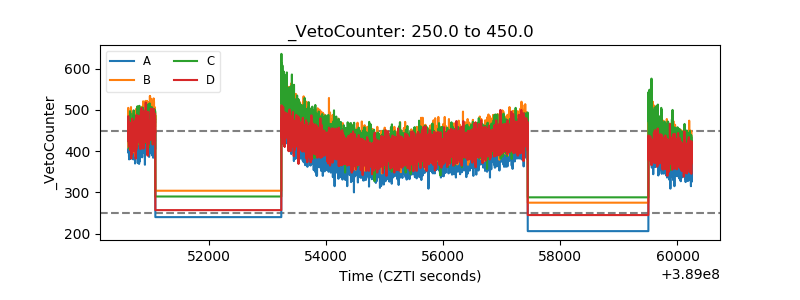 |