| Param | Original file | Final file |
|---|---|---|
| Filename | modeM0/AS1T05_028T01_9000005100_35619cztM0_level2.evt | modeM0/AS1T05_028T01_9000005100_35619cztM0_level2_quad_clean.evt |
| Size (bytes) | 489,663,360 | 60,376,320 |
| Size | 467.0 MB | 57.6 MB |
| Events in quadrant A | 3,387,643 | 363,590 |
| Events in quadrant B | 3,795,100 | 365,472 |
| Events in quadrant C | 4,013,659 | 361,254 |
| Events in quadrant D | 3,258,167 | 350,673 |
| Mode M9 | |||
|---|---|---|---|
| Quadrant | BADHDUFLAG | Total packets | Discarded packets |
| A | 0 | 27 | 0 |
| B | 0 | 27 | 0 |
| C | 0 | 27 | 0 |
| D | 0 | 28 | 0 |
| Mode M0 | |||
|---|---|---|---|
| Quadrant | BADHDUFLAG | Total packets | Discarded packets |
| A | 0 | 13699 | 3 |
| B | 0 | 14917 | 2 |
| C | 0 | 15378 | 2 |
| D | 0 | 13292 | 2 |
| Mode SS | |||
|---|---|---|---|
| Quadrant | BADHDUFLAG | Total packets | Discarded packets |
| A | 0 | 112 | 0 |
| B | 0 | 112 | 0 |
| C | 0 | 112 | 0 |
| D | 0 | 112 | 0 |
| Quadrant | Total seconds | Saturated seconds | Saturation percentage |
|---|---|---|---|
| A | 5531 | 71 | 1.283674% |
| B | 5531 | 245 | 4.429579% |
| C | 5531 | 315 | 5.695173% |
| D | 5531 | 108 | 1.952631% |
Noise dominated data is calculated using 1-second bins in cleaned event files. If a bin has >2000 counts, and if more than 50% of those come from <1% of pixels, then it is considered to be noise-dominated and hence unusable.
| Quadrant | # 1 sec bins | Bins with >0 counts | Bins with >2000 counts | High rate bins dominated by noise | Noise dominated (total time) | Noise dominated (detector-on time) | Marked lightcurve |
|---|---|---|---|---|---|---|---|
| A | 7202 | 5532 | 42 | 42 | 0.58% | 0.76% | 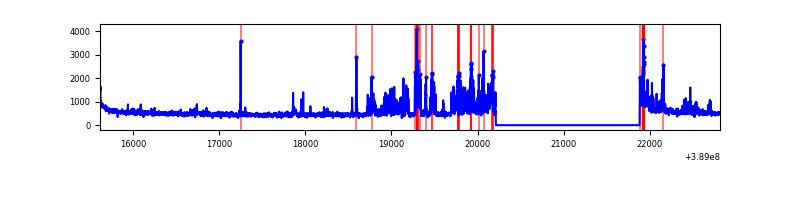 |
| B | 7202 | 5532 | 156 | 156 | 2.17% | 2.82% | 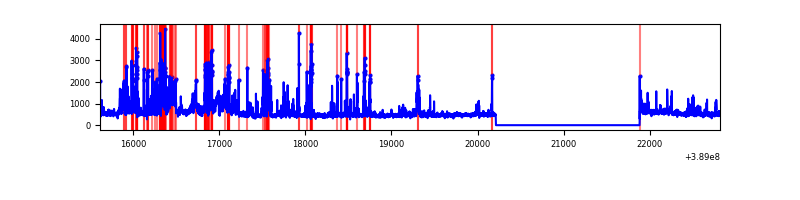 |
| C | 7202 | 5532 | 250 | 250 | 3.47% | 4.52% | 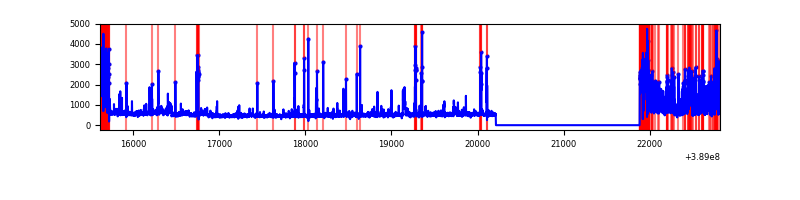 |
| D | 7202 | 5532 | 68 | 68 | 0.94% | 1.23% | 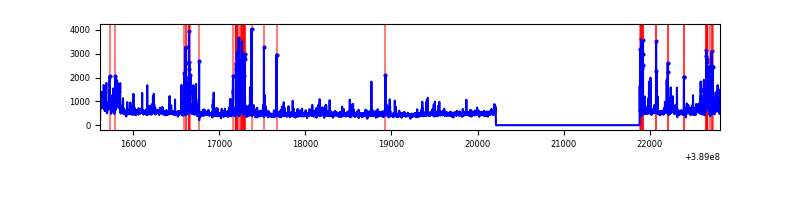 |
Top three noisy pixels from each quadrant. If the there are fewer than three noisy pixels in the level2.evt file, extra rows are filled as -1
| Pixel properties | Quadrant properties | ||||||
|---|---|---|---|---|---|---|---|
| Quadrant | DetID | PixID | Counts | Sigma | Mean | Median | Sigma |
| A | 7 | 16 | 694713 | 5323.21 | 641 | 628 | 130.4 |
| A | 10 | 83 | 147826 | 1128.92 | 641 | 628 | 130.4 |
| A | 15 | 169 | 43741 | 330.65 | 641 | 628 | 130.4 |
| B | 5 | 172 | 1084162 | 8871.64 | 633 | 614 | 122.1 |
| B | 15 | 85 | 70160 | 569.41 | 633 | 614 | 122.1 |
| B | 0 | 189 | 65617 | 532.21 | 633 | 614 | 122.1 |
| C | 0 | 10 | 1086494 | 7624.58 | 611 | 614 | 142.4 |
| C | 9 | 187 | 237657 | 1664.41 | 611 | 614 | 142.4 |
| C | 15 | 214 | 224395 | 1571.29 | 611 | 614 | 142.4 |
| D | 7 | 80 | 268019 | 1771.18 | 623 | 607 | 151.0 |
| D | 10 | 118 | 197383 | 1303.33 | 623 | 607 | 151.0 |
| D | 8 | 195 | 141606 | 933.9 | 623 | 607 | 151.0 |
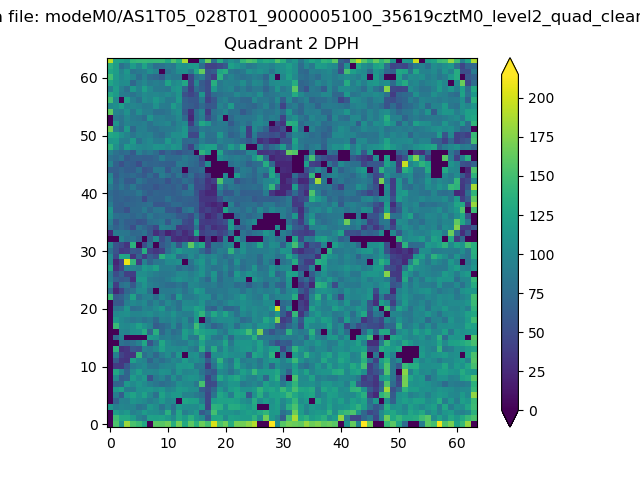
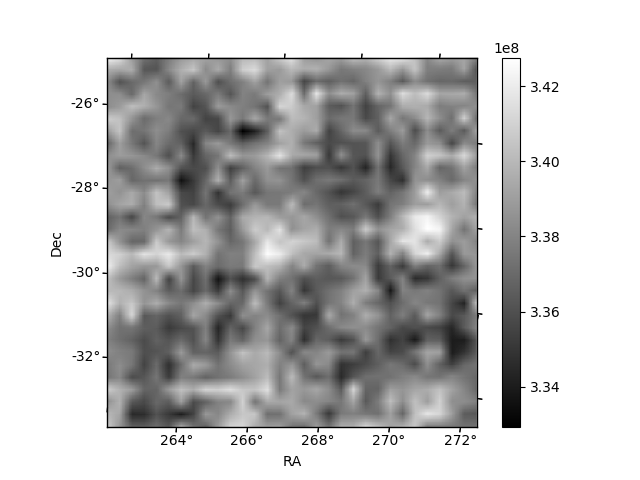
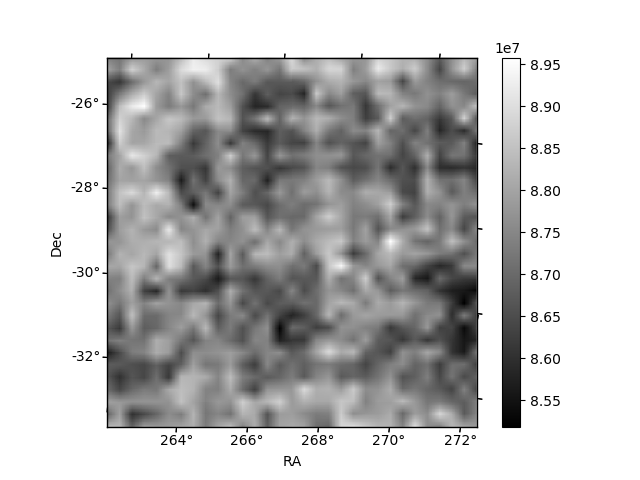
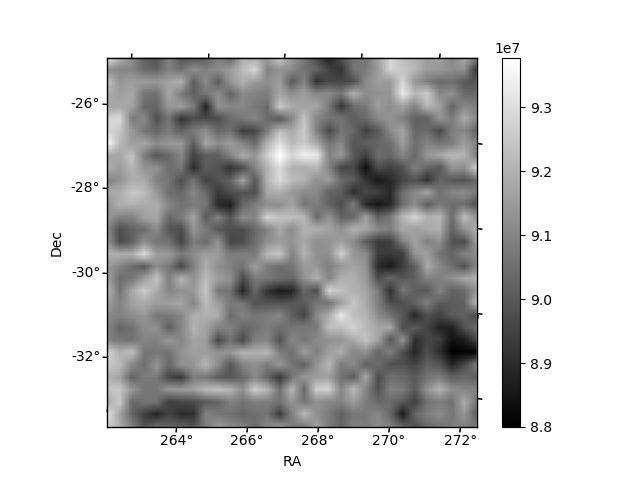
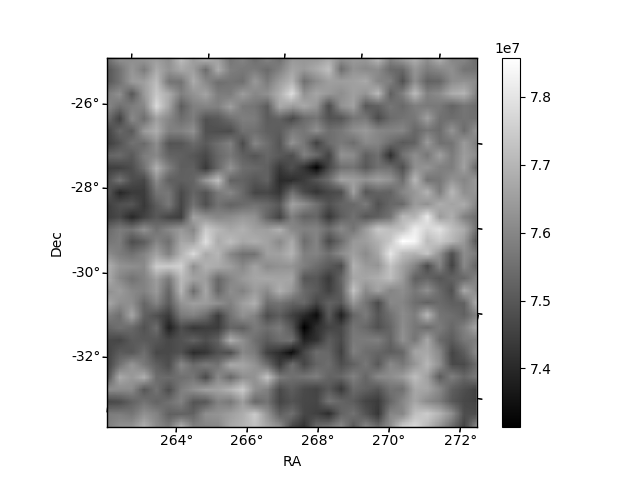
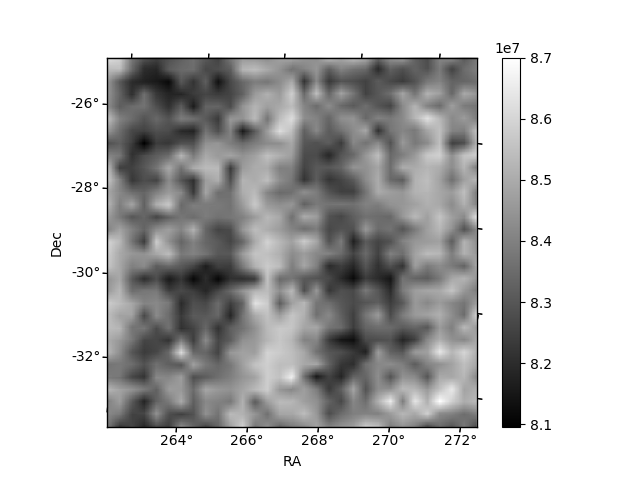
Histogram calculated using DETX and DETY for each event in the final _common_clean file
| Quadrant A | 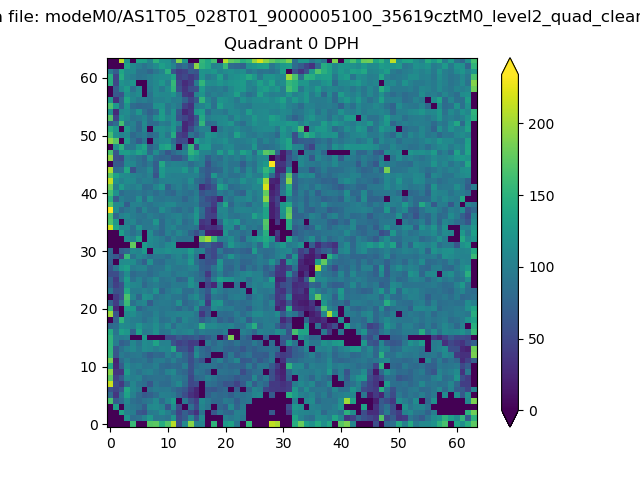 |
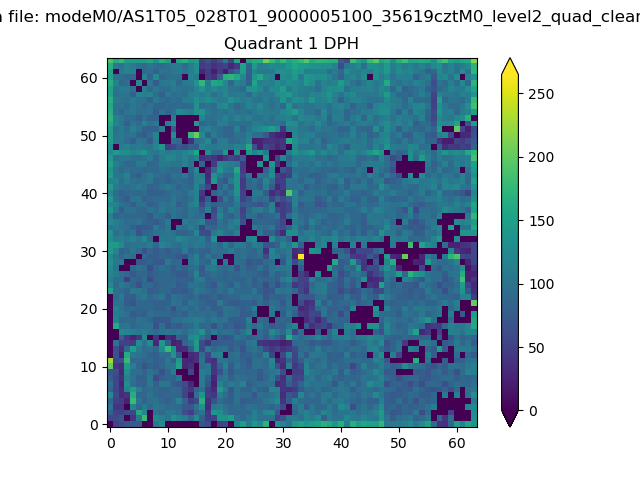 |
Quadrant B |
|---|---|---|---|
| Quadrant D | 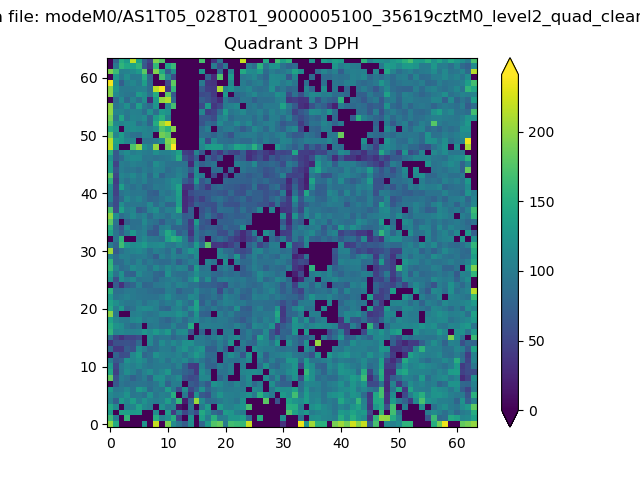 |
 |
Quadrant C |
| Plot type | Count rate plots | Images |
|---|---|---|
| Comparison with Poisson distribution Blue bars denote a histogram of data divided into 1 sec bins. Red curve is a Poisson curve with rate = median count rate of data. |
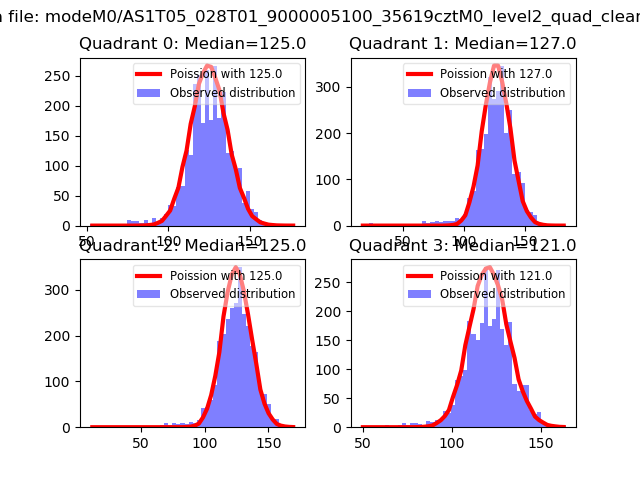 |
 |
| Quadrant-wise count rates Data is divided into 100 sec bins |
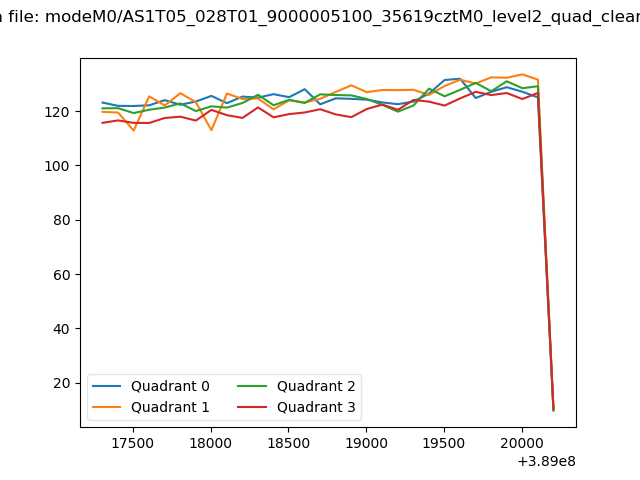 |
|
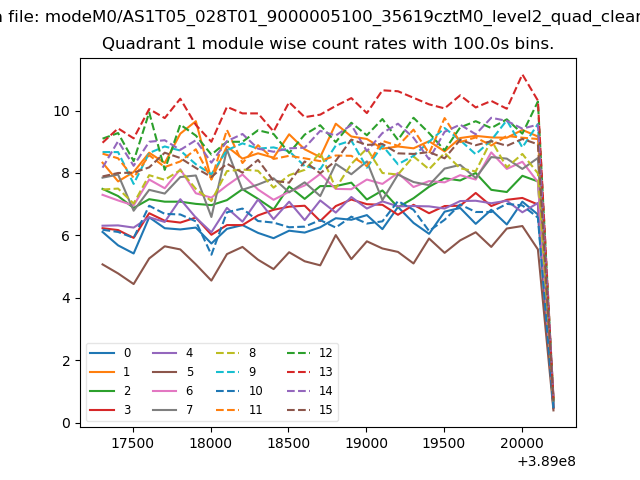
| Module-wise count rates for Quadrant A Data is divided into 100 sec bins |
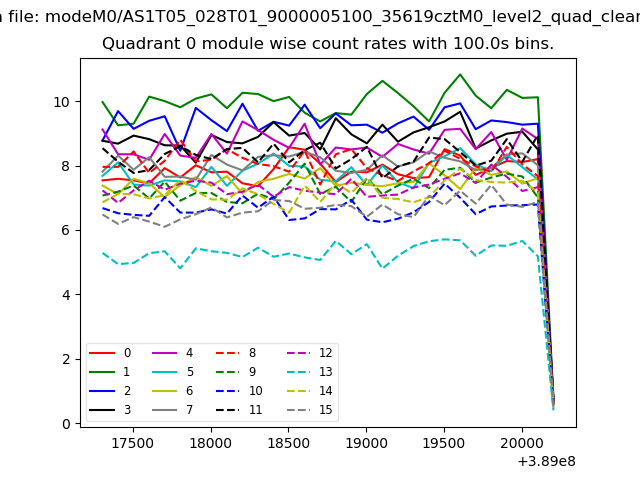 |
 |
| Module-wise count rates for Quadrant B Data is divided into 100 sec bins |
 |
 |
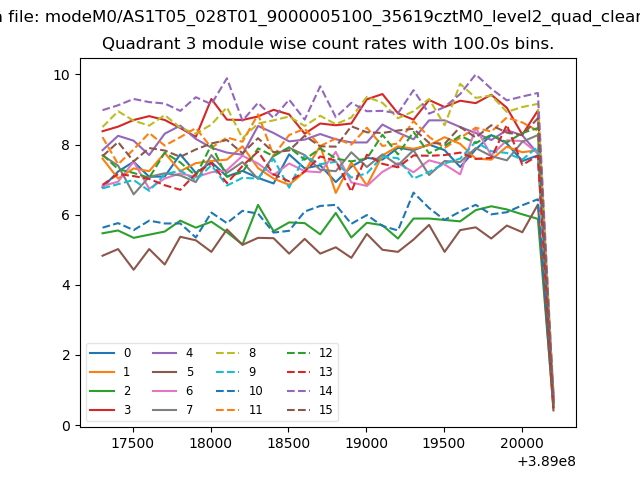
| Module-wise count rates for Quadrant C Data is divided into 100 sec bins |
 |
 |
| Module-wise count rates for Quadrant D Data is divided into 100 sec bins |
 |
 |
| Parameter | Plot |
|---|---|
| CZT HV Monitor | 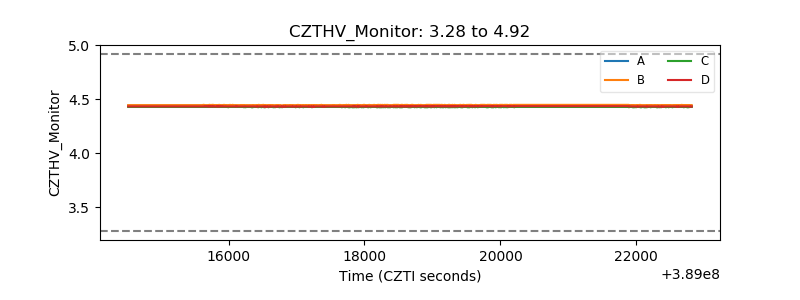 |
| D_VDD | 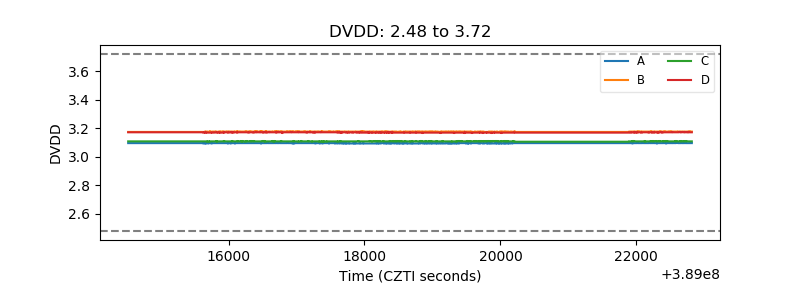 |
| Temperature 1 | 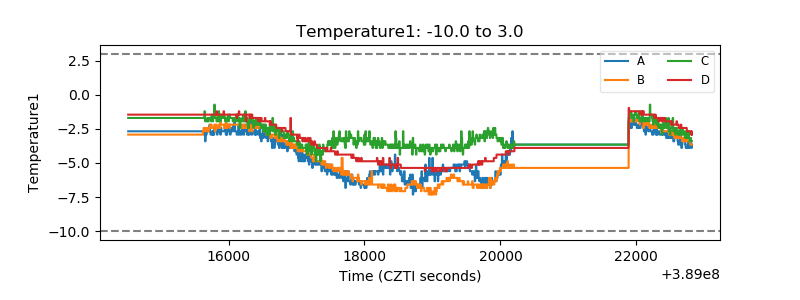 |
| Veto HV Monitor | 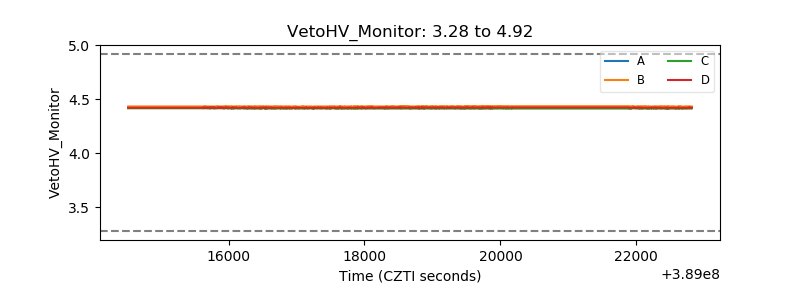 |
| Veto LLD | 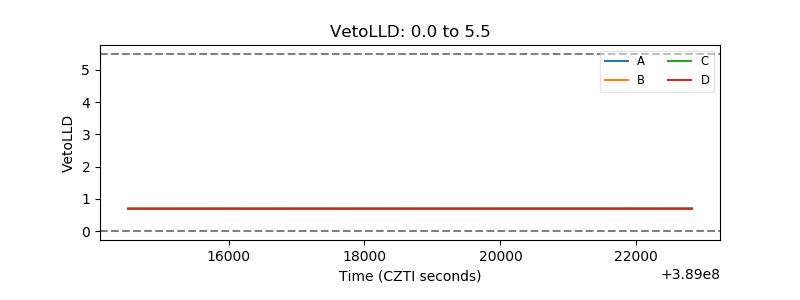 |
| Alpha Counter | 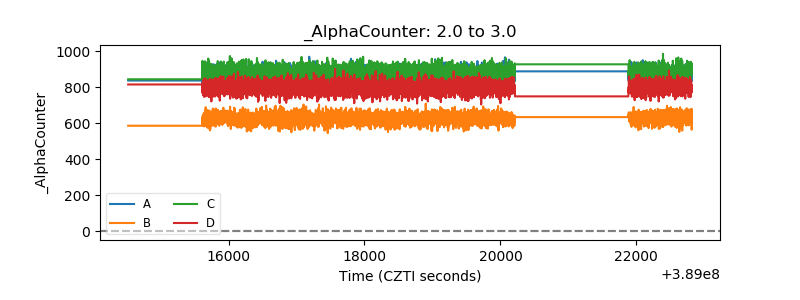 |
| _CPM_Rate | 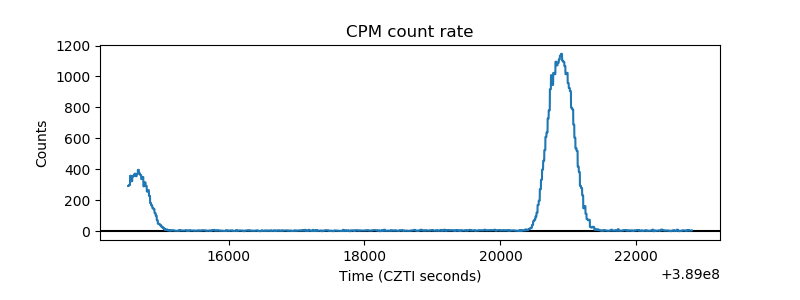 |
| CZT Counter | 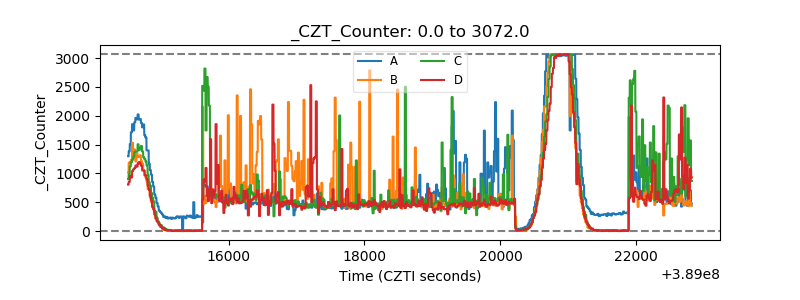 |
| +2.5 Volts monitor | 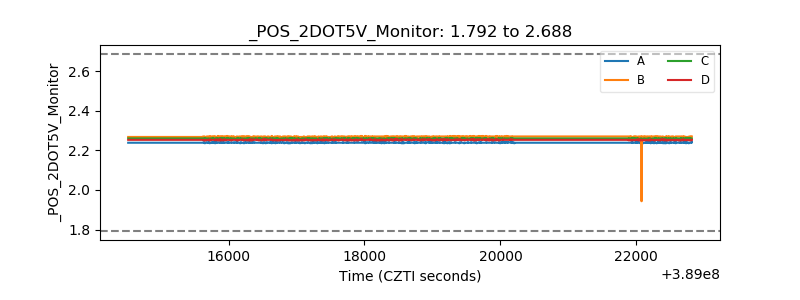 |
| +5 Volts monitor | 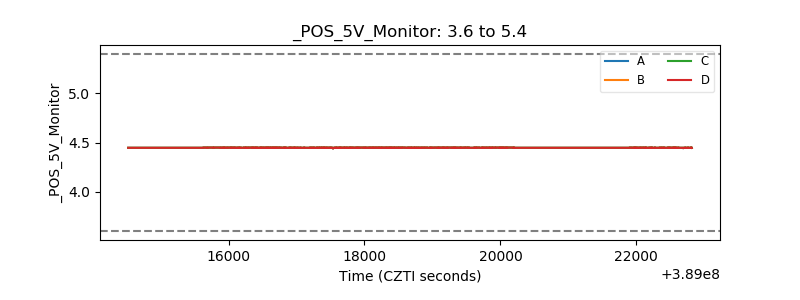 |
| _ROLL_ROT | 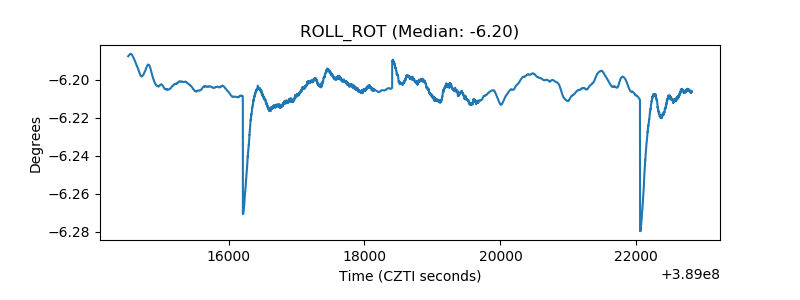 |
| _Roll_DEC | 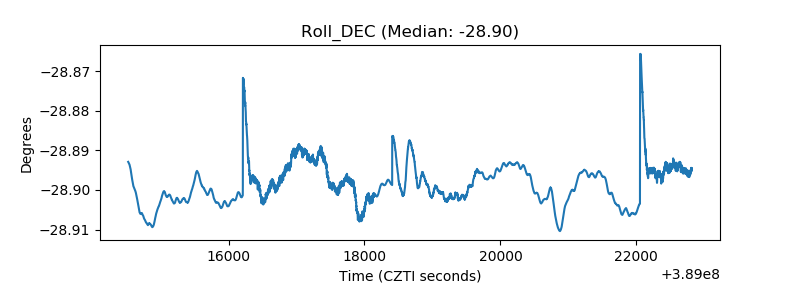 |
| _Roll_RA | 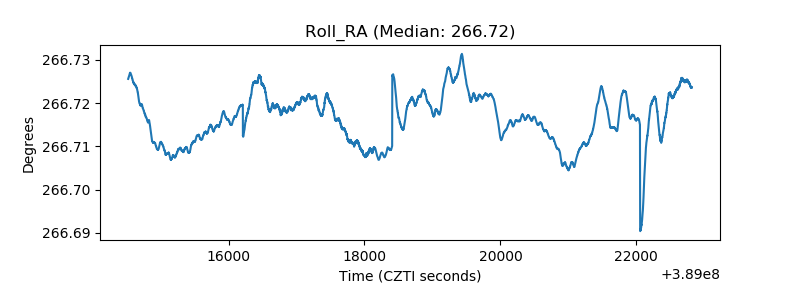 |
| Veto Counter | 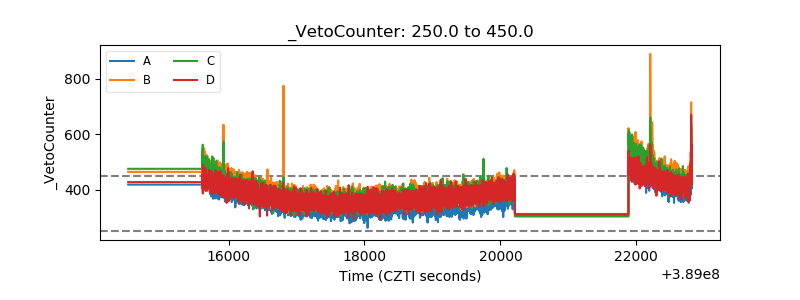 |