| Param | Original file | Final file |
|---|---|---|
| Filename | modeM0/AS1T05_028T01_9000005100_35618cztM0_level2.evt | modeM0/AS1T05_028T01_9000005100_35618cztM0_level2_quad_clean.evt |
| Size (bytes) | 898,580,160 | 112,259,520 |
| Size | 857.0 MB | 107.1 MB |
| Events in quadrant A | 5,031,893 | 679,206 |
| Events in quadrant B | 7,634,426 | 671,098 |
| Events in quadrant C | 6,710,282 | 668,500 |
| Events in quadrant D | 7,116,851 | 642,849 |
| Mode M9 | |||
|---|---|---|---|
| Quadrant | BADHDUFLAG | Total packets | Discarded packets |
| A | 0 | 31 | 0 |
| B | 0 | 31 | 0 |
| C | 0 | 31 | 0 |
| D | 0 | 31 | 0 |
| Mode M0 | |||
|---|---|---|---|
| Quadrant | BADHDUFLAG | Total packets | Discarded packets |
| A | 0 | 21823 | 4 |
| B | 0 | 29622 | 3 |
| C | 0 | 26417 | 3 |
| D | 0 | 27994 | 3 |
| Mode SS | |||
|---|---|---|---|
| Quadrant | BADHDUFLAG | Total packets | Discarded packets |
| A | 0 | 218 | 0 |
| B | 0 | 218 | 0 |
| C | 0 | 218 | 0 |
| D | 0 | 218 | 0 |
| Quadrant | Total seconds | Saturated seconds | Saturation percentage |
|---|---|---|---|
| A | 10652 | 10 | 0.093879% |
| B | 10652 | 826 | 7.754412% |
| C | 10652 | 278 | 2.609839% |
| D | 10652 | 419 | 3.933534% |
Noise dominated data is calculated using 1-second bins in cleaned event files. If a bin has >2000 counts, and if more than 50% of those come from <1% of pixels, then it is considered to be noise-dominated and hence unusable.
| Quadrant | # 1 sec bins | Bins with >0 counts | Bins with >2000 counts | High rate bins dominated by noise | Noise dominated (total time) | Noise dominated (detector-on time) | Marked lightcurve |
|---|---|---|---|---|---|---|---|
| A | 13575 | 10654 | 0 | 0 | 0.00% | 0.00% | 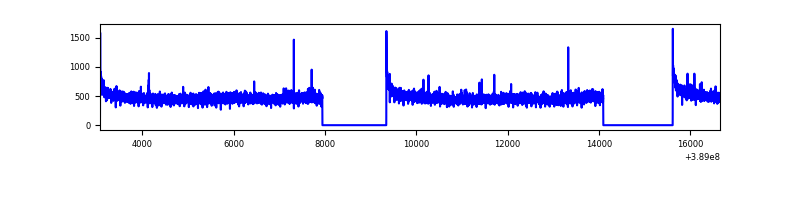 |
| B | 13575 | 10654 | 549 | 549 | 4.04% | 5.15% | 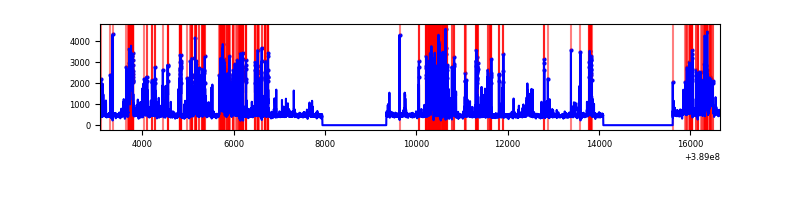 |
| C | 13575 | 10654 | 203 | 203 | 1.50% | 1.91% | 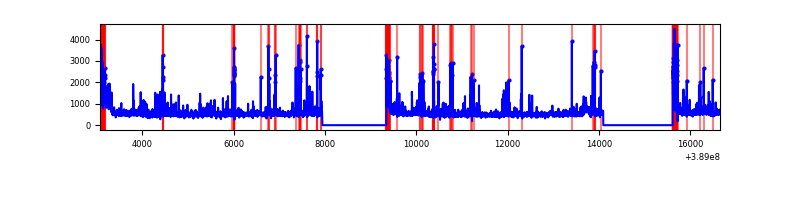 |
| D | 13574 | 10653 | 359 | 359 | 2.64% | 3.37% | 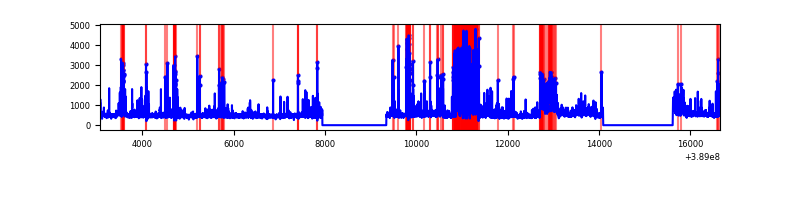 |
Top three noisy pixels from each quadrant. If the there are fewer than three noisy pixels in the level2.evt file, extra rows are filled as -1
| Pixel properties | Quadrant properties | ||||||
|---|---|---|---|---|---|---|---|
| Quadrant | DetID | PixID | Counts | Sigma | Mean | Median | Sigma |
| A | 10 | 83 | 253075 | 1020.95 | 1224 | 1198 | 246.7 |
| A | 13 | 6 | 24186 | 93.18 | 1224 | 1198 | 246.7 |
| A | 15 | 169 | 14941 | 55.71 | 1224 | 1198 | 246.7 |
| B | 5 | 172 | 2544152 | 11247.68 | 1181 | 1148 | 226.1 |
| B | 0 | 190 | 220341 | 969.49 | 1181 | 1148 | 226.1 |
| B | 0 | 182 | 39054 | 167.66 | 1181 | 1148 | 226.1 |
| C | 0 | 10 | 808750 | 2940.91 | 1181 | 1189 | 274.6 |
| C | 9 | 187 | 760294 | 2764.45 | 1181 | 1189 | 274.6 |
| C | 15 | 214 | 433912 | 1575.85 | 1181 | 1189 | 274.6 |
| D | 1 | 52 | 975729 | 3377.13 | 1177 | 1144 | 288.6 |
| D | 7 | 80 | 673330 | 2329.26 | 1177 | 1144 | 288.6 |
| D | 8 | 195 | 266519 | 919.58 | 1177 | 1144 | 288.6 |
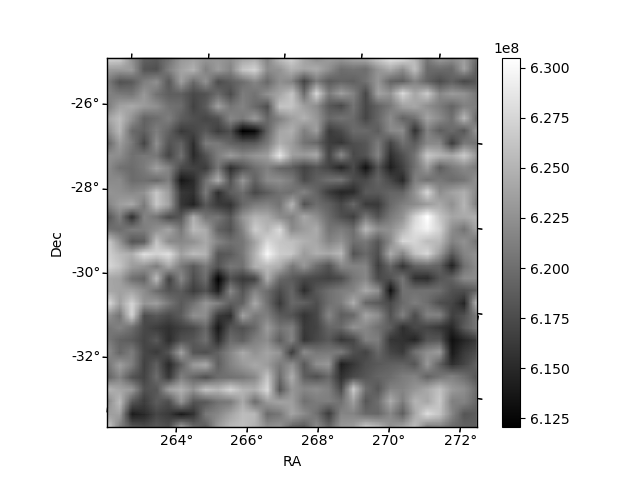
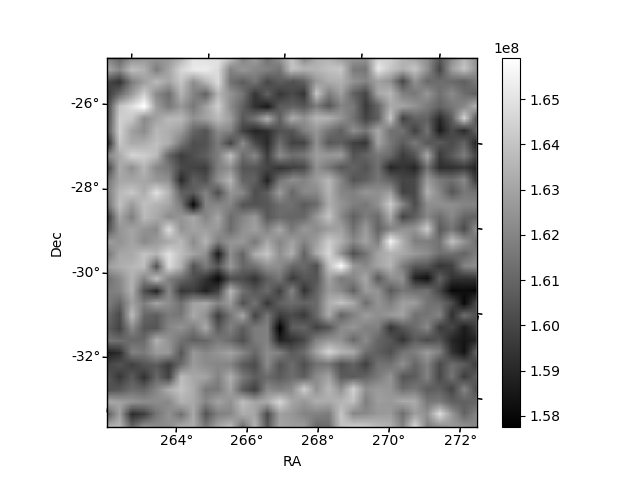
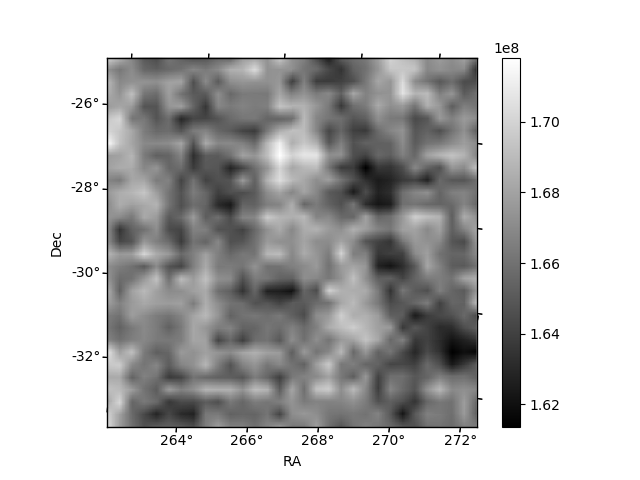
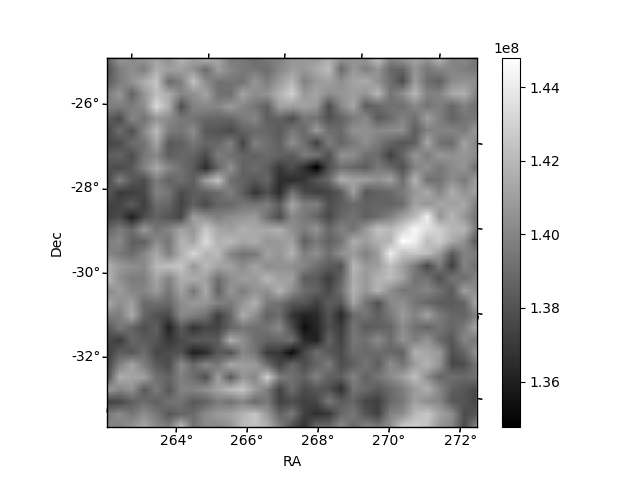
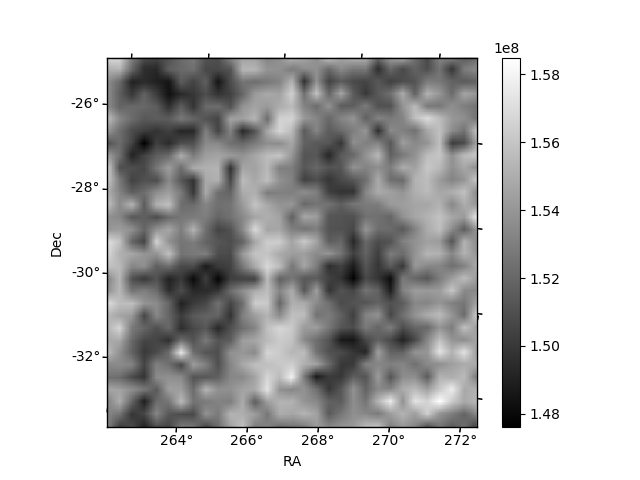
Histogram calculated using DETX and DETY for each event in the final _common_clean file
| Quadrant A | 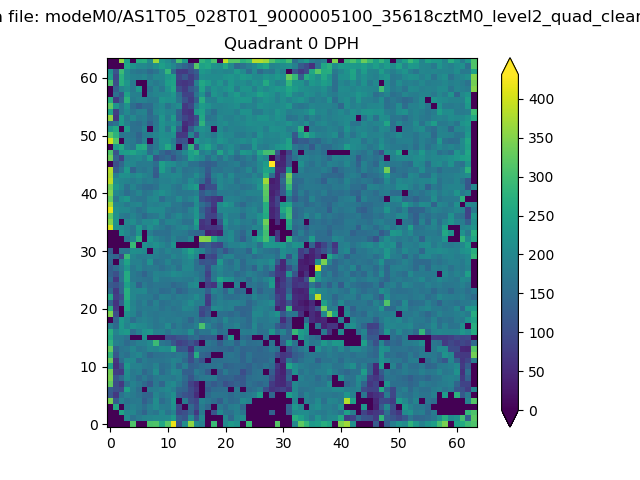 |
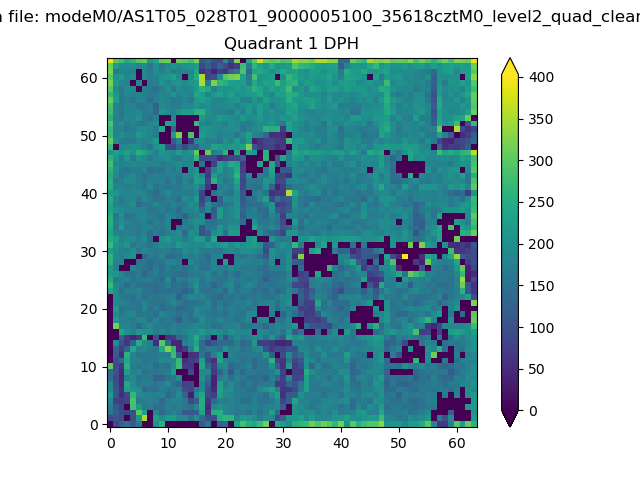 |
Quadrant B |
|---|---|---|---|
| Quadrant D | 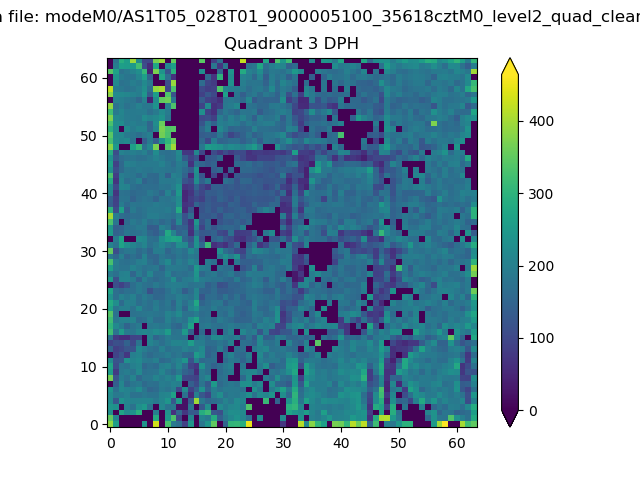 |
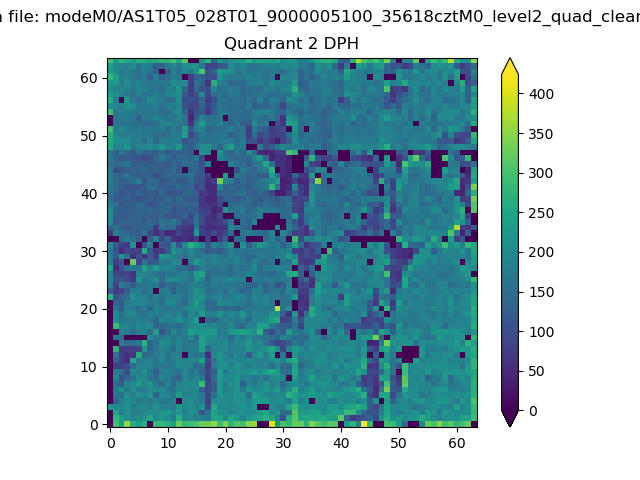 |
Quadrant C |
| Plot type | Count rate plots | Images |
|---|---|---|
| Comparison with Poisson distribution Blue bars denote a histogram of data divided into 1 sec bins. Red curve is a Poisson curve with rate = median count rate of data. |
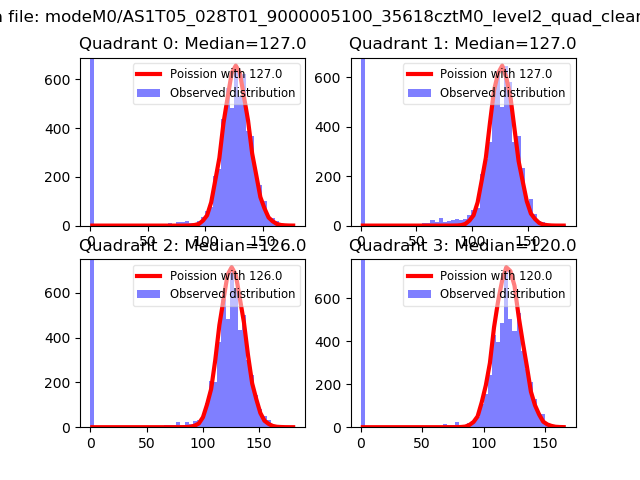 |
 |
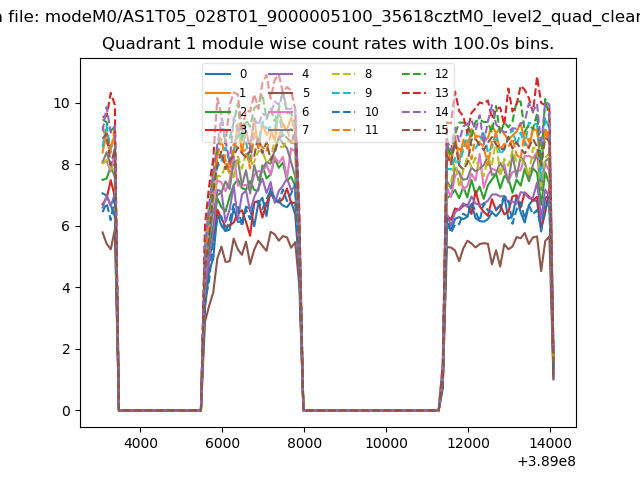
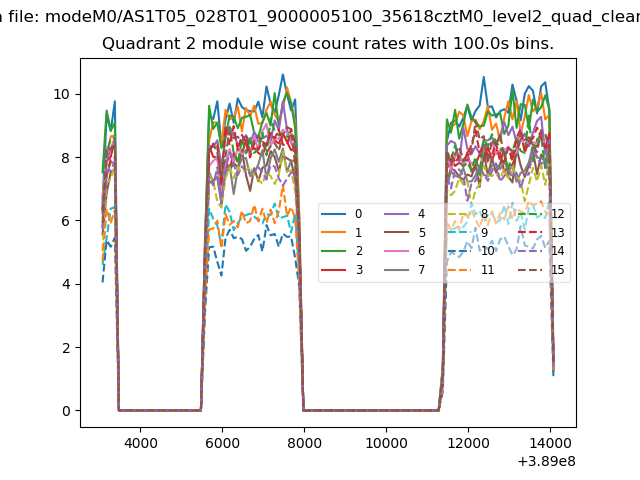
| Quadrant-wise count rates Data is divided into 100 sec bins |
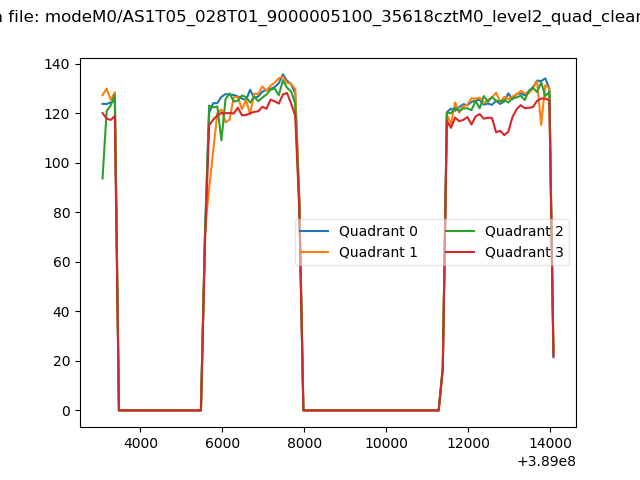 |
|
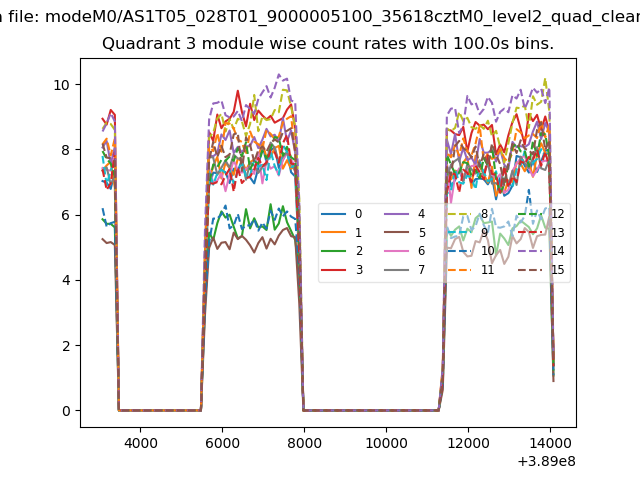
| Module-wise count rates for Quadrant A Data is divided into 100 sec bins |
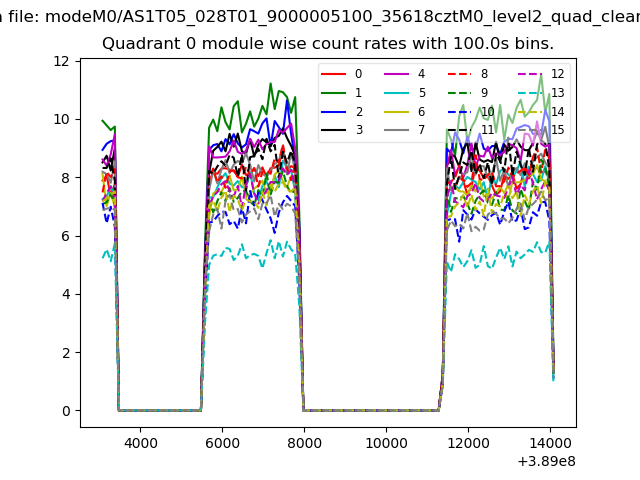 |
 |
| Module-wise count rates for Quadrant B Data is divided into 100 sec bins |
 |
 |
| Module-wise count rates for Quadrant C Data is divided into 100 sec bins |
 |
 |
| Module-wise count rates for Quadrant D Data is divided into 100 sec bins |
 |
 |
| Parameter | Plot |
|---|---|
| CZT HV Monitor | 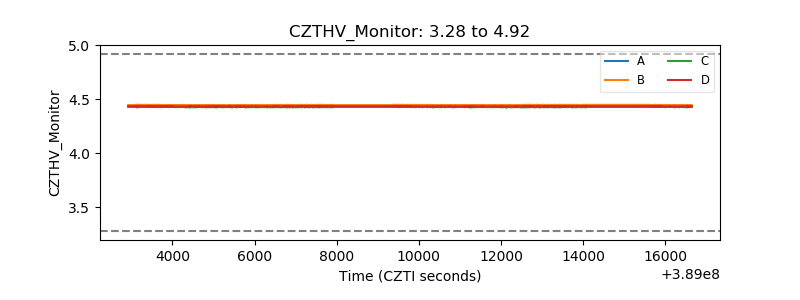 |
| D_VDD | 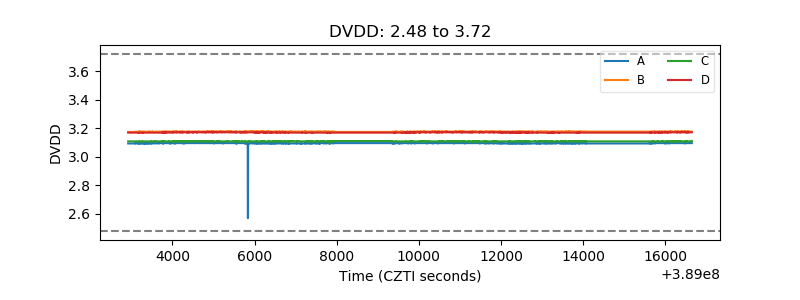 |
| Temperature 1 | 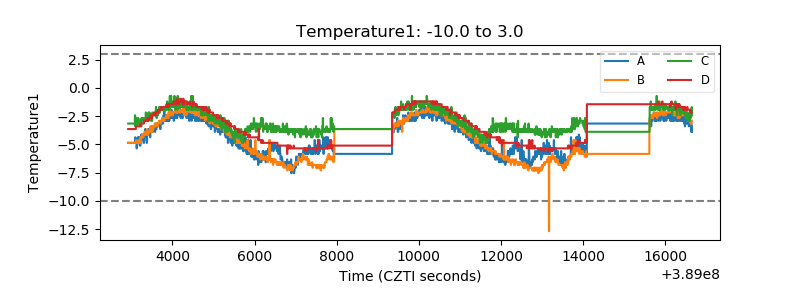 |
| Veto HV Monitor | 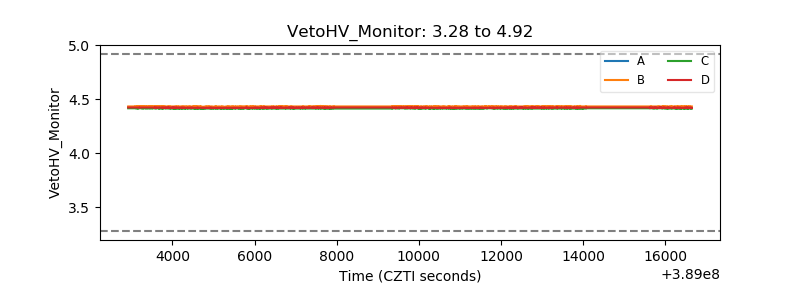 |
| Veto LLD | 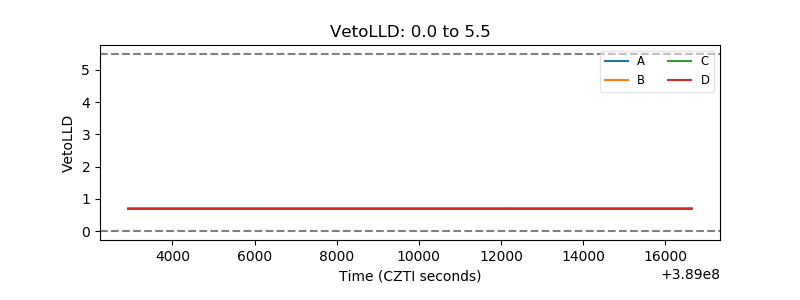 |
| Alpha Counter | 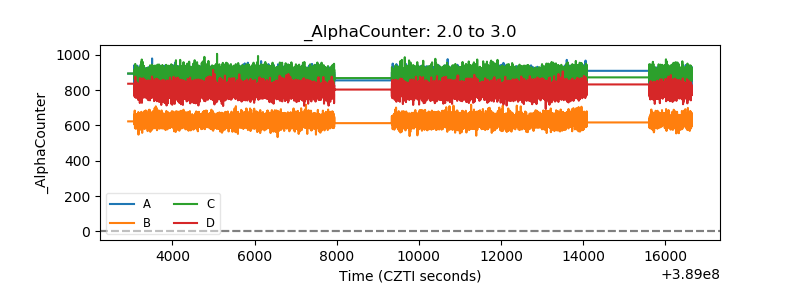 |
| _CPM_Rate | 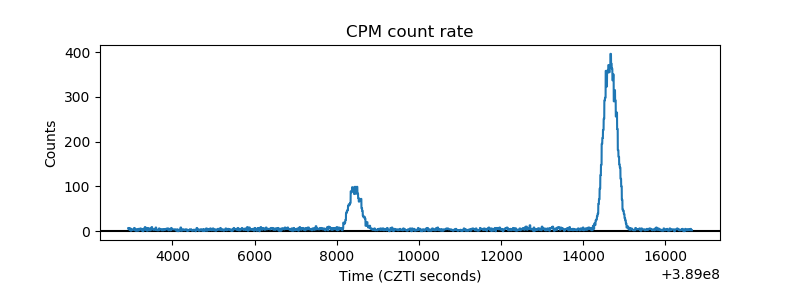 |
| CZT Counter | 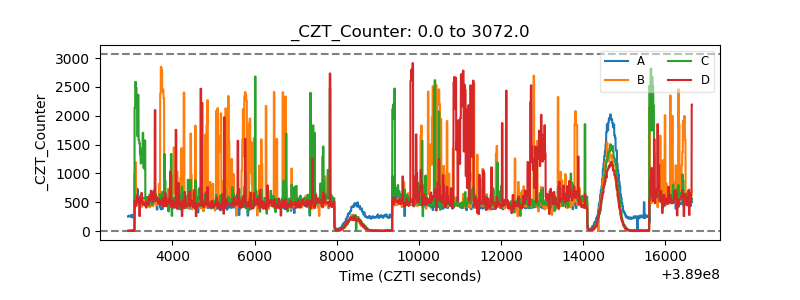 |
| +2.5 Volts monitor | 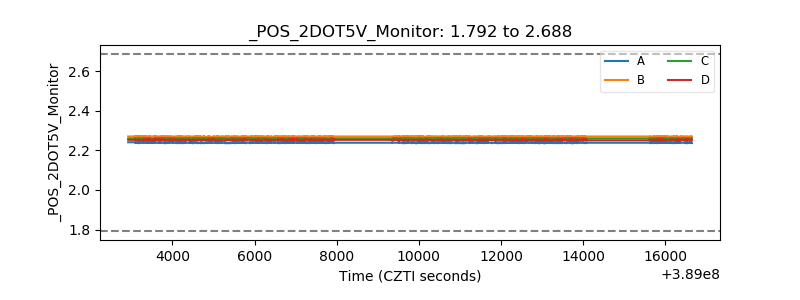 |
| +5 Volts monitor | 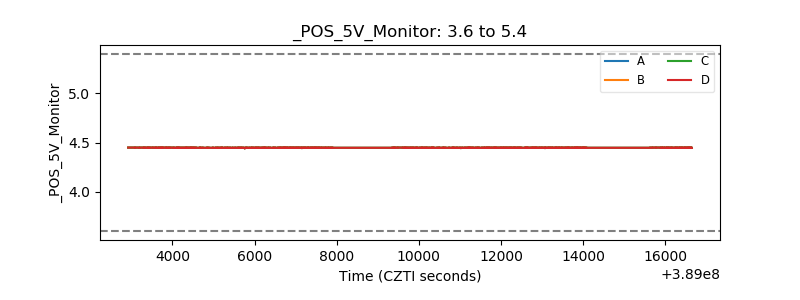 |
| _ROLL_ROT | 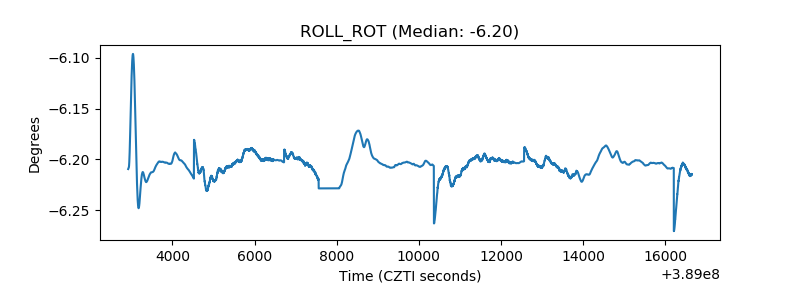 |
| _Roll_DEC | 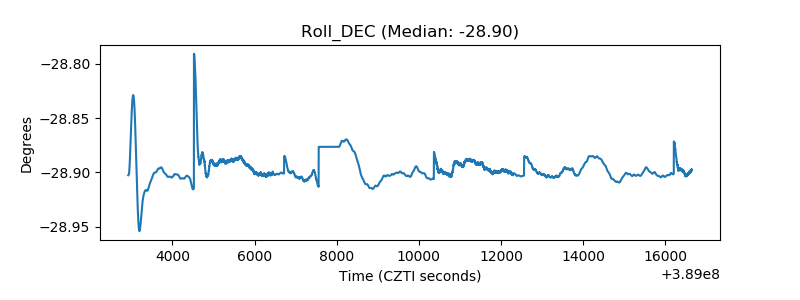 |
| _Roll_RA | 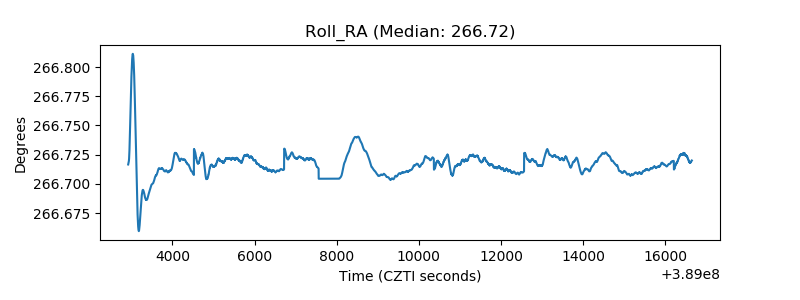 |
| Veto Counter | 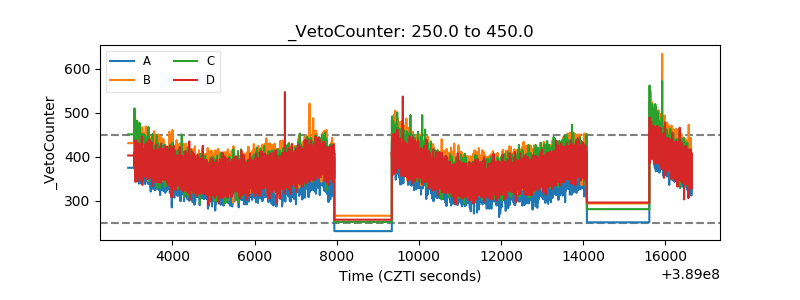 |