| Param | Original file | Final file |
|---|---|---|
| Filename | modeM0/AS1A10_065T04_9000005098_35621cztM0_level2.evt | modeM0/AS1A10_065T04_9000005098_35621cztM0_level2_quad_clean.evt |
| Size (bytes) | 1,272,430,080 | 53,196,480 |
| Size | 1.2 GB | 50.7 MB |
| Events in quadrant A | 6,303,489 | 189,338 |
| Events in quadrant B | 8,026,274 | 193,701 |
| Events in quadrant C | 7,493,259 | 192,126 |
| Events in quadrant D | 15,827,898 | 127,913 |
| Mode M9 | |||
|---|---|---|---|
| Quadrant | BADHDUFLAG | Total packets | Discarded packets |
| A | 0 | 26 | 0 |
| B | 0 | 26 | 0 |
| C | 0 | 26 | 0 |
| D | 0 | 26 | 0 |
| Mode M0 | |||
|---|---|---|---|
| Quadrant | BADHDUFLAG | Total packets | Discarded packets |
| A | 0 | 28582 | 1631 |
| B | 0 | 33735 | 1409 |
| C | 0 | 31252 | 1332 |
| D | 0 | 59422 | 3650 |
| Mode SS | |||
|---|---|---|---|
| Quadrant | BADHDUFLAG | Total packets | Discarded packets |
| A | 0 | 279 | 9 |
| B | 0 | 280 | 6 |
| C | 0 | 278 | 4 |
| D | 0 | 280 | 9 |
| Quadrant | Total seconds | Saturated seconds | Saturation percentage |
|---|---|---|---|
| A | 13108 | 11 | 0.083918% |
| B | 13133 | 438 | 3.335110% |
| C | 13131 | 274 | 2.086665% |
| D | 12993 | 3561 | 27.407065% |
Noise dominated data is calculated using 1-second bins in cleaned event files. If a bin has >2000 counts, and if more than 50% of those come from <1% of pixels, then it is considered to be noise-dominated and hence unusable.
| Quadrant | # 1 sec bins | Bins with >0 counts | Bins with >2000 counts | High rate bins dominated by noise | Noise dominated (total time) | Noise dominated (detector-on time) | Marked lightcurve |
|---|---|---|---|---|---|---|---|
| A | 16487 | 13266 | 0 | 0 | 0.00% | 0.00% | 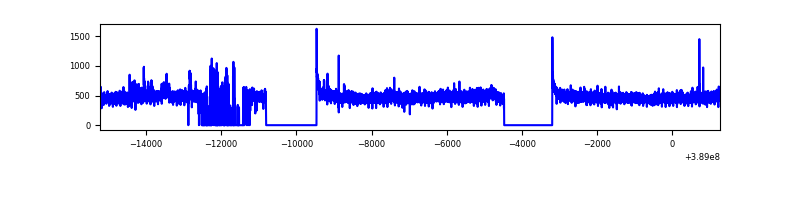 |
| B | 16487 | 13302 | 277 | 277 | 1.68% | 2.08% | 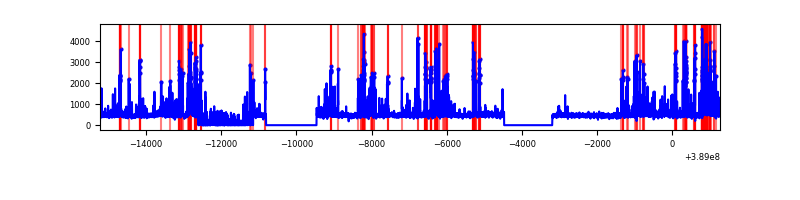 |
| C | 16487 | 13297 | 216 | 216 | 1.31% | 1.62% | 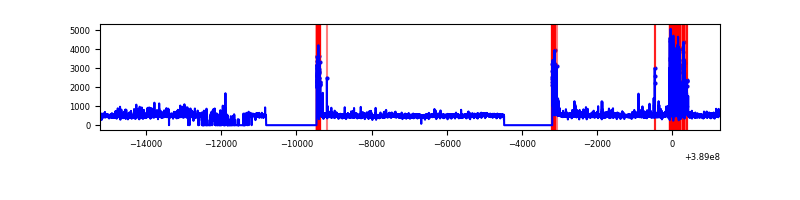 |
| D | 16487 | 13133 | 2856 | 2856 | 17.32% | 21.75% | 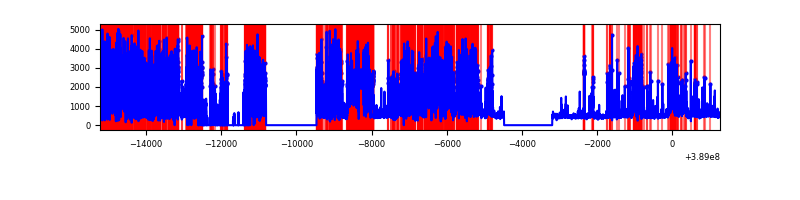 |
Top three noisy pixels from each quadrant. If the there are fewer than three noisy pixels in the level2.evt file, extra rows are filled as -1
| Pixel properties | Quadrant properties | ||||||
|---|---|---|---|---|---|---|---|
| Quadrant | DetID | PixID | Counts | Sigma | Mean | Median | Sigma |
| A | 10 | 83 | 234967 | 767.96 | 1509 | 1478 | 304.0 |
| A | 15 | 169 | 193771 | 632.47 | 1509 | 1478 | 304.0 |
| A | 13 | 6 | 21979 | 67.43 | 1509 | 1478 | 304.0 |
| B | 5 | 172 | 1988054 | 6894.54 | 1487 | 1447 | 288.1 |
| B | 0 | 190 | 43940 | 147.47 | 1487 | 1447 | 288.1 |
| B | 5 | 200 | 40219 | 134.56 | 1487 | 1447 | 288.1 |
| C | 0 | 10 | 673147 | 1965.25 | 1458 | 1465 | 341.8 |
| C | 15 | 214 | 529456 | 1544.83 | 1458 | 1465 | 341.8 |
| C | 1 | 23 | 465842 | 1358.7 | 1458 | 1465 | 341.8 |
| D | 7 | 80 | 9510037 | 31244.25 | 1235 | 1198 | 304.3 |
| D | 12 | 233 | 357278 | 1170.01 | 1235 | 1198 | 304.3 |
| D | 13 | 249 | 277079 | 906.49 | 1235 | 1198 | 304.3 |
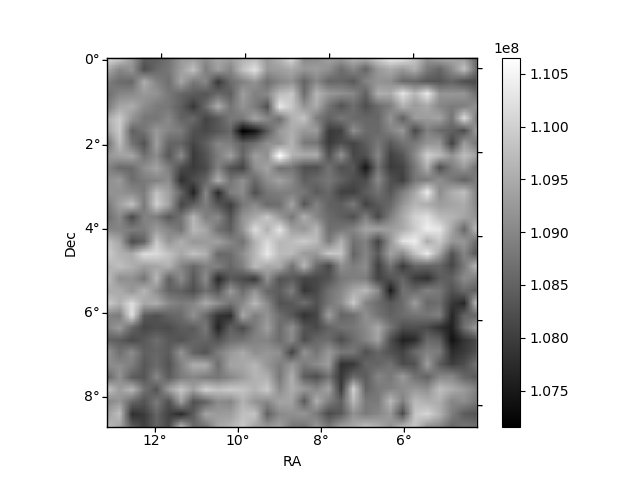
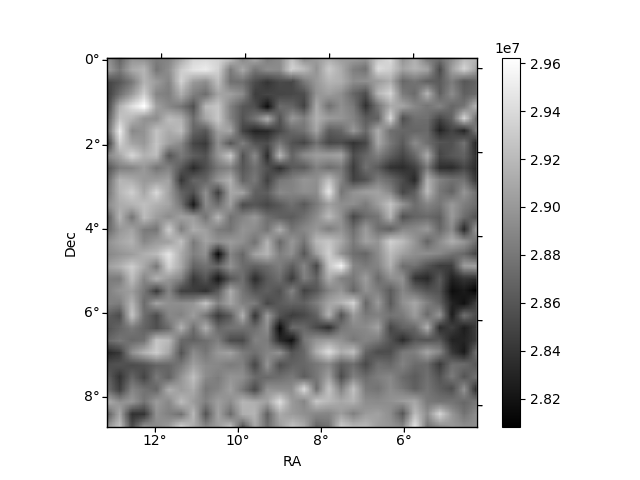
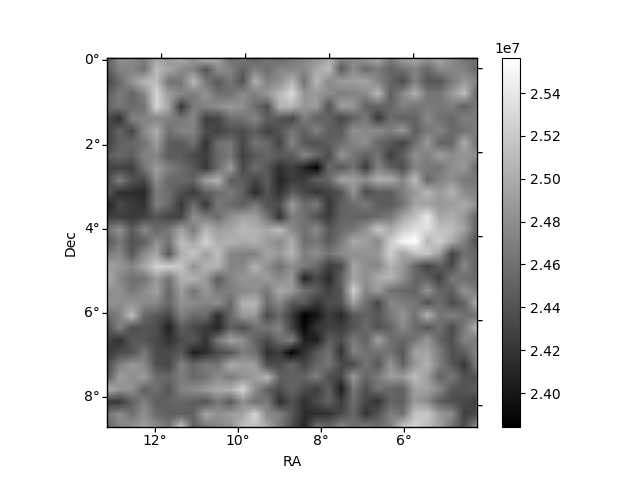
Histogram calculated using DETX and DETY for each event in the final _common_clean file
| Quadrant A | 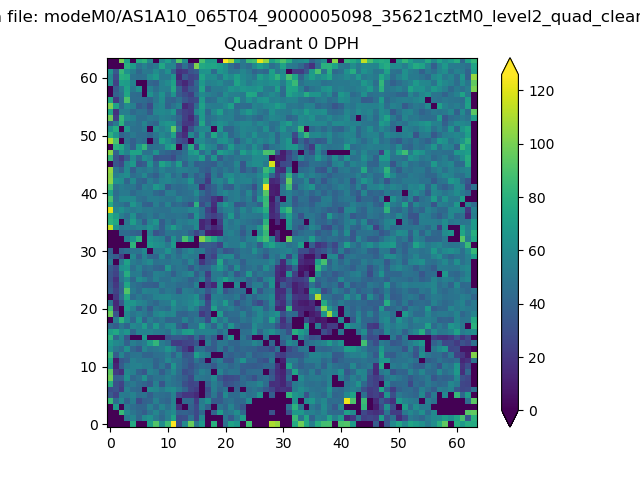 |
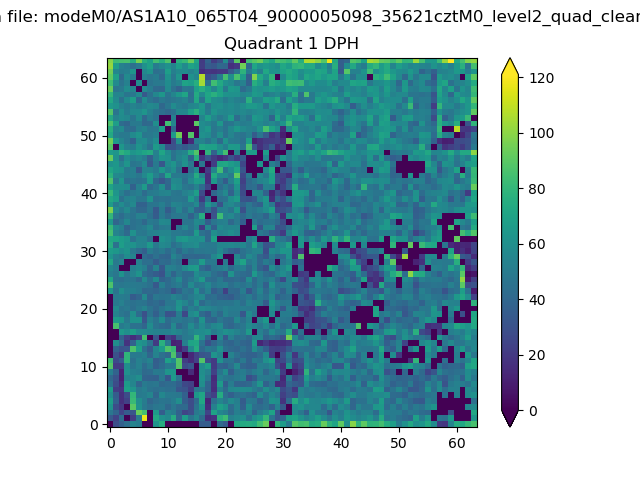 |
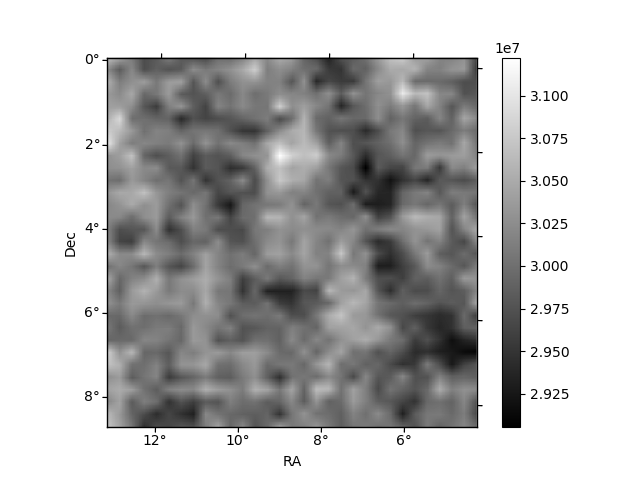
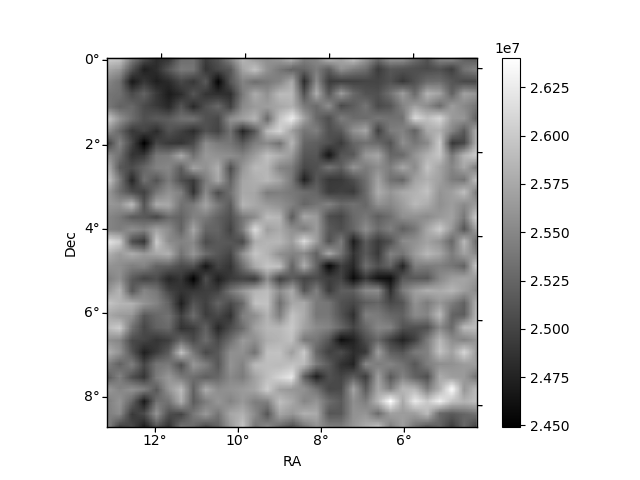
Quadrant B |
|---|---|---|---|
| Quadrant D | 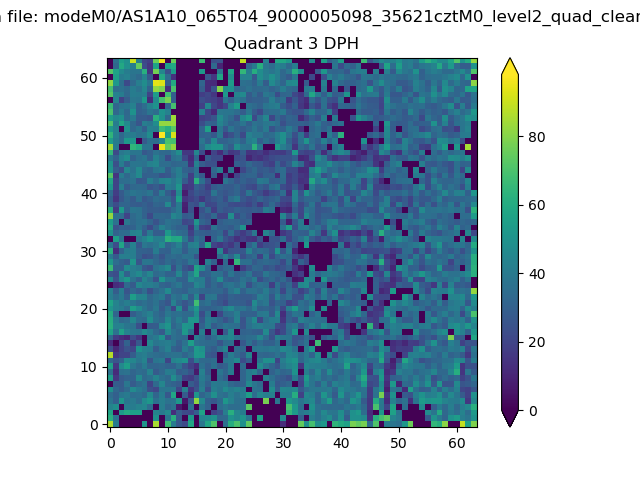 |
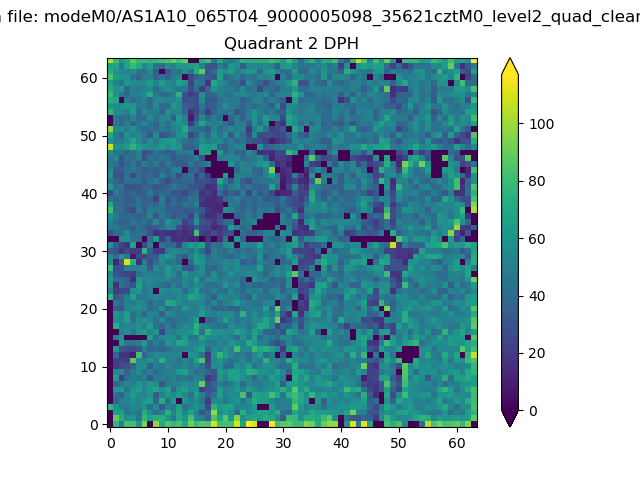 |
Quadrant C |
| Plot type | Count rate plots | Images |
|---|---|---|
| Comparison with Poisson distribution Blue bars denote a histogram of data divided into 1 sec bins. Red curve is a Poisson curve with rate = median count rate of data. |
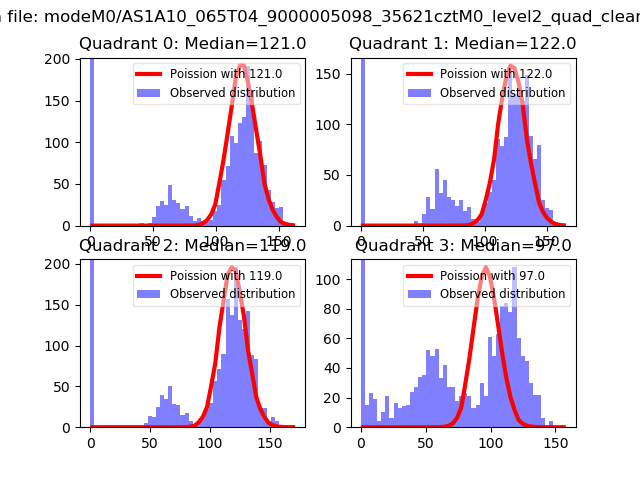 |
 |
| Quadrant-wise count rates Data is divided into 100 sec bins |
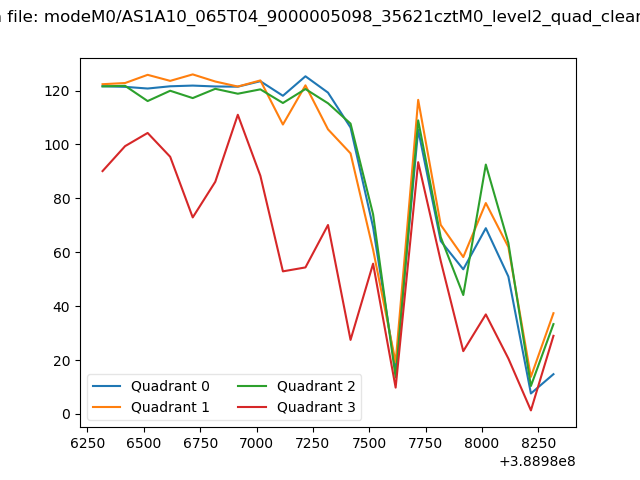 |
|
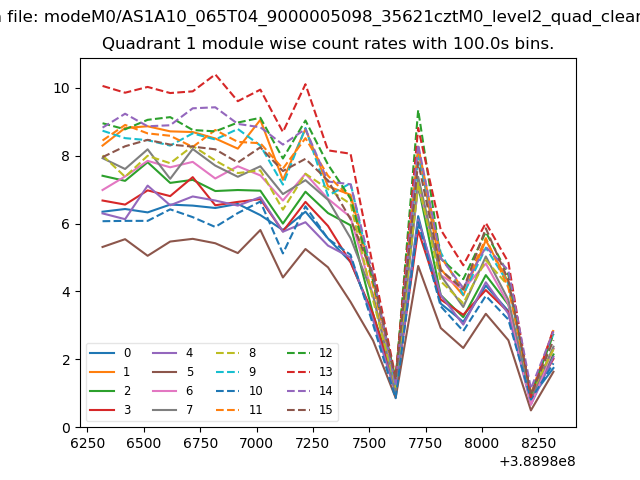
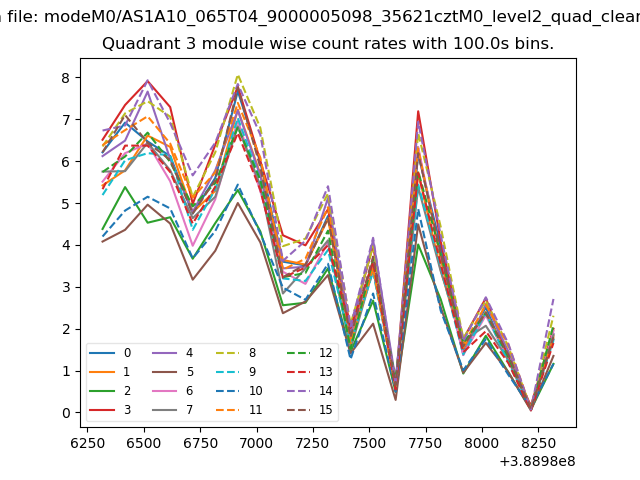
| Module-wise count rates for Quadrant A Data is divided into 100 sec bins |
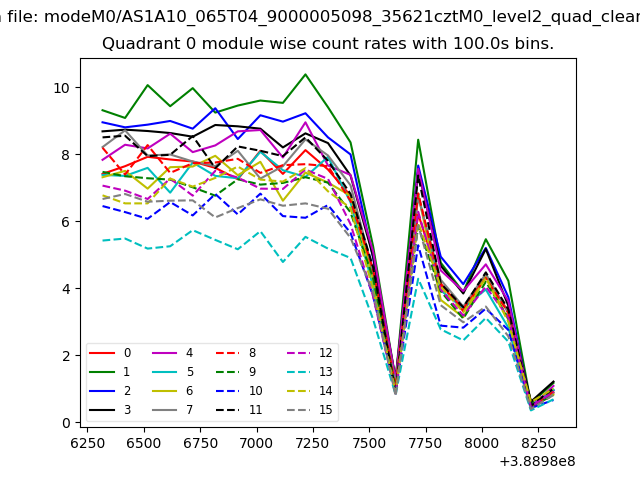 |
 |
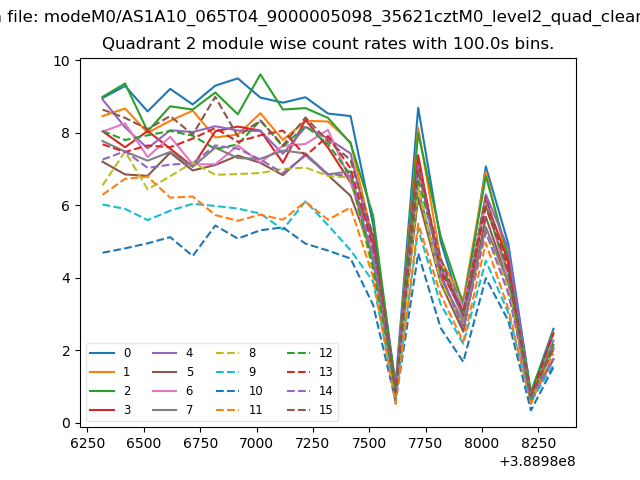
| Module-wise count rates for Quadrant B Data is divided into 100 sec bins |
 |
 |
| Module-wise count rates for Quadrant C Data is divided into 100 sec bins |
 |
 |
| Module-wise count rates for Quadrant D Data is divided into 100 sec bins |
 |
 |
| Parameter | Plot |
|---|---|
| CZT HV Monitor | 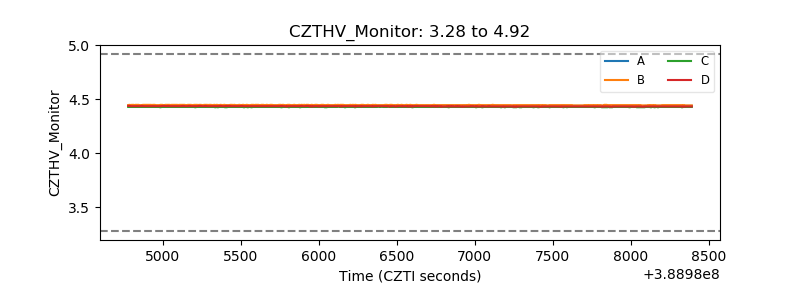 |
| D_VDD | 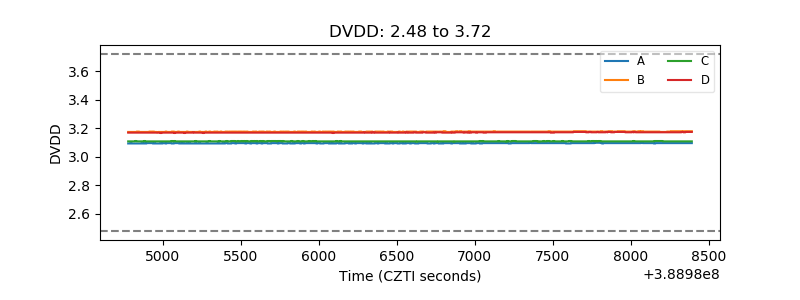 |
| Temperature 1 | 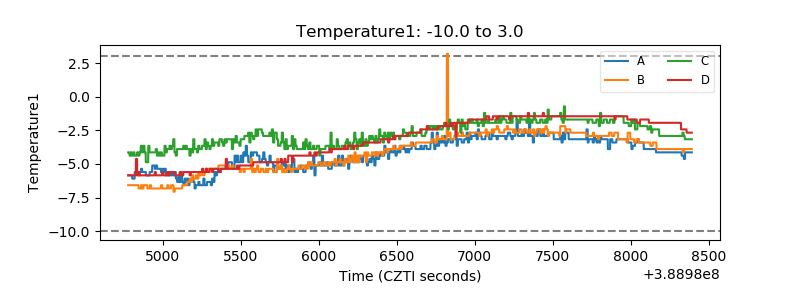 |
| Veto HV Monitor | 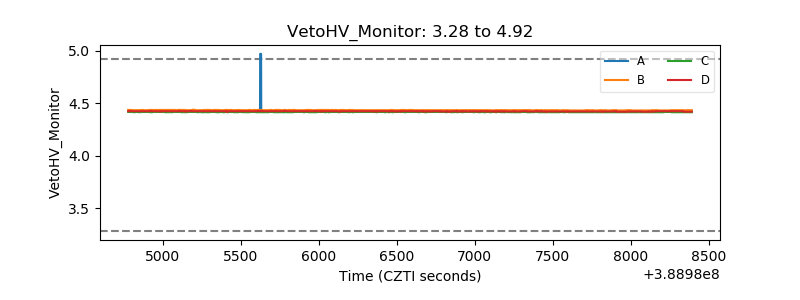 |
| Veto LLD | 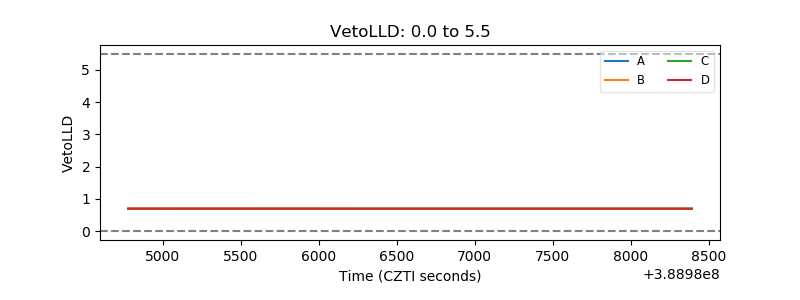 |
| Alpha Counter | 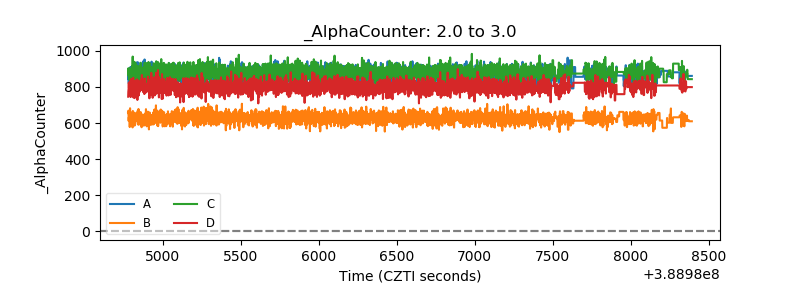 |
| _CPM_Rate | 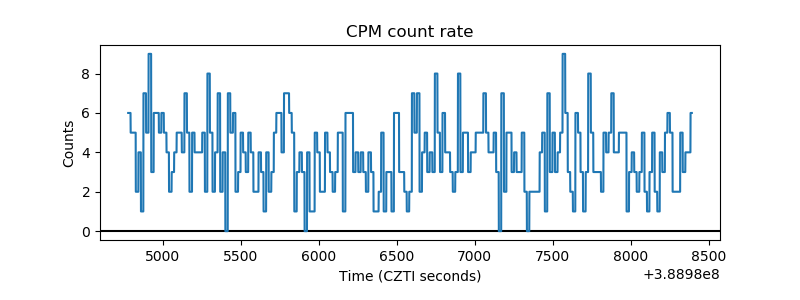 |
| CZT Counter | 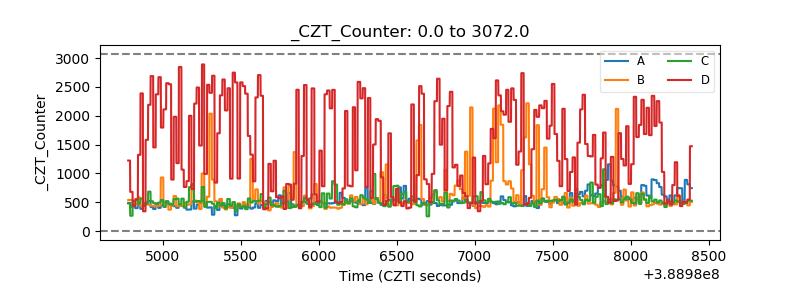 |
| +2.5 Volts monitor | 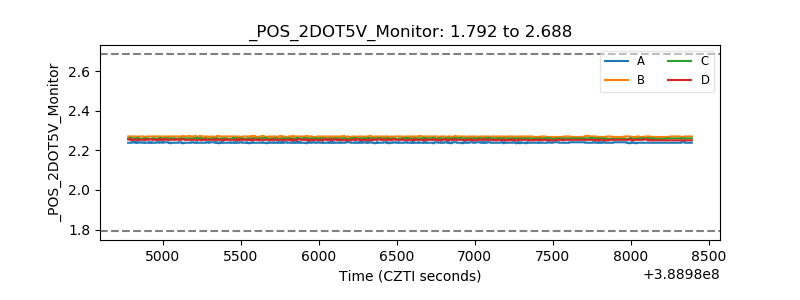 |
| +5 Volts monitor | 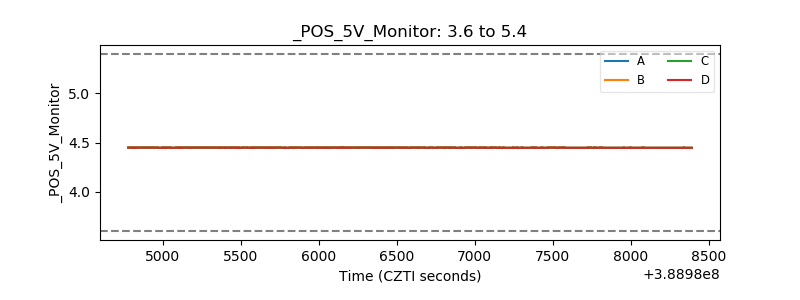 |
| _ROLL_ROT | 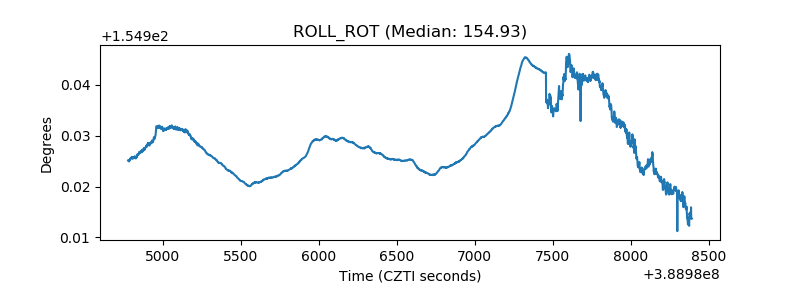 |
| _Roll_DEC | 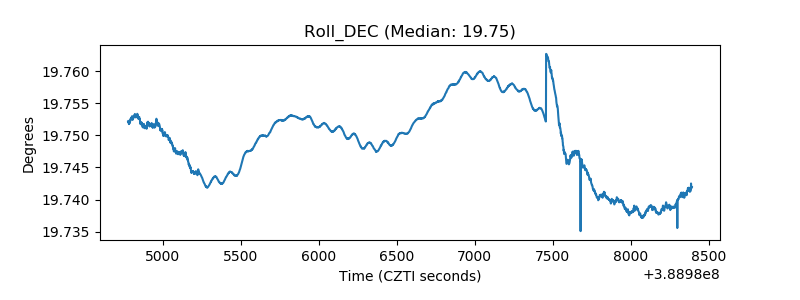 |
| _Roll_RA | 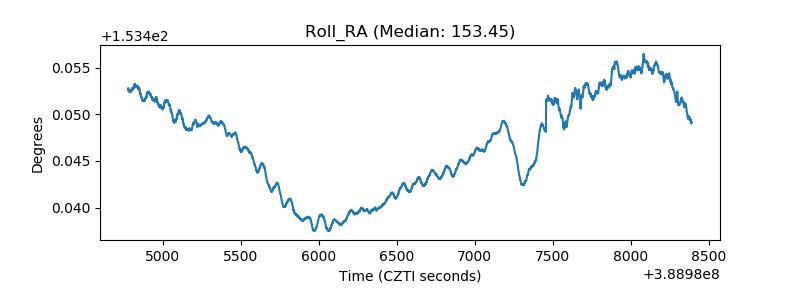 |
| Veto Counter | 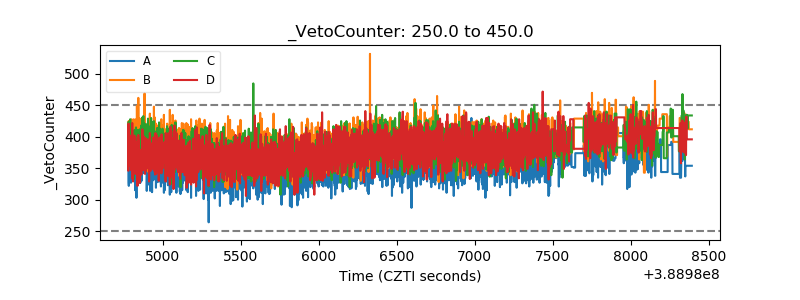 |