| Param | Original file | Final file |
|---|---|---|
| Filename | modeM0/AS1A10_065T04_9000005098_35613cztM0_level2.evt | modeM0/AS1A10_065T04_9000005098_35613cztM0_level2_quad_clean.evt |
| Size (bytes) | 994,590,720 | 84,761,280 |
| Size | 948.5 MB | 80.8 MB |
| Events in quadrant A | 4,820,531 | 514,888 |
| Events in quadrant B | 5,416,723 | 515,561 |
| Events in quadrant C | 5,340,941 | 504,193 |
| Events in quadrant D | 13,904,393 | 375,065 |
| Mode M9 | |||
|---|---|---|---|
| Quadrant | BADHDUFLAG | Total packets | Discarded packets |
| A | 0 | 35 | 0 |
| B | 0 | 35 | 0 |
| C | 0 | 35 | 0 |
| D | 0 | 35 | 0 |
| Mode M0 | |||
|---|---|---|---|
| Quadrant | BADHDUFLAG | Total packets | Discarded packets |
| A | 0 | 20286 | 3 |
| B | 0 | 22285 | 2 |
| C | 0 | 21390 | 2 |
| D | 0 | 47753 | 6 |
| Mode SS | |||
|---|---|---|---|
| Quadrant | BADHDUFLAG | Total packets | Discarded packets |
| A | 0 | 194 | 0 |
| B | 0 | 194 | 0 |
| C | 0 | 194 | 0 |
| D | 0 | 194 | 0 |
| Quadrant | Total seconds | Saturated seconds | Saturation percentage |
|---|---|---|---|
| A | 9458 | 32 | 0.338338% |
| B | 9458 | 276 | 2.918165% |
| C | 9458 | 153 | 1.617678% |
| D | 9457 | 3535 | 37.379719% |
Noise dominated data is calculated using 1-second bins in cleaned event files. If a bin has >2000 counts, and if more than 50% of those come from <1% of pixels, then it is considered to be noise-dominated and hence unusable.
| Quadrant | # 1 sec bins | Bins with >0 counts | Bins with >2000 counts | High rate bins dominated by noise | Noise dominated (total time) | Noise dominated (detector-on time) | Marked lightcurve |
|---|---|---|---|---|---|---|---|
| A | 12986 | 9460 | 13 | 13 | 0.10% | 0.14% | 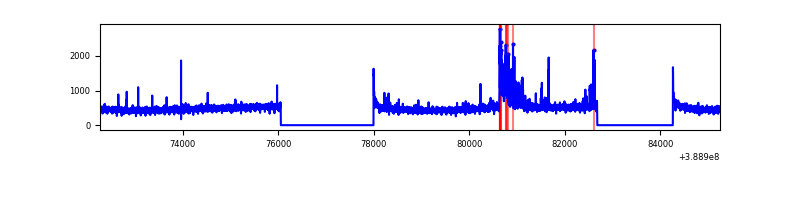 |
| B | 12986 | 9460 | 168 | 168 | 1.29% | 1.78% | 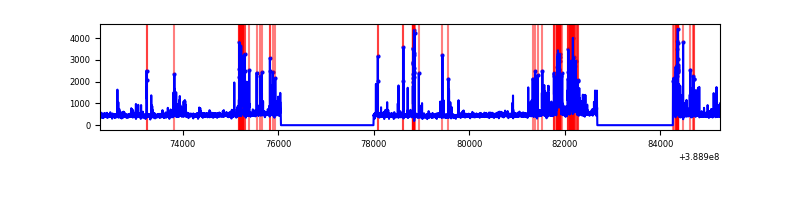 |
| C | 12986 | 9460 | 116 | 116 | 0.89% | 1.23% | 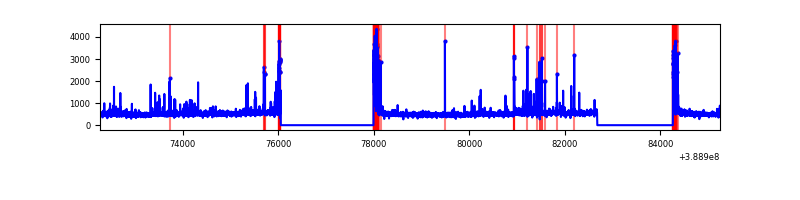 |
| D | 12985 | 9459 | 2942 | 2942 | 22.66% | 31.10% | 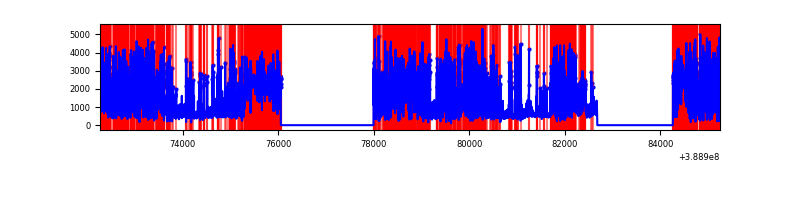 |
Top three noisy pixels from each quadrant. If the there are fewer than three noisy pixels in the level2.evt file, extra rows are filled as -1
| Pixel properties | Quadrant properties | ||||||
|---|---|---|---|---|---|---|---|
| Quadrant | DetID | PixID | Counts | Sigma | Mean | Median | Sigma |
| A | 15 | 169 | 339665 | 1545.91 | 1097 | 1076 | 219.0 |
| A | 10 | 83 | 189788 | 861.61 | 1097 | 1076 | 219.0 |
| A | 13 | 6 | 17375 | 74.42 | 1097 | 1076 | 219.0 |
| B | 5 | 172 | 923201 | 4385.51 | 1081 | 1052 | 210.3 |
| B | 4 | 81 | 121183 | 571.31 | 1081 | 1052 | 210.3 |
| B | 5 | 200 | 39208 | 181.46 | 1081 | 1052 | 210.3 |
| C | 0 | 10 | 539251 | 2193.88 | 1059 | 1068 | 245.3 |
| C | 15 | 214 | 385263 | 1566.16 | 1059 | 1068 | 245.3 |
| C | 1 | 23 | 193918 | 786.15 | 1059 | 1068 | 245.3 |
| D | 7 | 80 | 8472047 | 40418.4 | 854 | 830 | 209.6 |
| D | 12 | 233 | 1623807 | 7743.65 | 854 | 830 | 209.6 |
| D | 2 | 249 | 126501 | 599.61 | 854 | 830 | 209.6 |
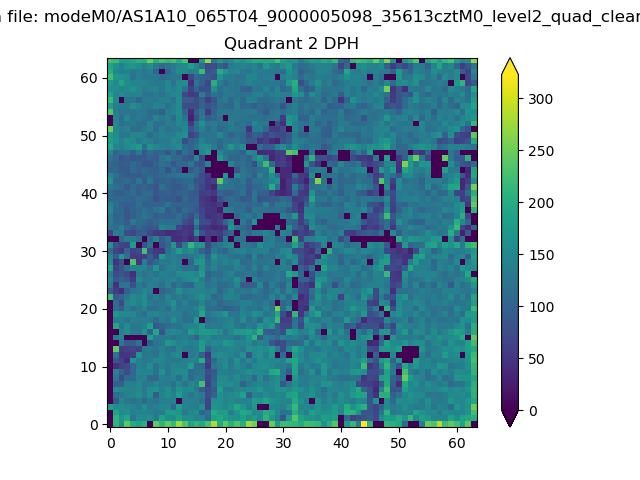
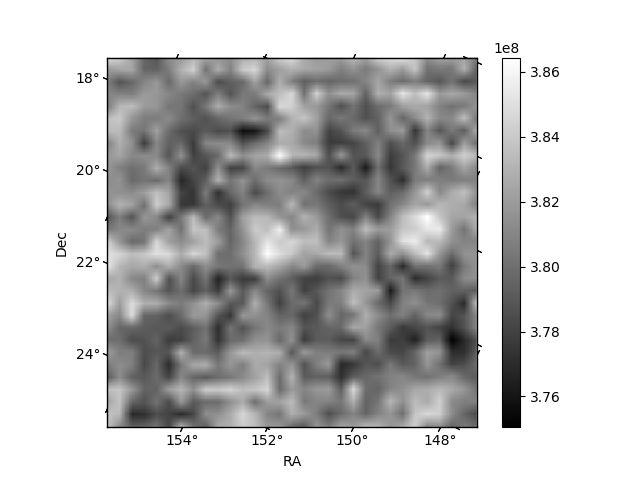
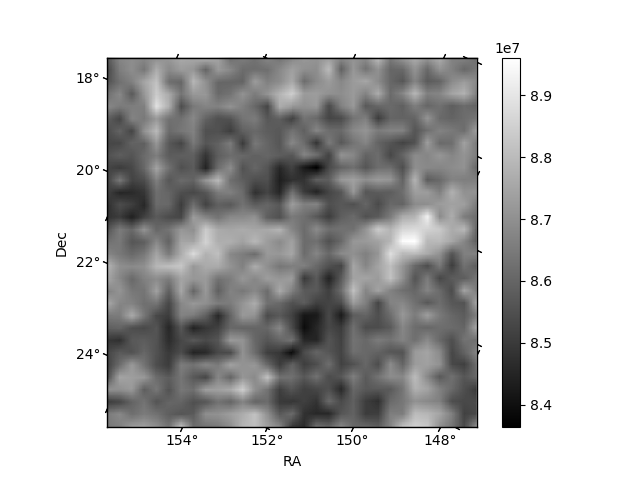
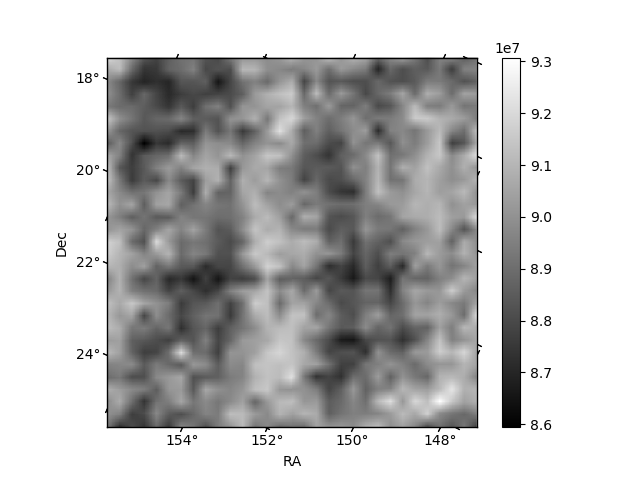
Histogram calculated using DETX and DETY for each event in the final _common_clean file
| Quadrant A | 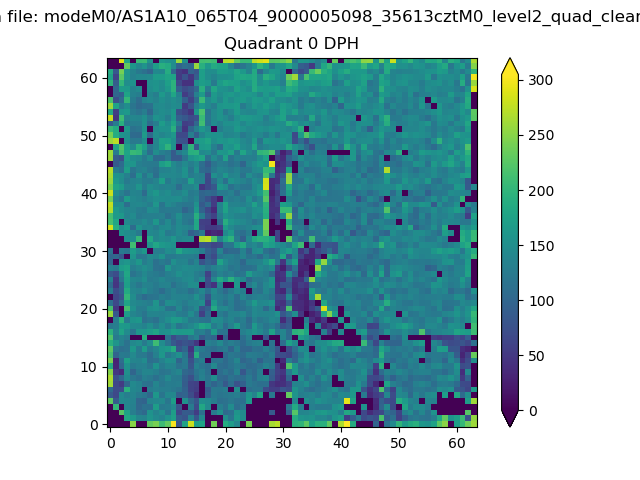 |
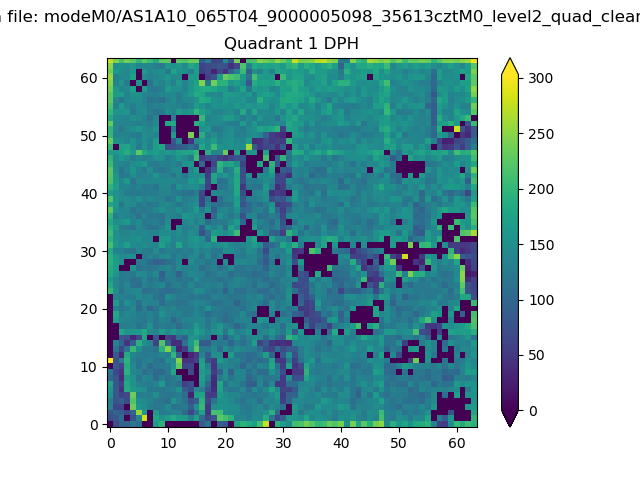 |
Quadrant B |
|---|---|---|---|
| Quadrant D | 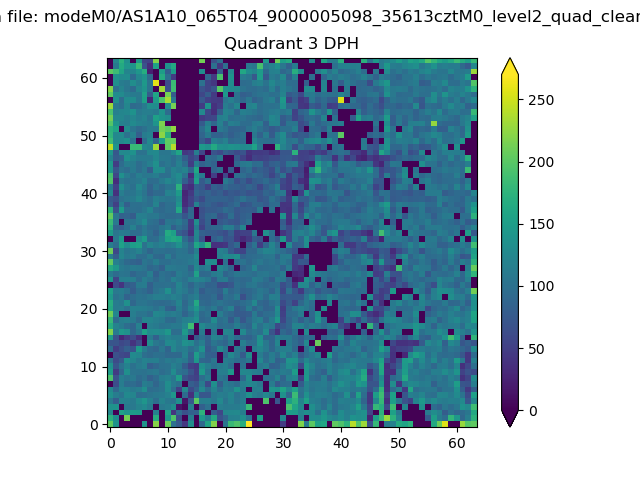 |
 |
Quadrant C |
| Plot type | Count rate plots | Images |
|---|---|---|
| Comparison with Poisson distribution Blue bars denote a histogram of data divided into 1 sec bins. Red curve is a Poisson curve with rate = median count rate of data. |
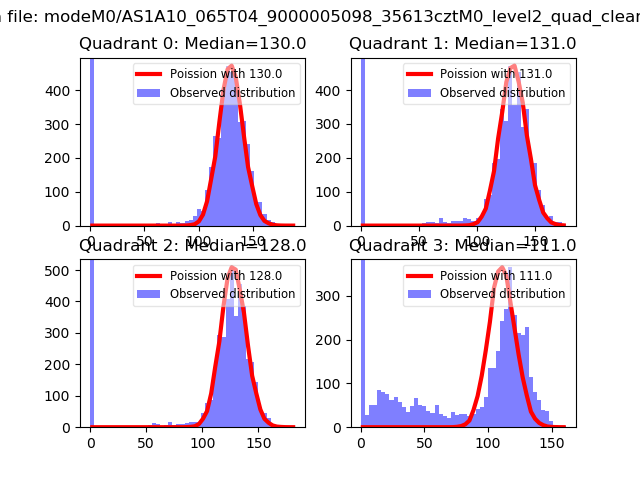 |
 |
| Quadrant-wise count rates Data is divided into 100 sec bins |
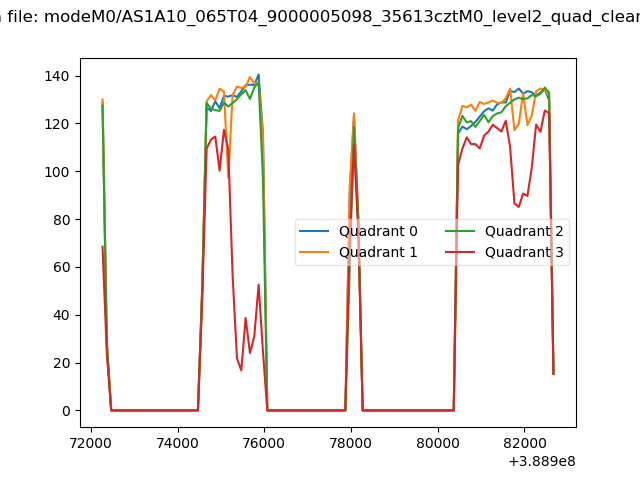 |
|
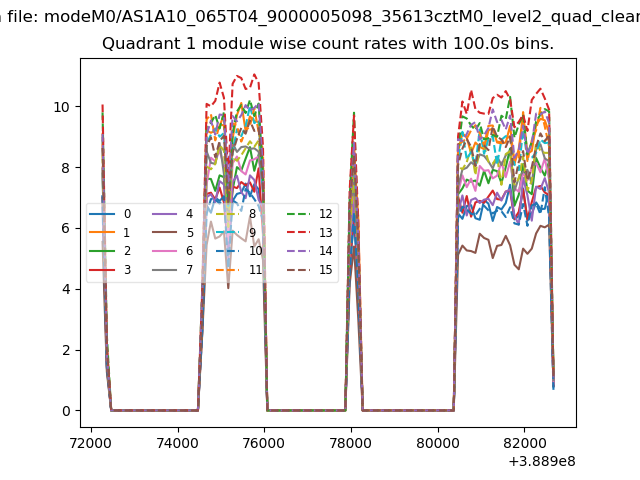
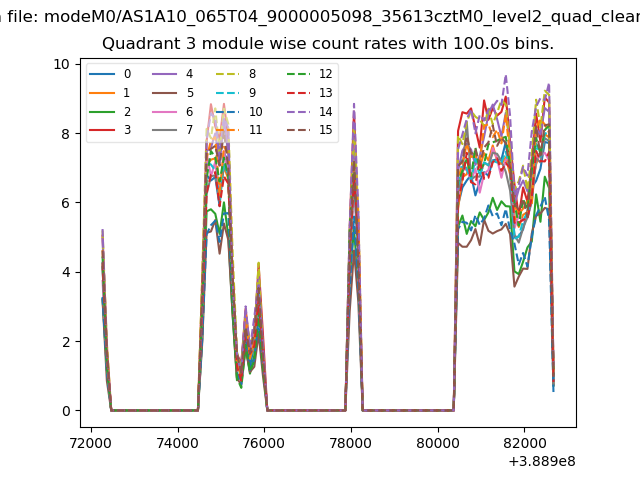
| Module-wise count rates for Quadrant A Data is divided into 100 sec bins |
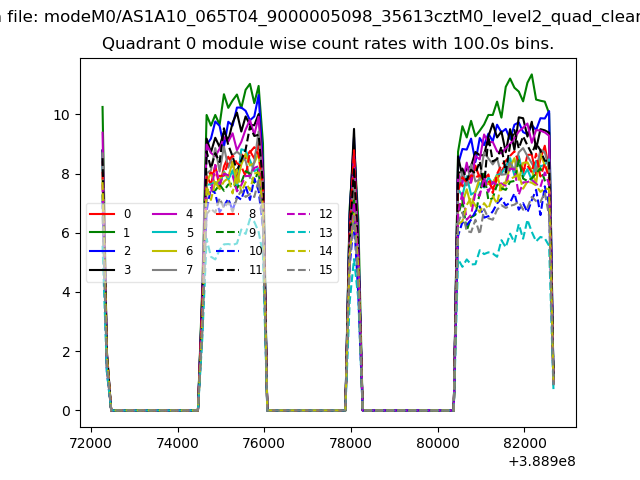 |
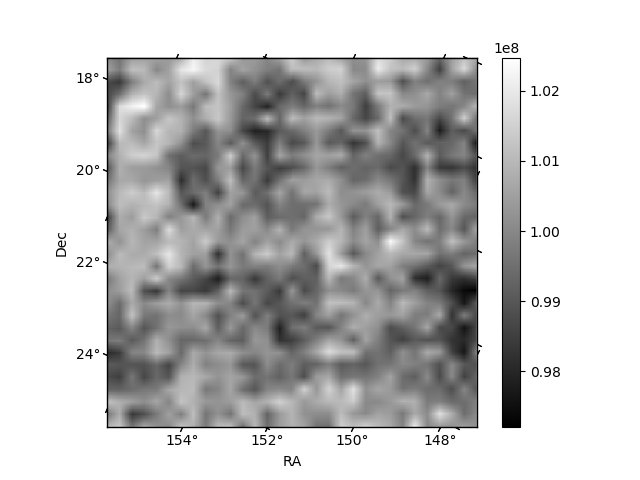 |
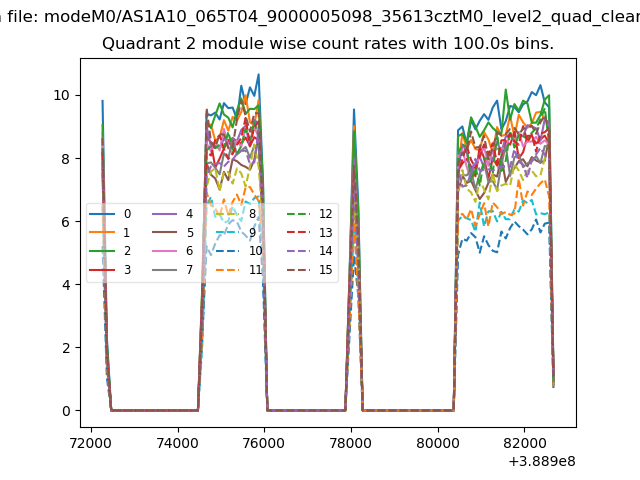
| Module-wise count rates for Quadrant B Data is divided into 100 sec bins |
 |
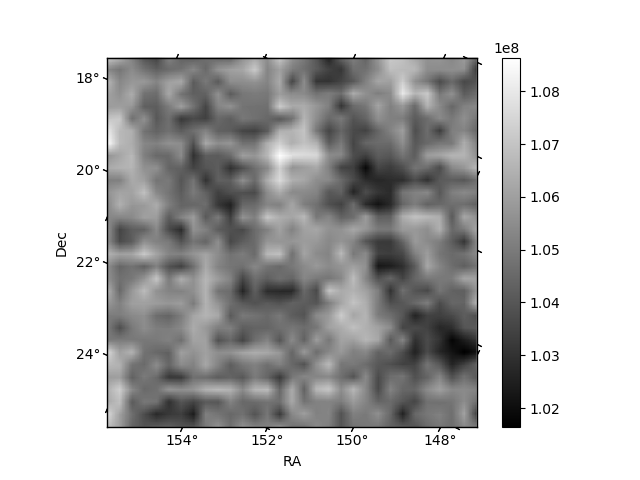 |
| Module-wise count rates for Quadrant C Data is divided into 100 sec bins |
 |
 |
| Module-wise count rates for Quadrant D Data is divided into 100 sec bins |
 |
 |
| Parameter | Plot |
|---|---|
| CZT HV Monitor | 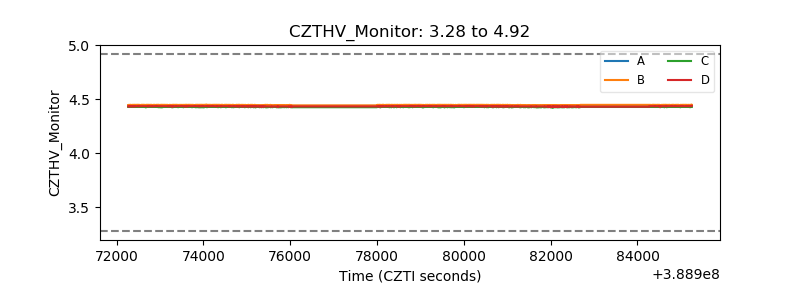 |
| D_VDD | 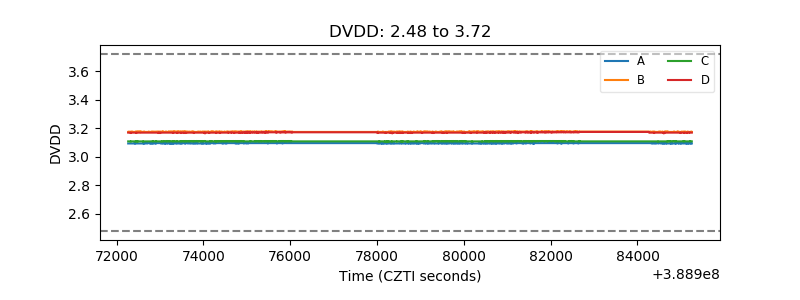 |
| Temperature 1 | 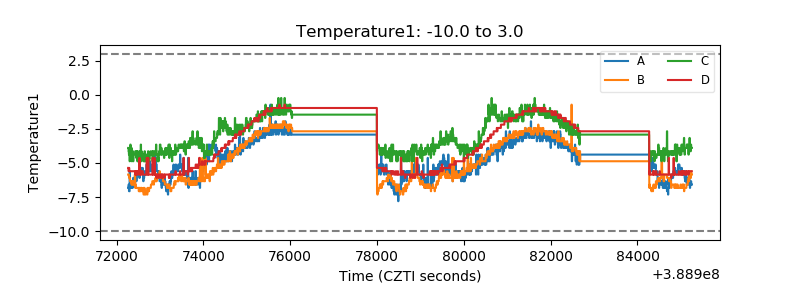 |
| Veto HV Monitor | 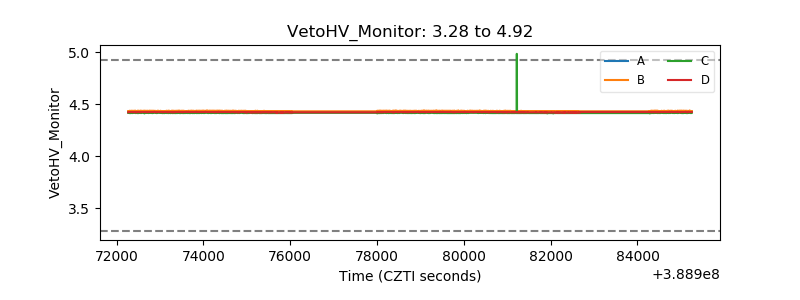 |
| Veto LLD | 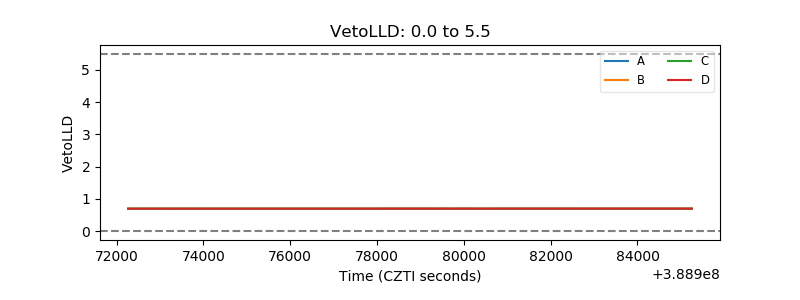 |
| Alpha Counter | 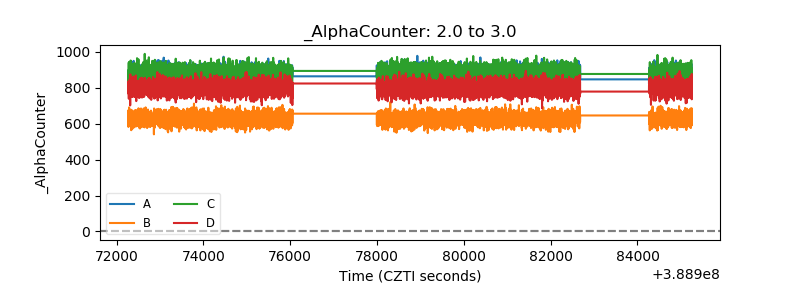 |
| _CPM_Rate | 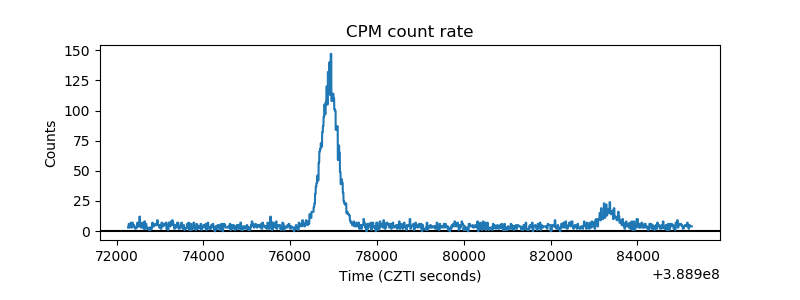 |
| CZT Counter | 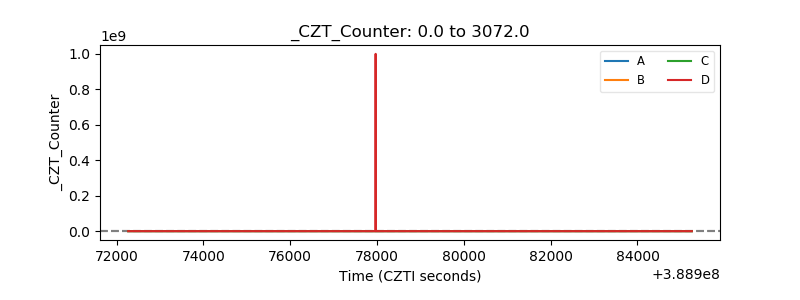 |
| +2.5 Volts monitor | 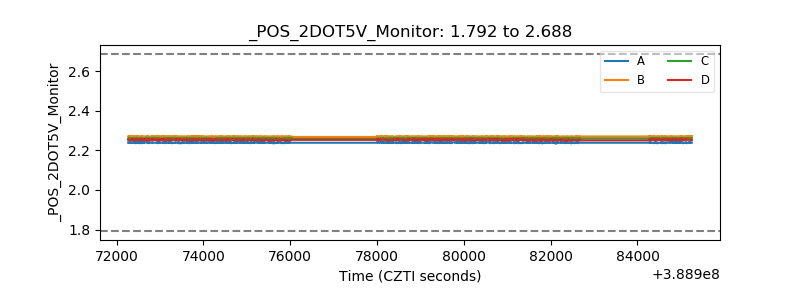 |
| +5 Volts monitor | 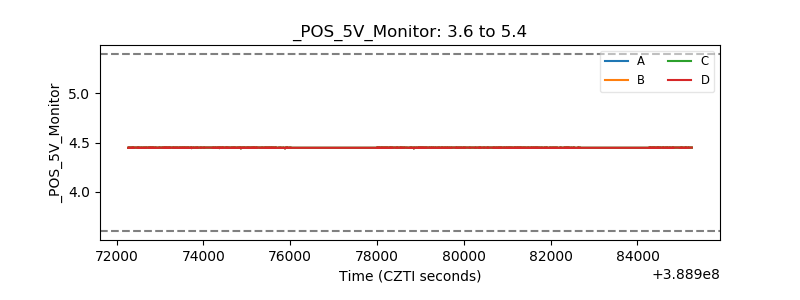 |
| _ROLL_ROT | 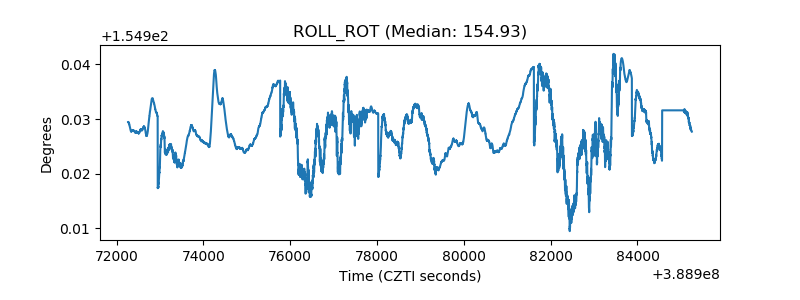 |
| _Roll_DEC | 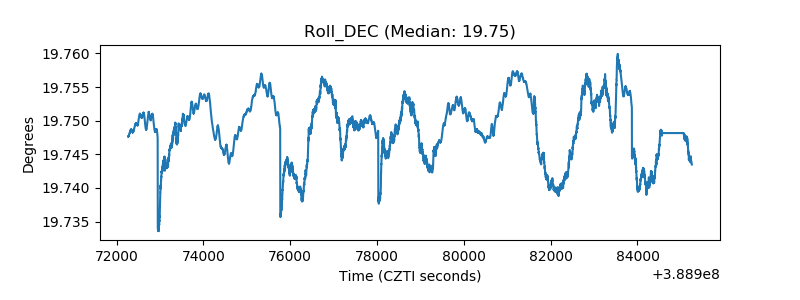 |
| _Roll_RA | 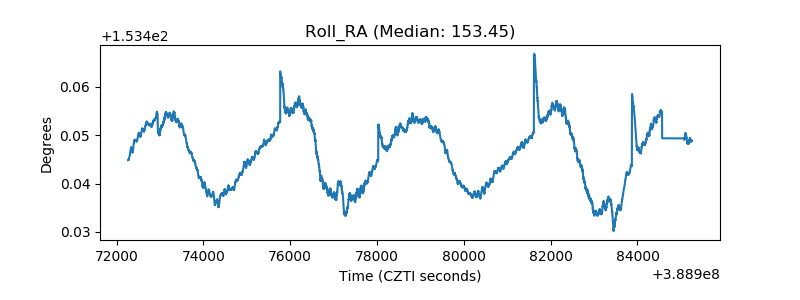 |
| Veto Counter | 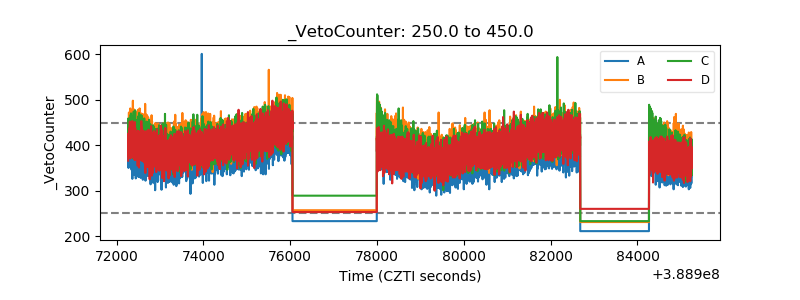 |