| Param | Original file | Final file |
|---|---|---|
| Filename | modeM0/AS1A10_065T04_9000005098_35611cztM0_level2.evt | modeM0/AS1A10_065T04_9000005098_35611cztM0_level2_quad_clean.evt |
| Size (bytes) | 441,227,520 | 56,036,160 |
| Size | 420.8 MB | 53.4 MB |
| Events in quadrant A | 2,407,929 | 356,918 |
| Events in quadrant B | 2,817,974 | 359,980 |
| Events in quadrant C | 2,959,509 | 341,363 |
| Events in quadrant D | 4,846,482 | 296,358 |
| Mode M9 | |||
|---|---|---|---|
| Quadrant | BADHDUFLAG | Total packets | Discarded packets |
| A | 0 | 35 | 0 |
| B | 0 | 35 | 0 |
| C | 0 | 35 | 0 |
| D | 0 | 36 | 0 |
| Mode M0 | |||
|---|---|---|---|
| Quadrant | BADHDUFLAG | Total packets | Discarded packets |
| A | 0 | 10118 | 3 |
| B | 0 | 11443 | 2 |
| C | 0 | 11589 | 2 |
| D | 0 | 17686 | 2 |
| Mode SS | |||
|---|---|---|---|
| Quadrant | BADHDUFLAG | Total packets | Discarded packets |
| A | 0 | 98 | 0 |
| B | 0 | 98 | 0 |
| C | 0 | 98 | 0 |
| D | 0 | 98 | 0 |
| Quadrant | Total seconds | Saturated seconds | Saturation percentage |
|---|---|---|---|
| A | 4872 | 9 | 0.184729% |
| B | 4872 | 123 | 2.524631% |
| C | 4872 | 164 | 3.366174% |
| D | 4872 | 824 | 16.912972% |
Noise dominated data is calculated using 1-second bins in cleaned event files. If a bin has >2000 counts, and if more than 50% of those come from <1% of pixels, then it is considered to be noise-dominated and hence unusable.
| Quadrant | # 1 sec bins | Bins with >0 counts | Bins with >2000 counts | High rate bins dominated by noise | Noise dominated (total time) | Noise dominated (detector-on time) | Marked lightcurve |
|---|---|---|---|---|---|---|---|
| A | 6966 | 4873 | 0 | 0 | 0.00% | 0.00% | 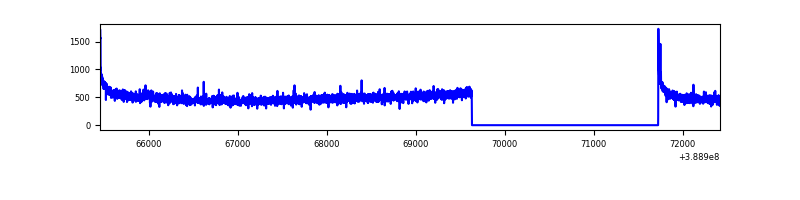 |
| B | 6966 | 4873 | 82 | 82 | 1.18% | 1.68% | 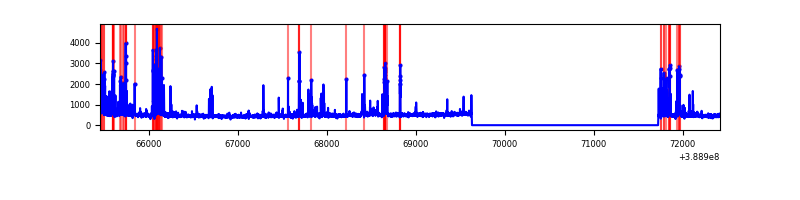 |
| C | 6966 | 4873 | 138 | 138 | 1.98% | 2.83% | 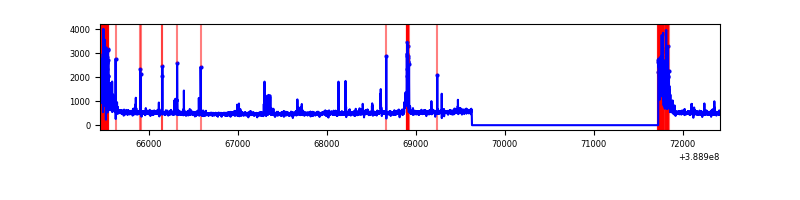 |
| D | 6966 | 4873 | 710 | 710 | 10.19% | 14.57% | 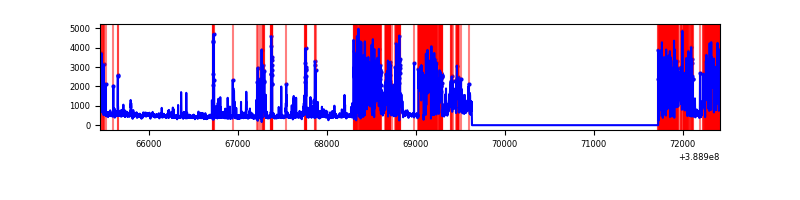 |
Top three noisy pixels from each quadrant. If the there are fewer than three noisy pixels in the level2.evt file, extra rows are filled as -1
| Pixel properties | Quadrant properties | ||||||
|---|---|---|---|---|---|---|---|
| Quadrant | DetID | PixID | Counts | Sigma | Mean | Median | Sigma |
| A | 10 | 83 | 132071 | 1122.84 | 578 | 568 | 117.1 |
| A | 8 | 6 | 17570 | 145.17 | 578 | 568 | 117.1 |
| A | 13 | 6 | 8007 | 63.52 | 578 | 568 | 117.1 |
| B | 5 | 172 | 453901 | 4107.74 | 573 | 558 | 110.4 |
| B | 3 | 112 | 83460 | 751.17 | 573 | 558 | 110.4 |
| B | 12 | 111 | 13439 | 116.71 | 573 | 558 | 110.4 |
| C | 0 | 10 | 495398 | 3858.92 | 552 | 555 | 128.2 |
| C | 15 | 214 | 199783 | 1553.63 | 552 | 555 | 128.2 |
| C | 12 | 249 | 92446 | 716.59 | 552 | 555 | 128.2 |
| D | 7 | 80 | 2523218 | 19690.99 | 511 | 497 | 128.1 |
| D | 12 | 233 | 172039 | 1338.96 | 511 | 497 | 128.1 |
| D | 8 | 195 | 51674 | 399.46 | 511 | 497 | 128.1 |
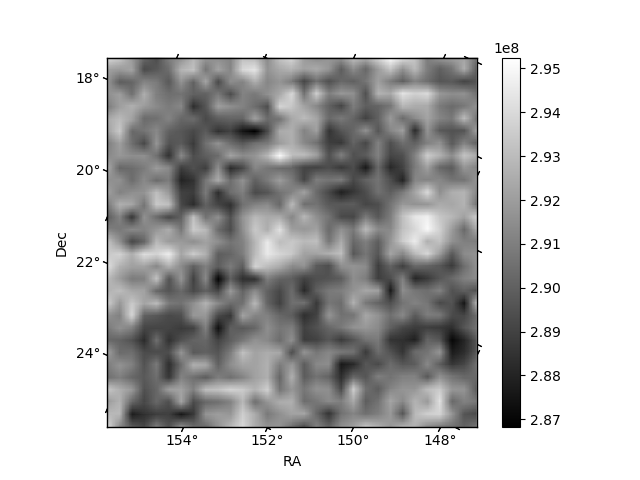
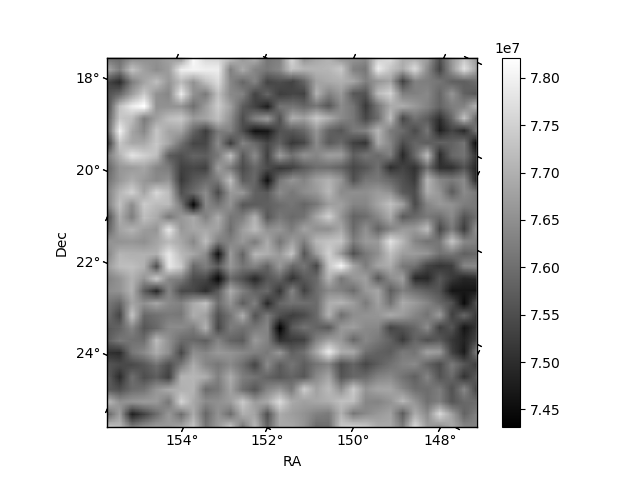
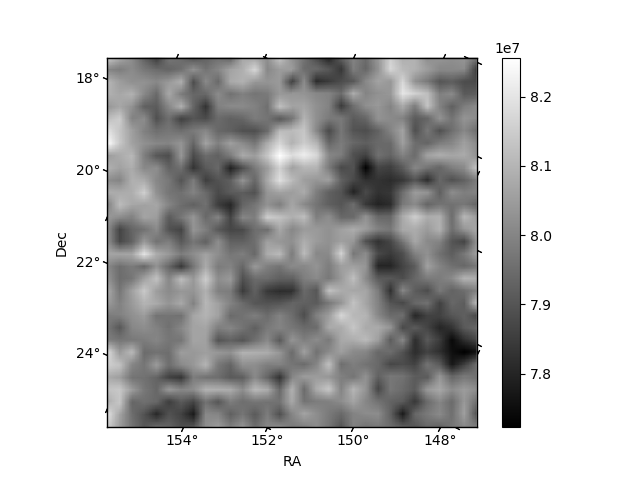
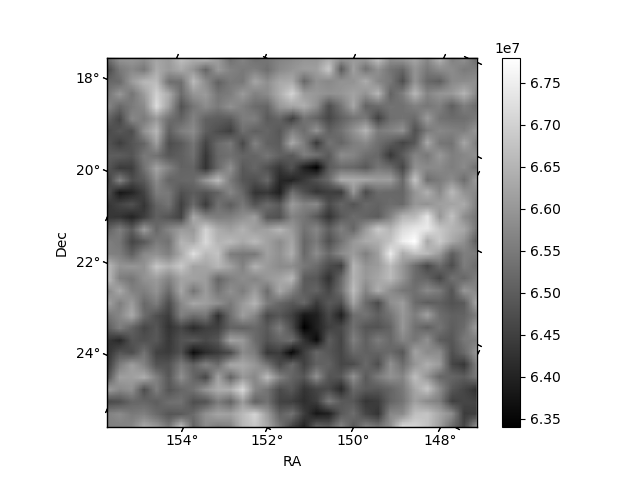
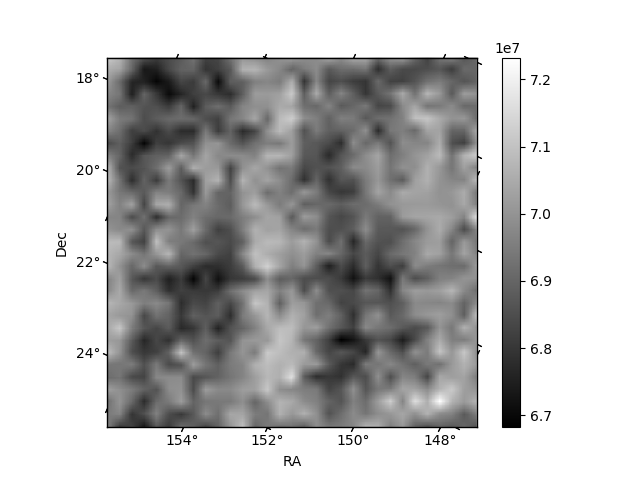
Histogram calculated using DETX and DETY for each event in the final _common_clean file
| Quadrant A | 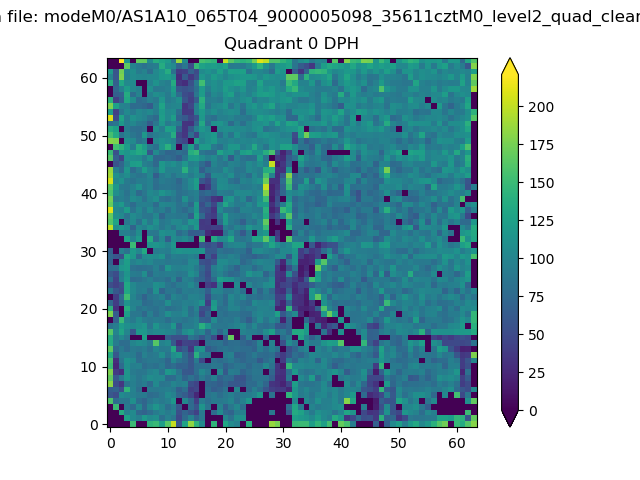 |
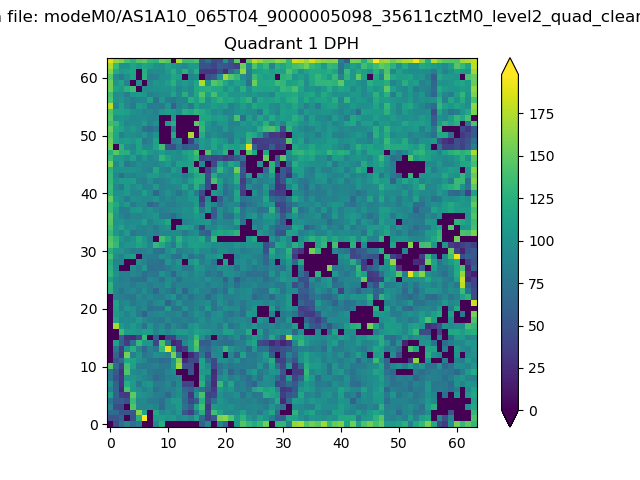 |
Quadrant B |
|---|---|---|---|
| Quadrant D | 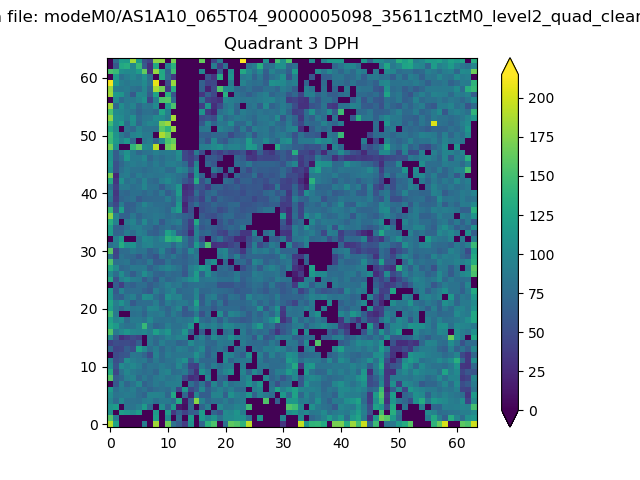 |
 |
Quadrant C |
| Plot type | Count rate plots | Images |
|---|---|---|
| Comparison with Poisson distribution Blue bars denote a histogram of data divided into 1 sec bins. Red curve is a Poisson curve with rate = median count rate of data. |
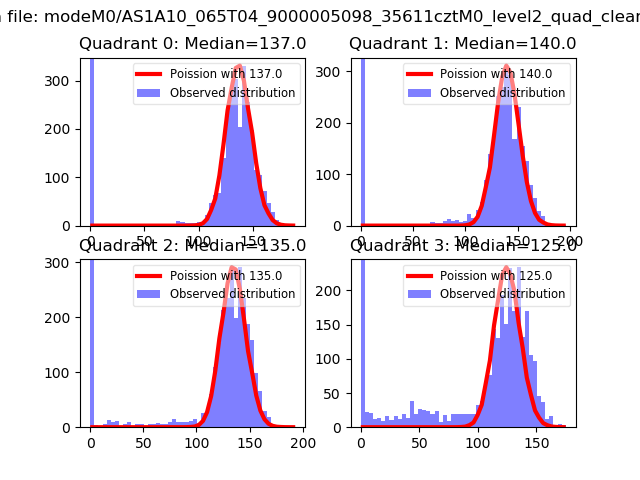 |
 |
| Quadrant-wise count rates Data is divided into 100 sec bins |
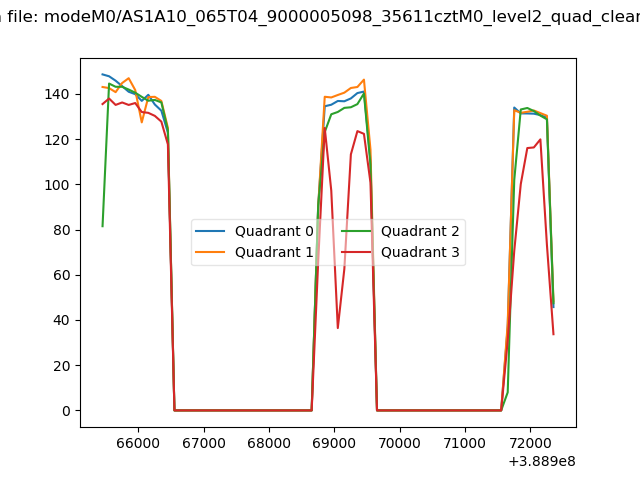 |
|
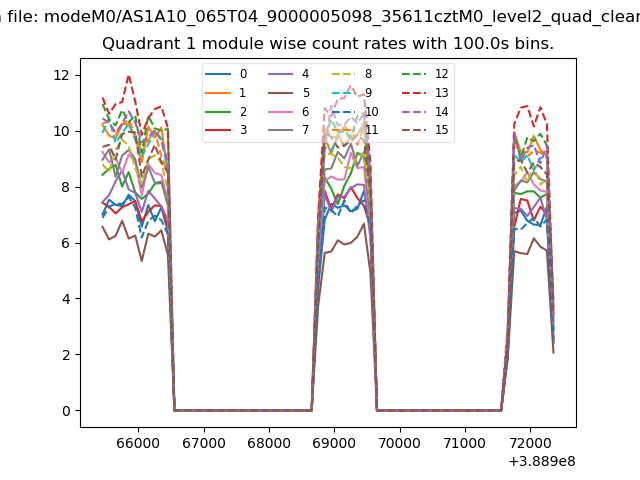
| Module-wise count rates for Quadrant A Data is divided into 100 sec bins |
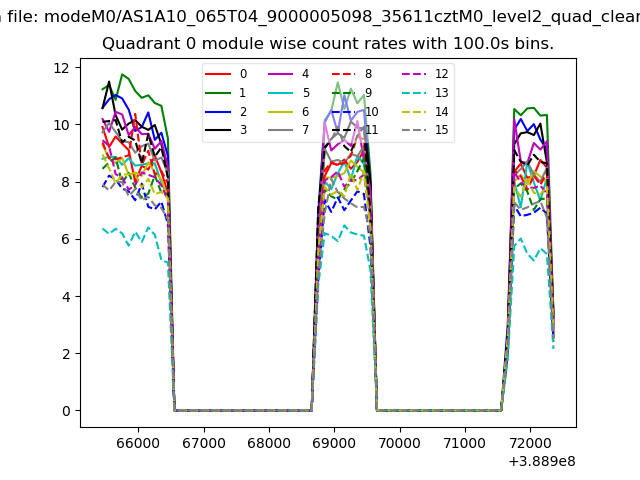 |
 |
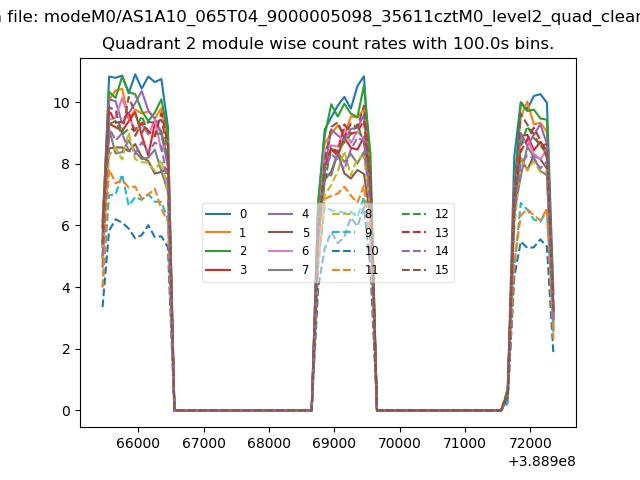
| Module-wise count rates for Quadrant B Data is divided into 100 sec bins |
 |
 |
| Module-wise count rates for Quadrant C Data is divided into 100 sec bins |
 |
 |
| Module-wise count rates for Quadrant D Data is divided into 100 sec bins |
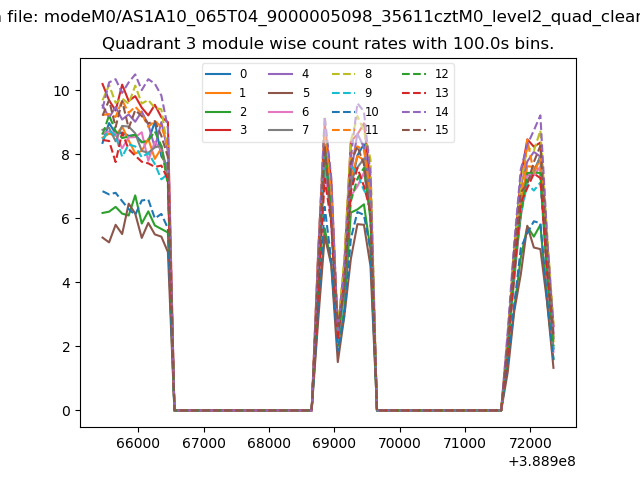 |
 |
| Parameter | Plot |
|---|---|
| CZT HV Monitor | 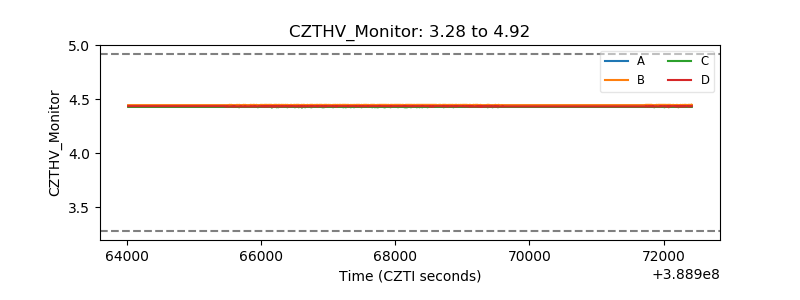 |
| D_VDD | 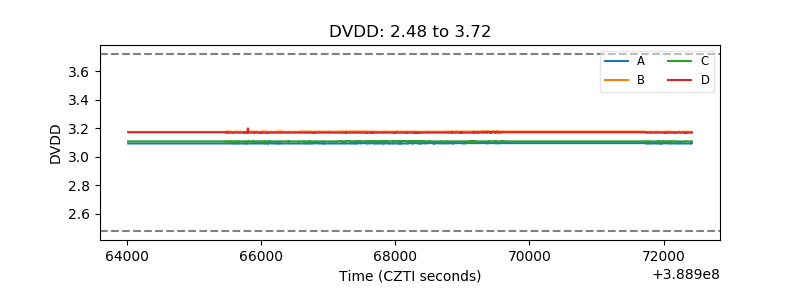 |
| Temperature 1 | 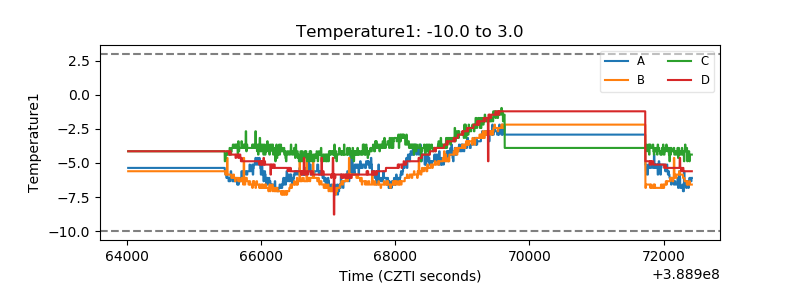 |
| Veto HV Monitor | 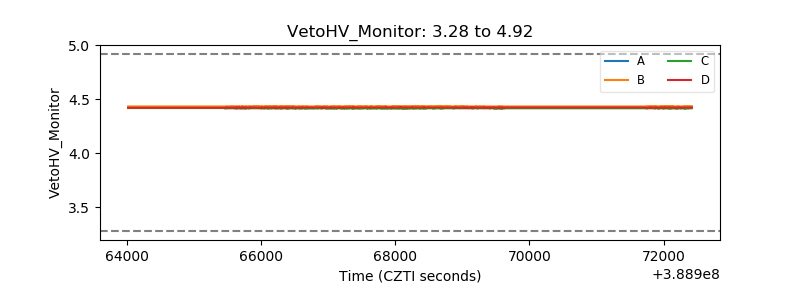 |
| Veto LLD | 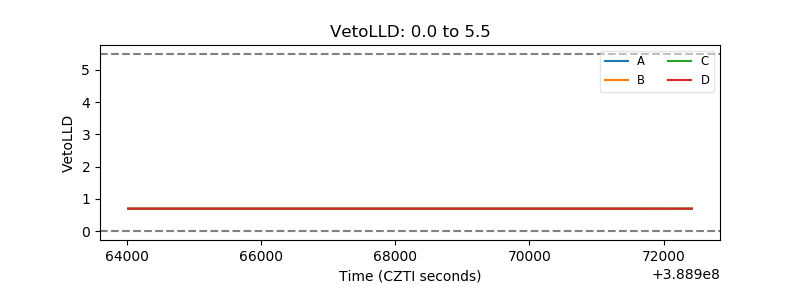 |
| Alpha Counter | 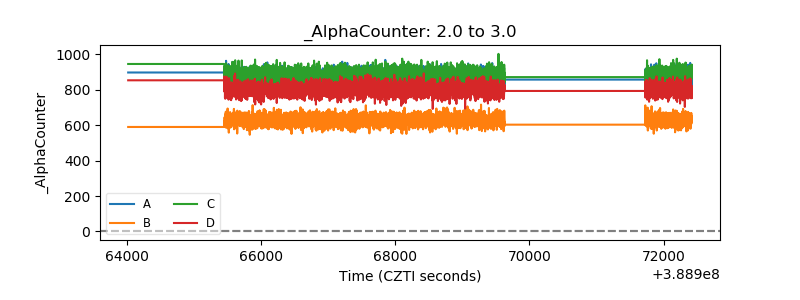 |
| _CPM_Rate | 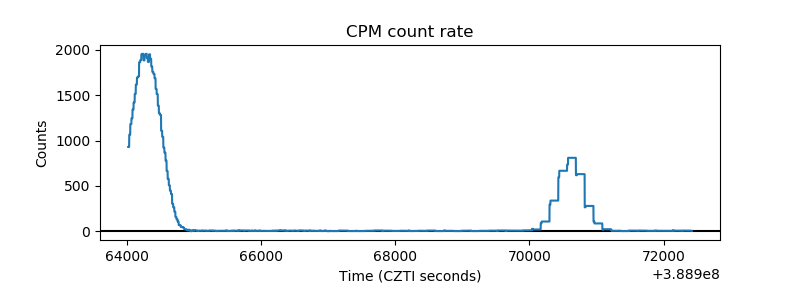 |
| CZT Counter | 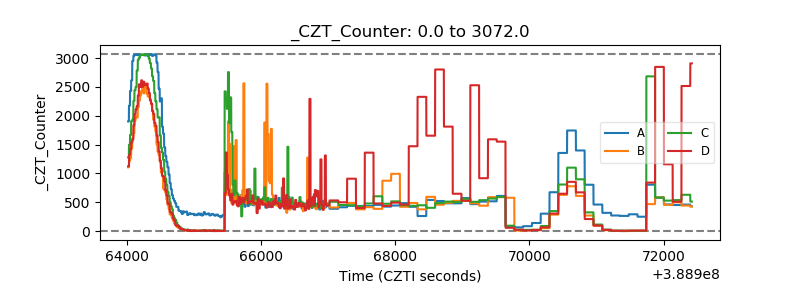 |
| +2.5 Volts monitor | 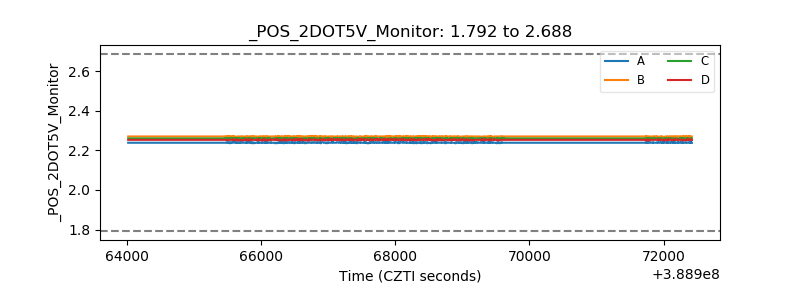 |
| +5 Volts monitor | 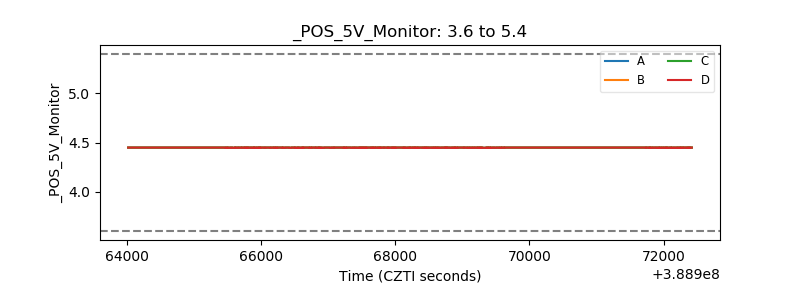 |
| _ROLL_ROT | 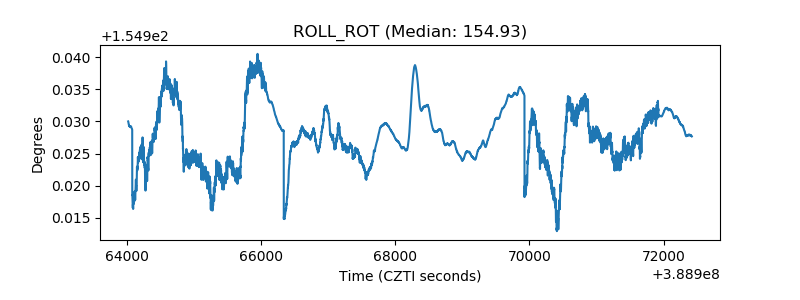 |
| _Roll_DEC | 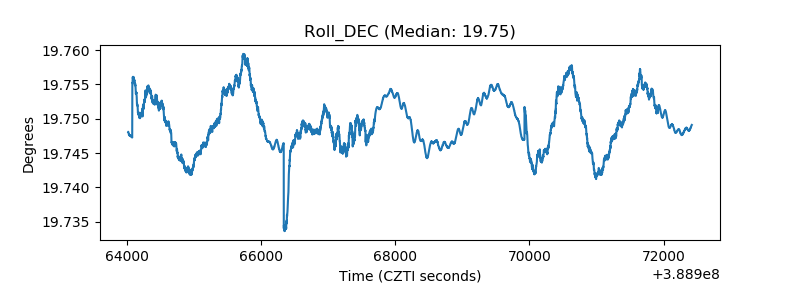 |
| _Roll_RA | 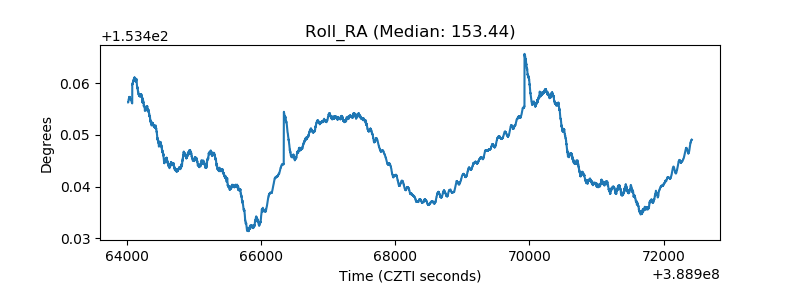 |
| Veto Counter | 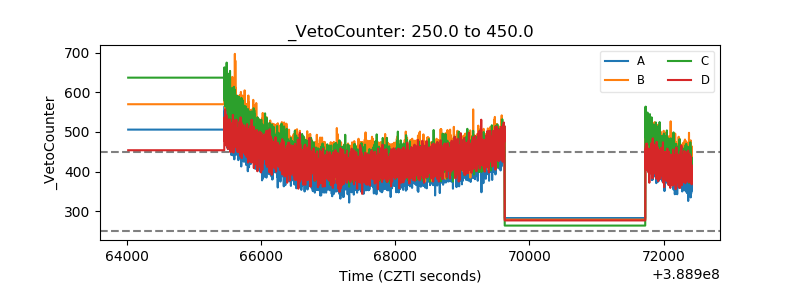 |