| Param | Original file | Final file |
|---|---|---|
| Filename | modeM0/AS1A10_065T04_9000005098_35610cztM0_level2.evt | modeM0/AS1A10_065T04_9000005098_35610cztM0_level2_quad_clean.evt |
| Size (bytes) | 436,098,240 | 61,678,080 |
| Size | 415.9 MB | 58.8 MB |
| Events in quadrant A | 2,492,116 | 395,376 |
| Events in quadrant B | 3,049,617 | 395,470 |
| Events in quadrant C | 2,964,671 | 378,250 |
| Events in quadrant D | 4,362,865 | 349,273 |
| Mode M9 | |||
|---|---|---|---|
| Quadrant | BADHDUFLAG | Total packets | Discarded packets |
| A | 0 | 37 | 0 |
| B | 0 | 37 | 0 |
| C | 0 | 37 | 0 |
| D | 0 | 38 | 0 |
| Mode M0 | |||
|---|---|---|---|
| Quadrant | BADHDUFLAG | Total packets | Discarded packets |
| A | 0 | 10396 | 3 |
| B | 0 | 12146 | 2 |
| C | 0 | 11664 | 2 |
| D | 0 | 16247 | 2 |
| Mode SS | |||
|---|---|---|---|
| Quadrant | BADHDUFLAG | Total packets | Discarded packets |
| A | 0 | 102 | 0 |
| B | 0 | 102 | 0 |
| C | 0 | 102 | 0 |
| D | 0 | 102 | 0 |
| Quadrant | Total seconds | Saturated seconds | Saturation percentage |
|---|---|---|---|
| A | 4971 | 3 | 0.060350% |
| B | 4971 | 165 | 3.319252% |
| C | 4971 | 162 | 3.258902% |
| D | 4971 | 516 | 10.380205% |
Noise dominated data is calculated using 1-second bins in cleaned event files. If a bin has >2000 counts, and if more than 50% of those come from <1% of pixels, then it is considered to be noise-dominated and hence unusable.
| Quadrant | # 1 sec bins | Bins with >0 counts | Bins with >2000 counts | High rate bins dominated by noise | Noise dominated (total time) | Noise dominated (detector-on time) | Marked lightcurve |
|---|---|---|---|---|---|---|---|
| A | 7094 | 4972 | 0 | 0 | 0.00% | 0.00% | 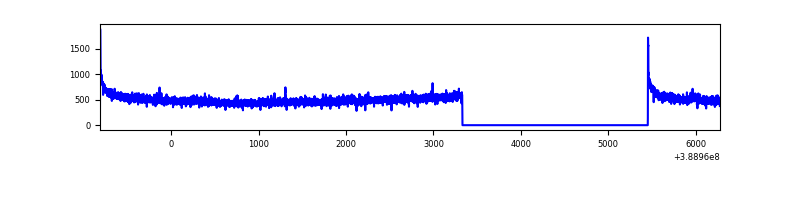 |
| B | 7094 | 4972 | 118 | 118 | 1.66% | 2.37% | 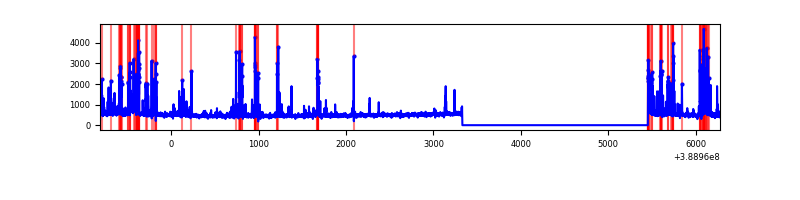 |
| C | 7094 | 4972 | 120 | 120 | 1.69% | 2.41% | 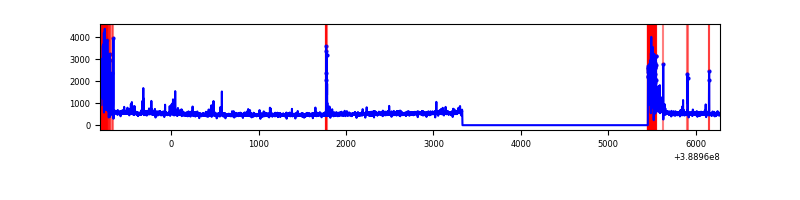 |
| D | 7094 | 4972 | 438 | 438 | 6.17% | 8.81% | 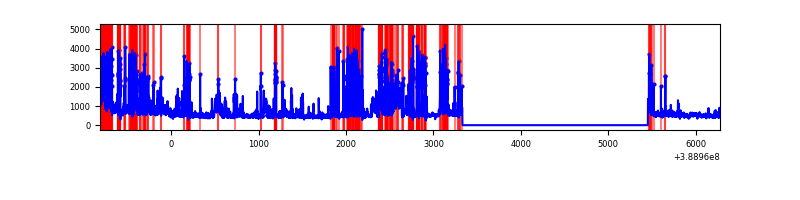 |
Top three noisy pixels from each quadrant. If the there are fewer than three noisy pixels in the level2.evt file, extra rows are filled as -1
| Pixel properties | Quadrant properties | ||||||
|---|---|---|---|---|---|---|---|
| Quadrant | DetID | PixID | Counts | Sigma | Mean | Median | Sigma |
| A | 10 | 83 | 133192 | 1090.26 | 601 | 590 | 121.6 |
| A | 8 | 6 | 11621 | 90.7 | 601 | 590 | 121.6 |
| A | 13 | 6 | 9682 | 74.75 | 601 | 590 | 121.6 |
| B | 5 | 172 | 593181 | 5197.49 | 595 | 582 | 114.0 |
| B | 3 | 112 | 84060 | 732.16 | 595 | 582 | 114.0 |
| B | 10 | 245 | 15796 | 133.44 | 595 | 582 | 114.0 |
| C | 0 | 10 | 440450 | 3313.56 | 576 | 581 | 132.7 |
| C | 15 | 214 | 204251 | 1534.26 | 576 | 581 | 132.7 |
| C | 12 | 249 | 58633 | 437.31 | 576 | 581 | 132.7 |
| D | 7 | 80 | 1624476 | 11917.72 | 554 | 538 | 136.3 |
| D | 2 | 249 | 216490 | 1584.82 | 554 | 538 | 136.3 |
| D | 1 | 52 | 145390 | 1063.04 | 554 | 538 | 136.3 |
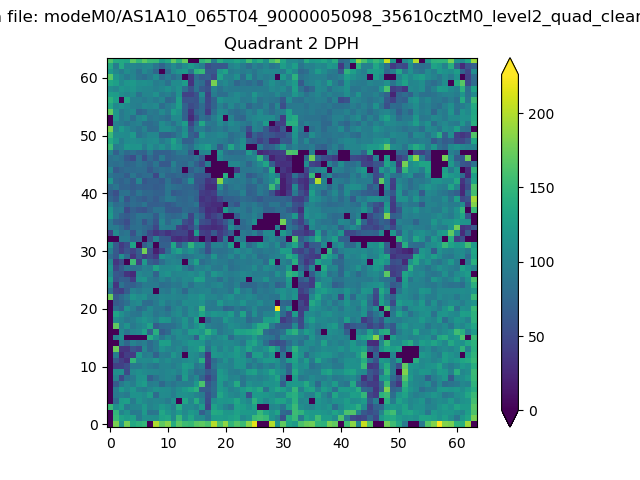
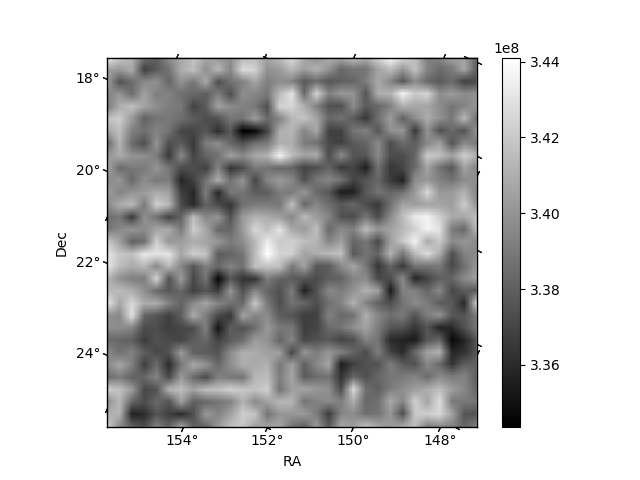
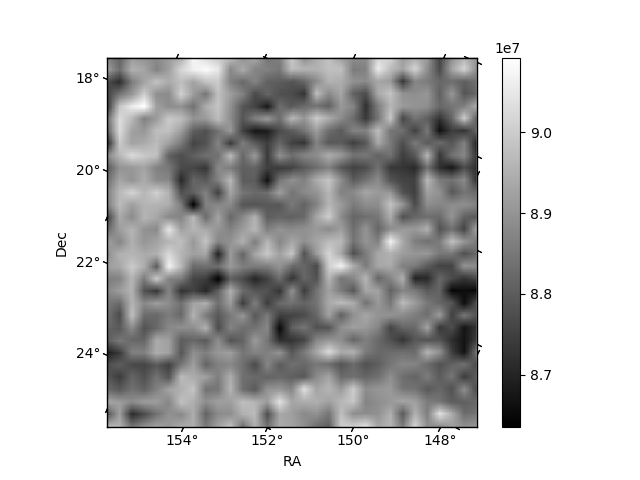
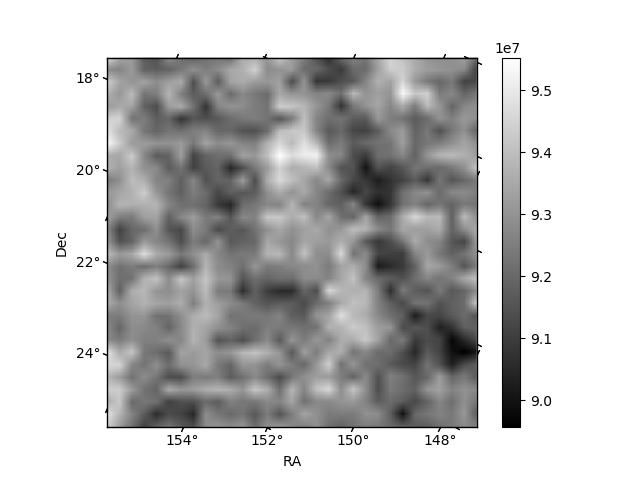
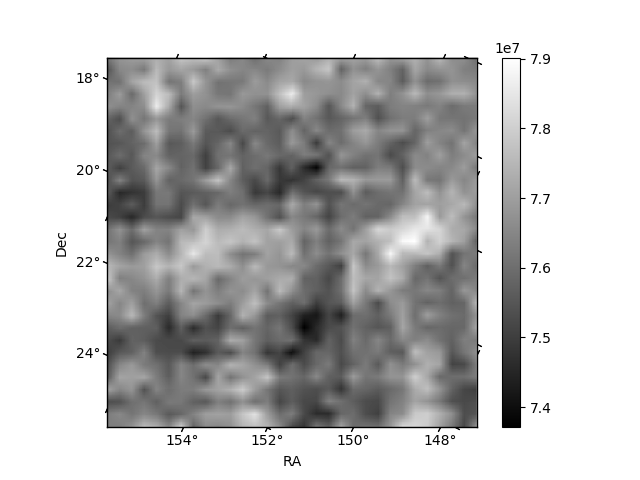
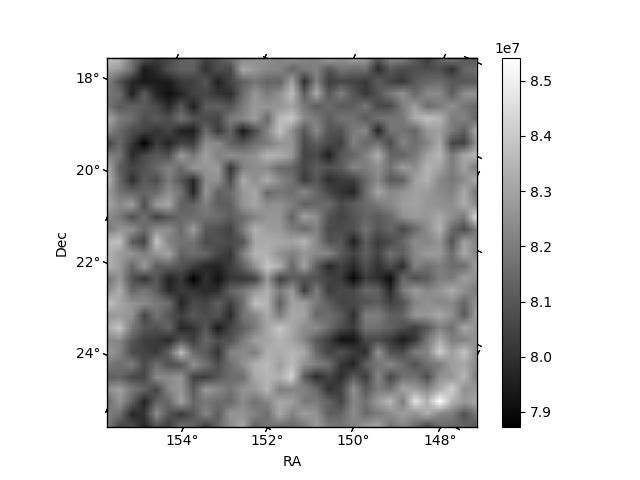
Histogram calculated using DETX and DETY for each event in the final _common_clean file
| Quadrant A | 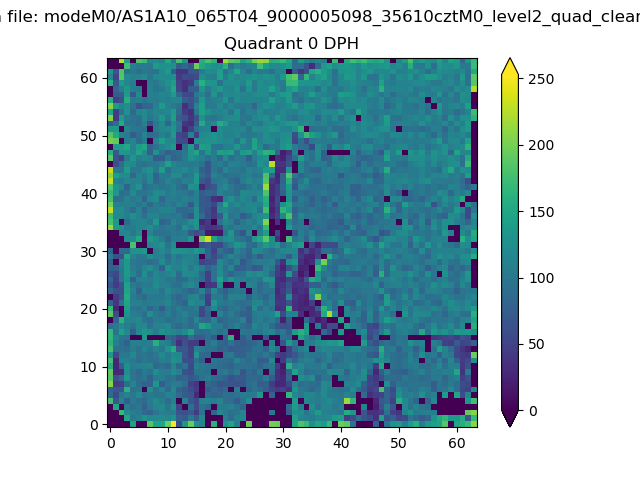 |
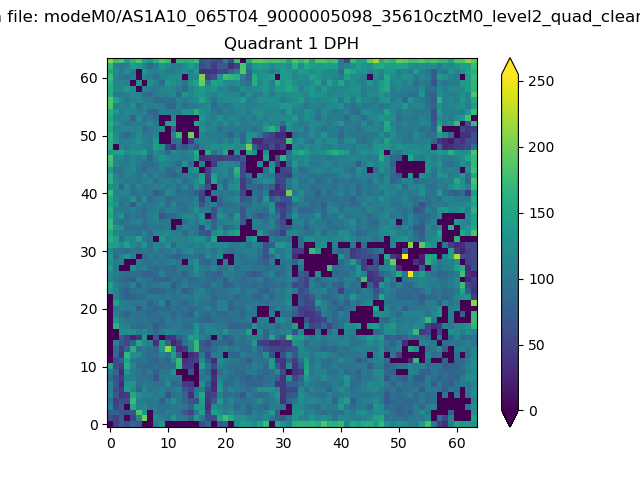 |
Quadrant B |
|---|---|---|---|
| Quadrant D | 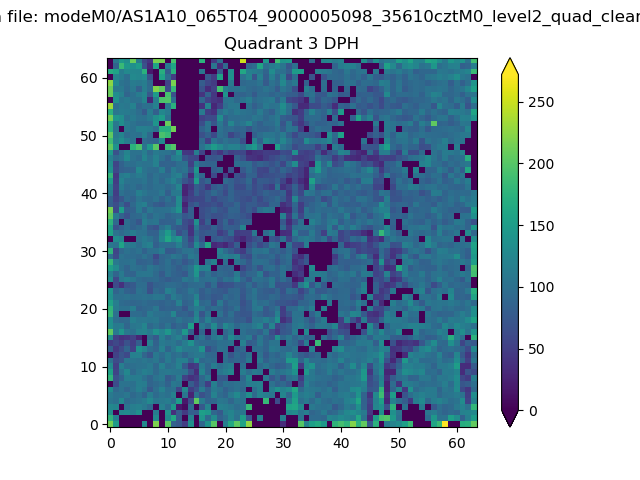 |
 |
Quadrant C |
| Plot type | Count rate plots | Images |
|---|---|---|
| Comparison with Poisson distribution Blue bars denote a histogram of data divided into 1 sec bins. Red curve is a Poisson curve with rate = median count rate of data. |
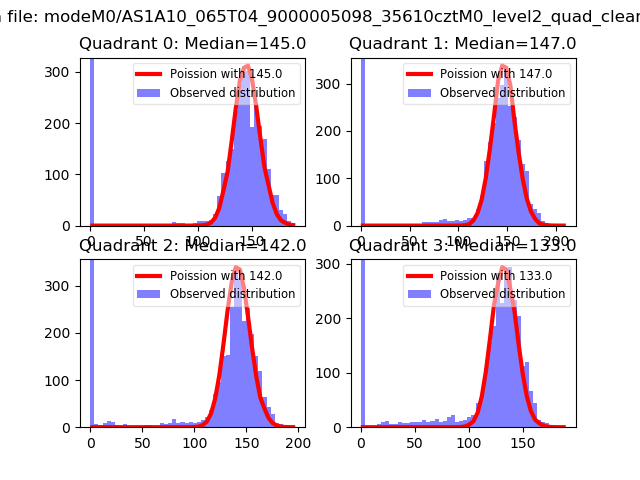 |
 |
| Quadrant-wise count rates Data is divided into 100 sec bins |
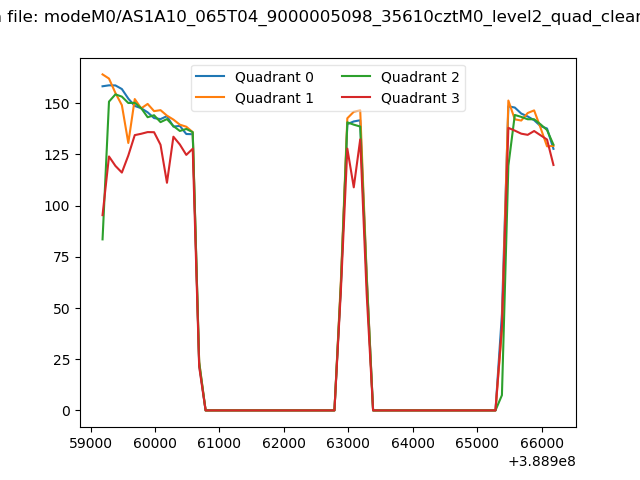 |
|
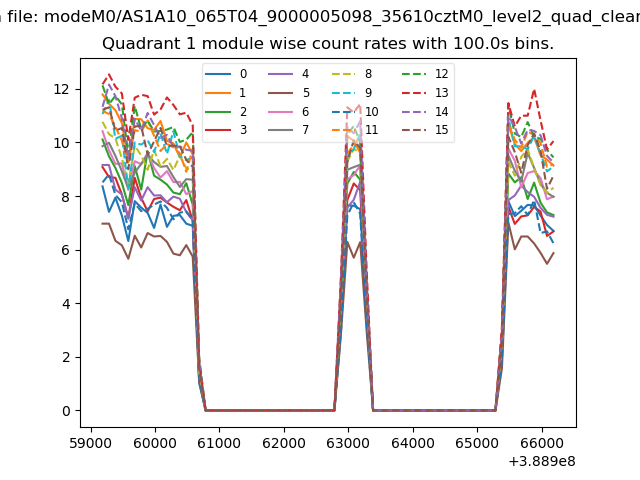
| Module-wise count rates for Quadrant A Data is divided into 100 sec bins |
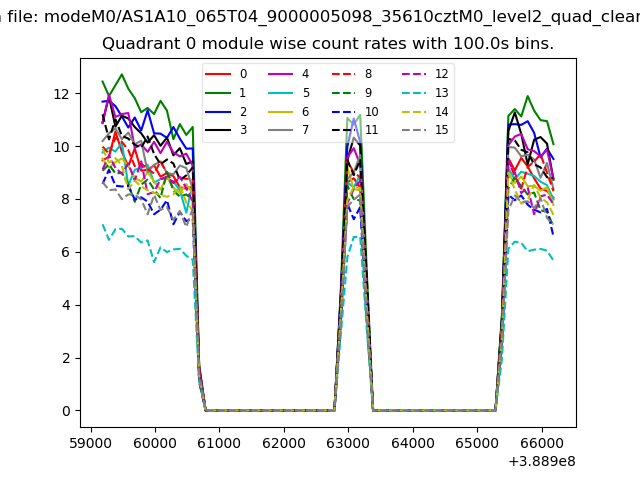 |
 |
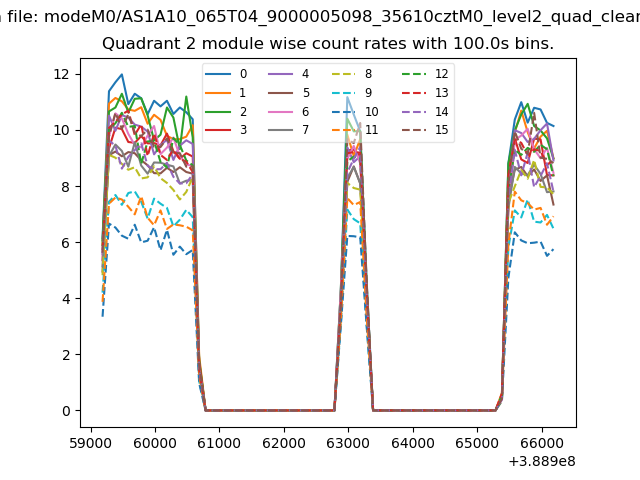
| Module-wise count rates for Quadrant B Data is divided into 100 sec bins |
 |
 |
| Module-wise count rates for Quadrant C Data is divided into 100 sec bins |
 |
 |
| Module-wise count rates for Quadrant D Data is divided into 100 sec bins |
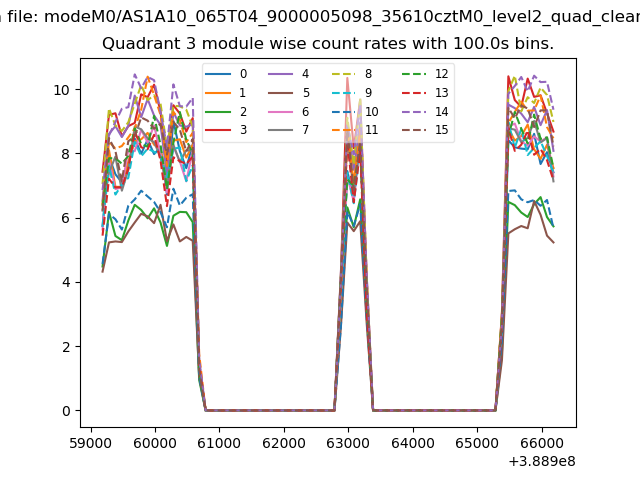 |
 |
| Parameter | Plot |
|---|---|
| CZT HV Monitor | 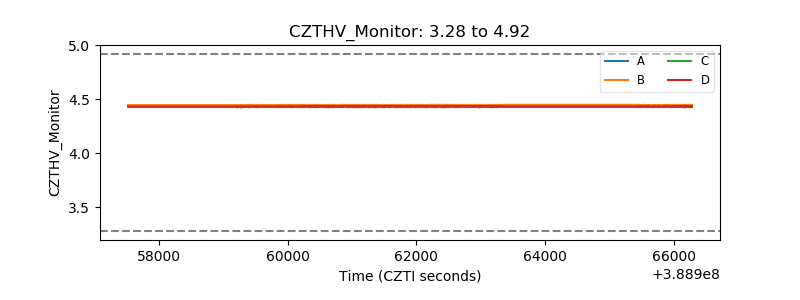 |
| D_VDD | 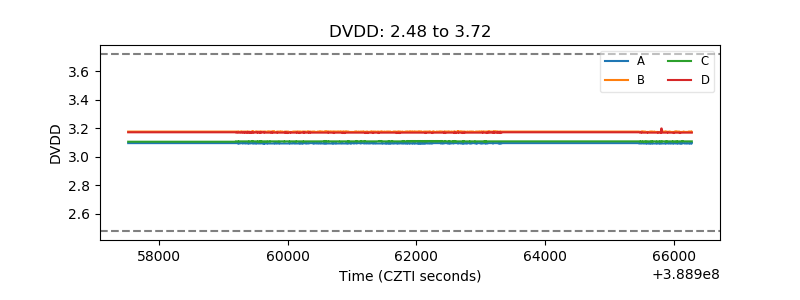 |
| Temperature 1 | 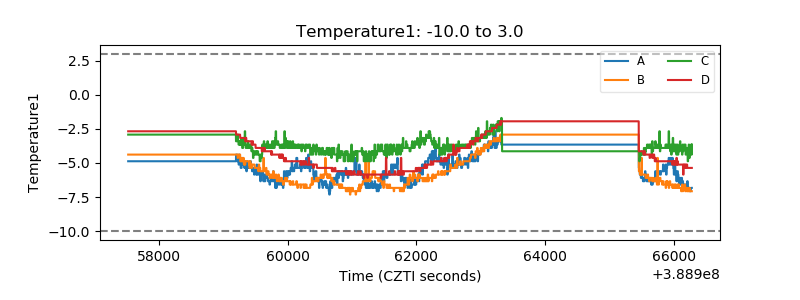 |
| Veto HV Monitor | 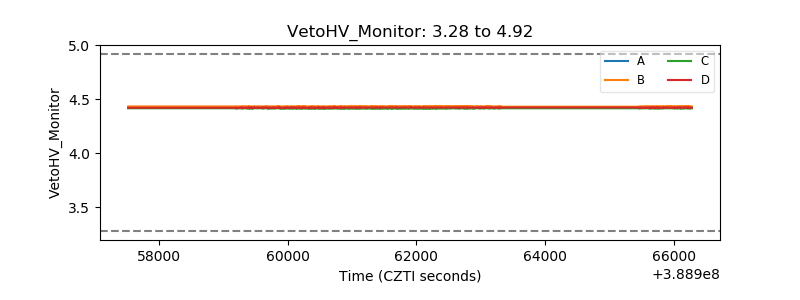 |
| Veto LLD | 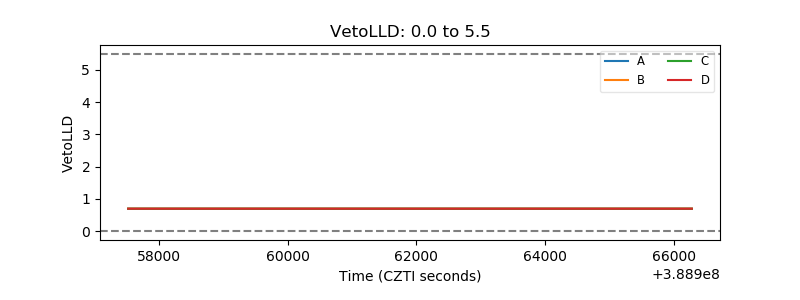 |
| Alpha Counter | 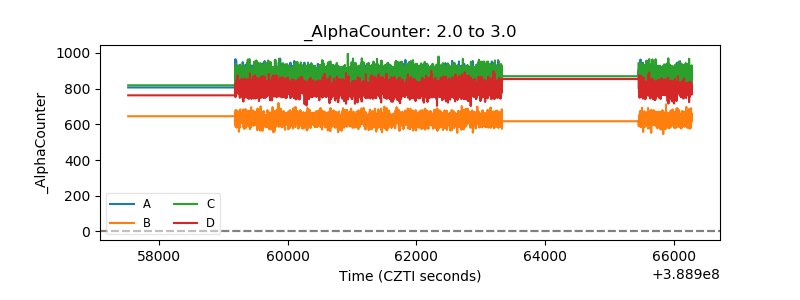 |
| _CPM_Rate | 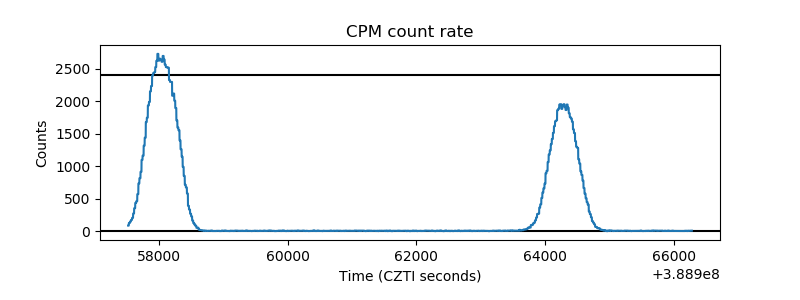 |
| CZT Counter | 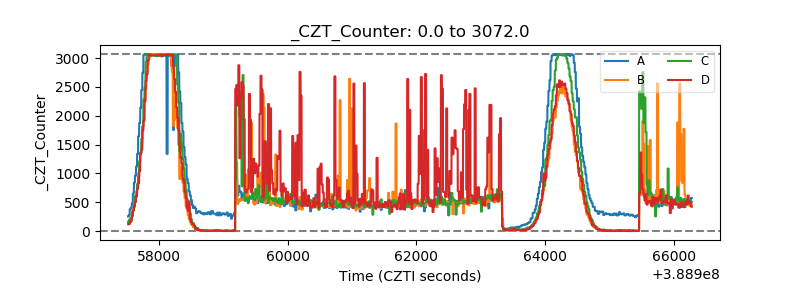 |
| +2.5 Volts monitor | 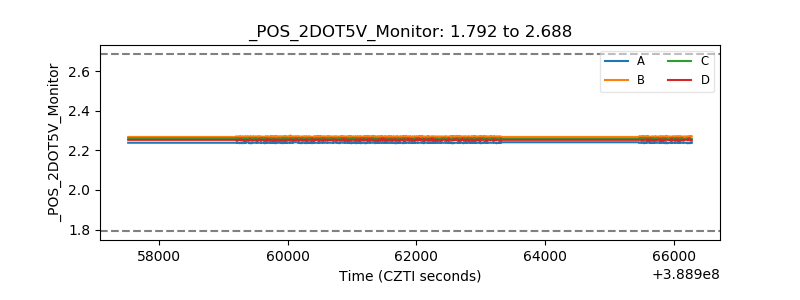 |
| +5 Volts monitor | 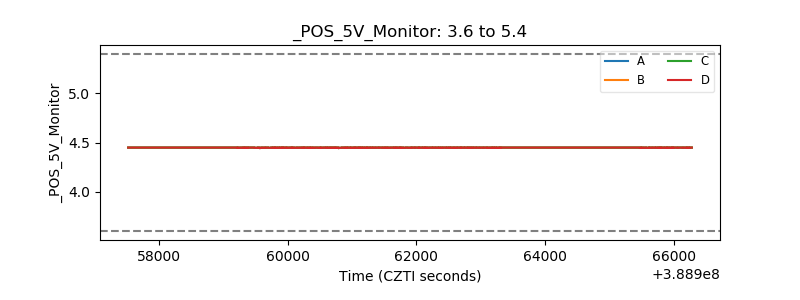 |
| _ROLL_ROT | 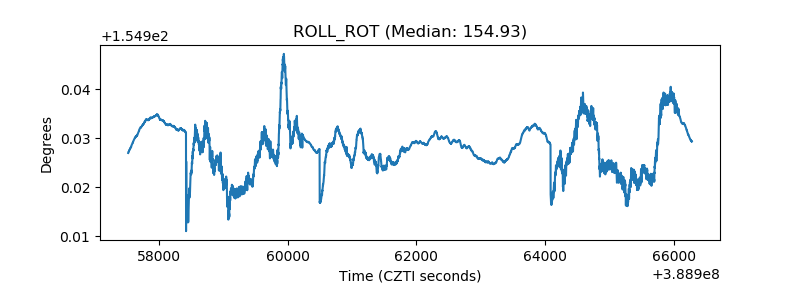 |
| _Roll_DEC | 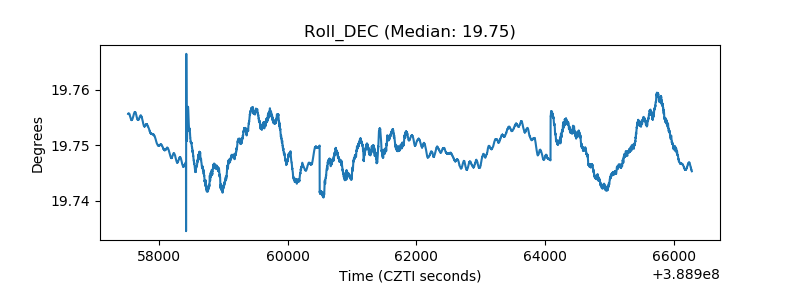 |
| _Roll_RA | 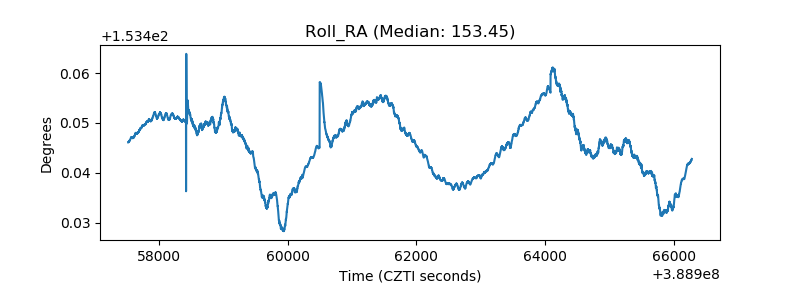 |
| Veto Counter | 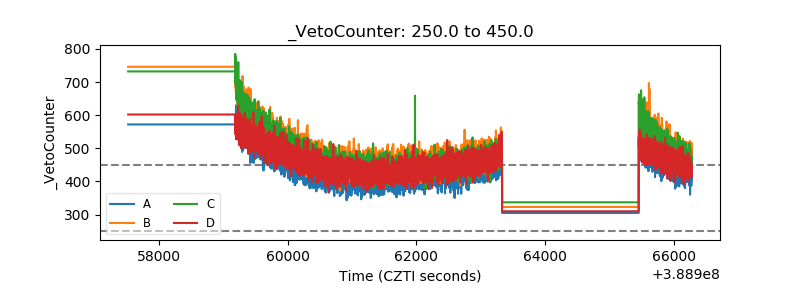 |