| Param | Original file | Final file |
|---|---|---|
| Filename | modeM0/AS1A10_065T04_9000005098_35609cztM0_level2.evt | modeM0/AS1A10_065T04_9000005098_35609cztM0_level2_quad_clean.evt |
| Size (bytes) | 447,840,000 | 62,242,560 |
| Size | 427.1 MB | 59.4 MB |
| Events in quadrant A | 2,508,184 | 404,993 |
| Events in quadrant B | 3,632,995 | 388,774 |
| Events in quadrant C | 3,037,035 | 387,506 |
| Events in quadrant D | 4,046,284 | 353,562 |
| Mode M9 | |||
|---|---|---|---|
| Quadrant | BADHDUFLAG | Total packets | Discarded packets |
| A | 0 | 27 | 0 |
| B | 0 | 27 | 0 |
| C | 0 | 27 | 0 |
| D | 0 | 28 | 0 |
| Mode M0 | |||
|---|---|---|---|
| Quadrant | BADHDUFLAG | Total packets | Discarded packets |
| A | 0 | 10474 | 3 |
| B | 0 | 13901 | 2 |
| C | 0 | 11927 | 2 |
| D | 0 | 15340 | 2 |
| Mode SS | |||
|---|---|---|---|
| Quadrant | BADHDUFLAG | Total packets | Discarded packets |
| A | 0 | 104 | 0 |
| B | 0 | 104 | 0 |
| C | 0 | 104 | 0 |
| D | 0 | 104 | 0 |
| Quadrant | Total seconds | Saturated seconds | Saturation percentage |
|---|---|---|---|
| A | 4974 | 6 | 0.120627% |
| B | 4974 | 391 | 7.860877% |
| C | 4974 | 168 | 3.377563% |
| D | 4974 | 368 | 7.398472% |
Noise dominated data is calculated using 1-second bins in cleaned event files. If a bin has >2000 counts, and if more than 50% of those come from <1% of pixels, then it is considered to be noise-dominated and hence unusable.
| Quadrant | # 1 sec bins | Bins with >0 counts | Bins with >2000 counts | High rate bins dominated by noise | Noise dominated (total time) | Noise dominated (detector-on time) | Marked lightcurve |
|---|---|---|---|---|---|---|---|
| A | 7036 | 4975 | 0 | 0 | 0.00% | 0.00% | 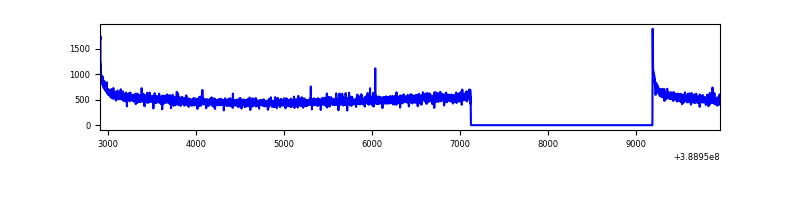 |
| B | 7036 | 4975 | 279 | 279 | 3.97% | 5.61% | 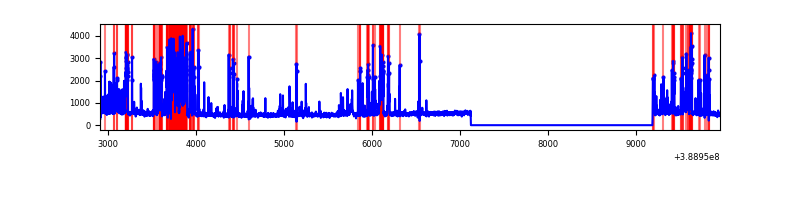 |
| C | 7036 | 4975 | 121 | 121 | 1.72% | 2.43% | 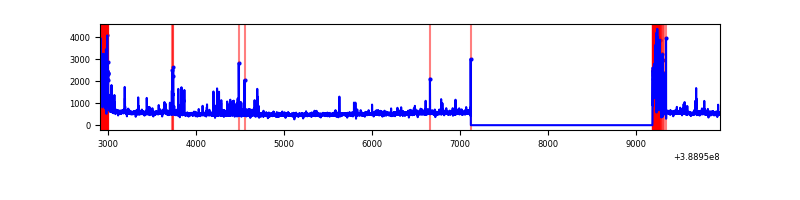 |
| D | 7036 | 4975 | 342 | 342 | 4.86% | 6.87% | 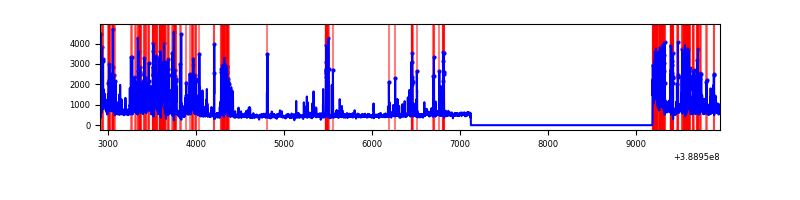 |
Top three noisy pixels from each quadrant. If the there are fewer than three noisy pixels in the level2.evt file, extra rows are filled as -1
| Pixel properties | Quadrant properties | ||||||
|---|---|---|---|---|---|---|---|
| Quadrant | DetID | PixID | Counts | Sigma | Mean | Median | Sigma |
| A | 10 | 83 | 135388 | 1103.25 | 608 | 597 | 122.2 |
| A | 8 | 6 | 10816 | 83.64 | 608 | 597 | 122.2 |
| A | 13 | 254 | 6717 | 50.09 | 608 | 597 | 122.2 |
| B | 5 | 172 | 1075079 | 9544.88 | 590 | 576 | 112.6 |
| B | 3 | 112 | 132644 | 1173.17 | 590 | 576 | 112.6 |
| B | 4 | 81 | 29296 | 255.12 | 590 | 576 | 112.6 |
| C | 0 | 10 | 482694 | 3555.14 | 586 | 592 | 135.6 |
| C | 15 | 214 | 204067 | 1500.47 | 586 | 592 | 135.6 |
| C | 12 | 249 | 45319 | 329.82 | 586 | 592 | 135.6 |
| D | 7 | 80 | 1133356 | 8109.92 | 570 | 556 | 139.7 |
| D | 2 | 249 | 183515 | 1309.84 | 570 | 556 | 139.7 |
| D | 8 | 195 | 118050 | 841.16 | 570 | 556 | 139.7 |
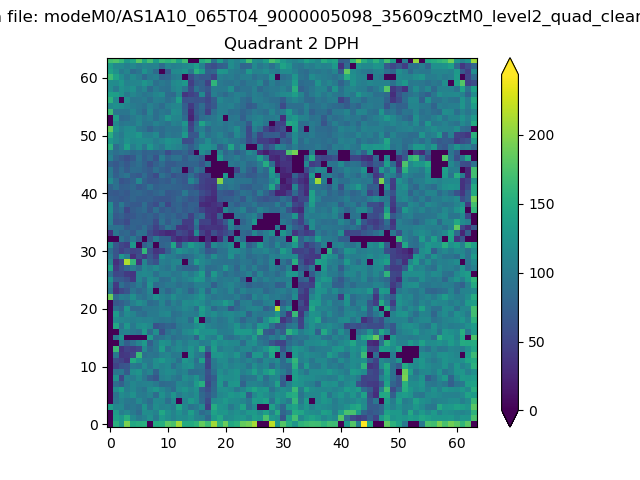
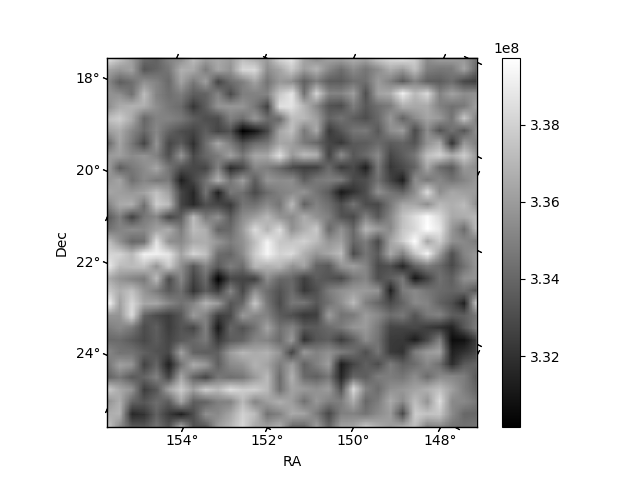
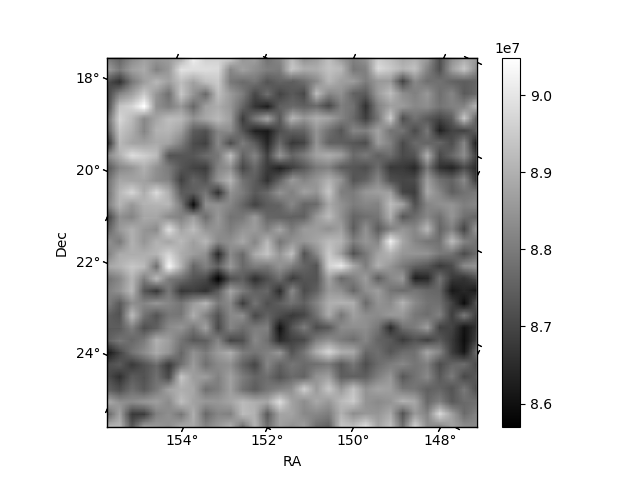
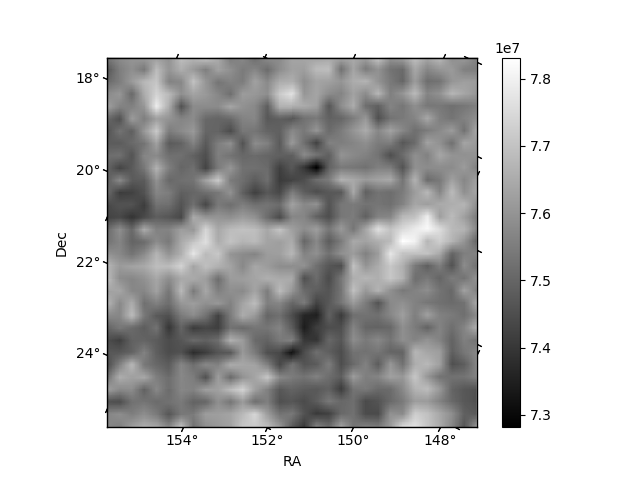
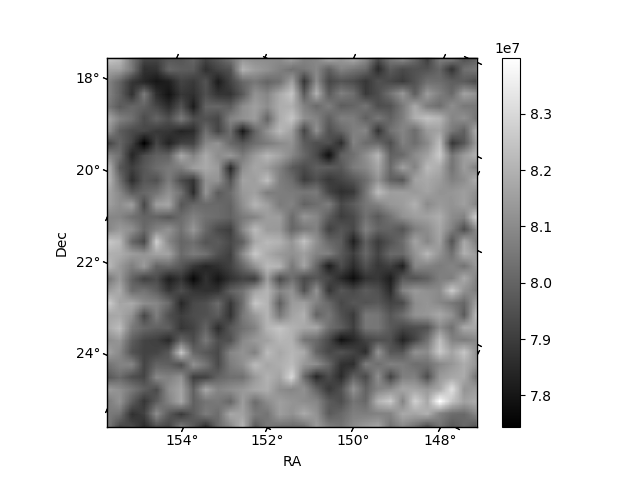
Histogram calculated using DETX and DETY for each event in the final _common_clean file
| Quadrant A | 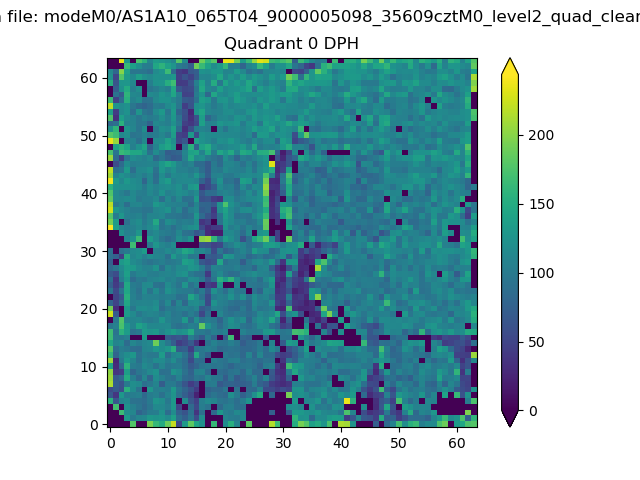 |
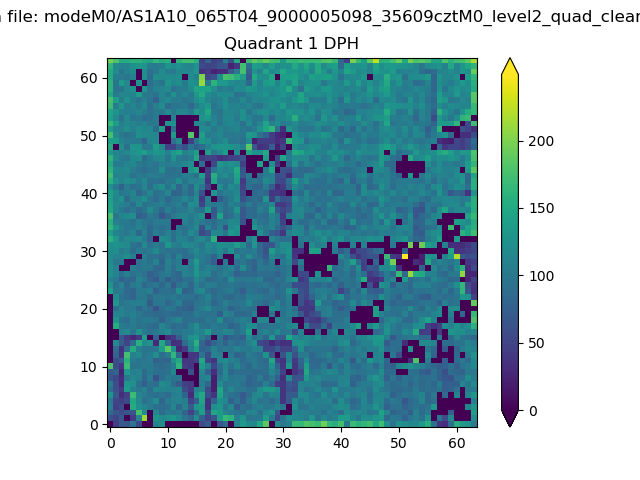 |
Quadrant B |
|---|---|---|---|
| Quadrant D | 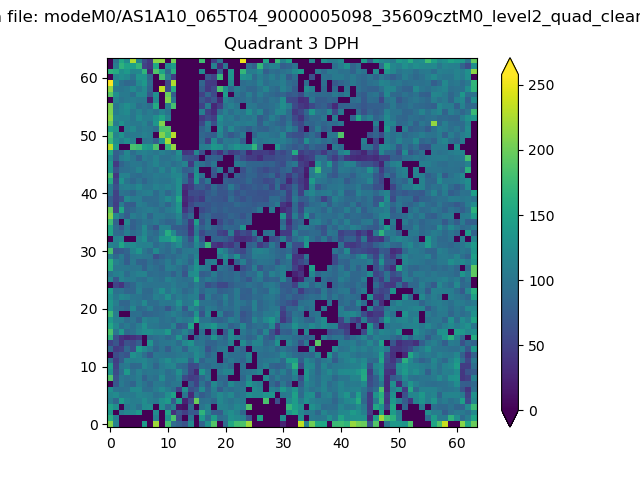 |
 |
Quadrant C |
| Plot type | Count rate plots | Images |
|---|---|---|
| Comparison with Poisson distribution Blue bars denote a histogram of data divided into 1 sec bins. Red curve is a Poisson curve with rate = median count rate of data. |
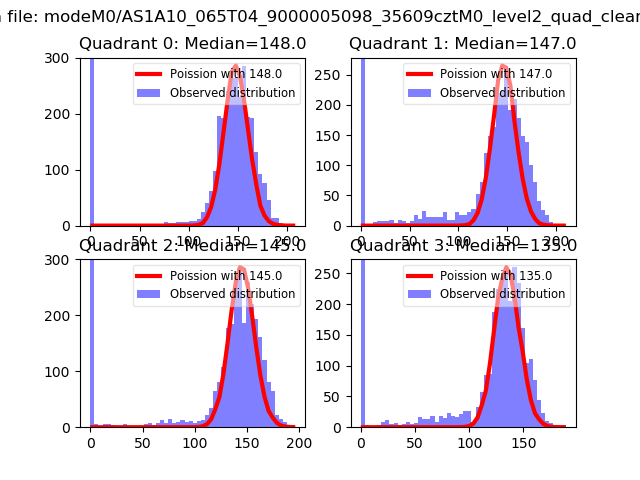 |
 |
| Quadrant-wise count rates Data is divided into 100 sec bins |
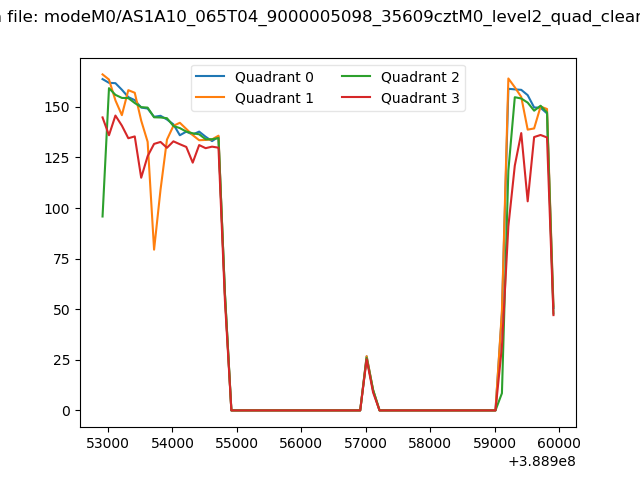 |
|
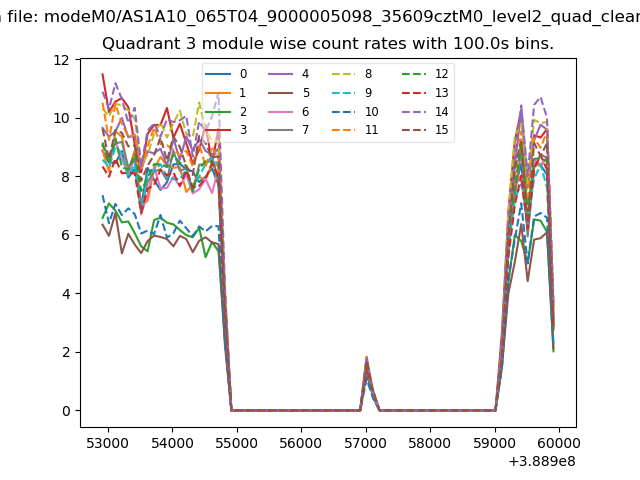
| Module-wise count rates for Quadrant A Data is divided into 100 sec bins |
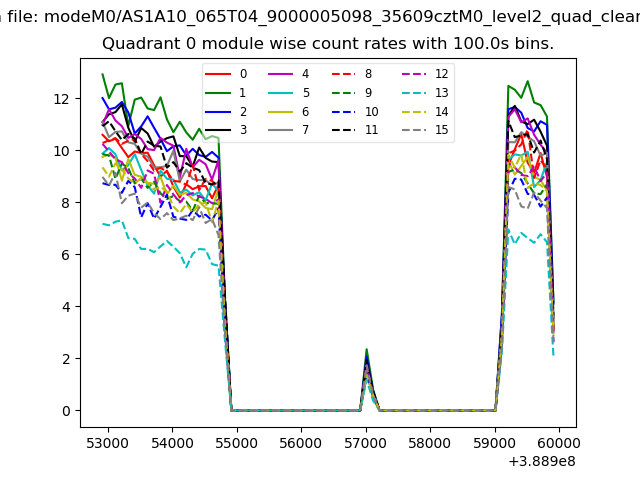 |
 |
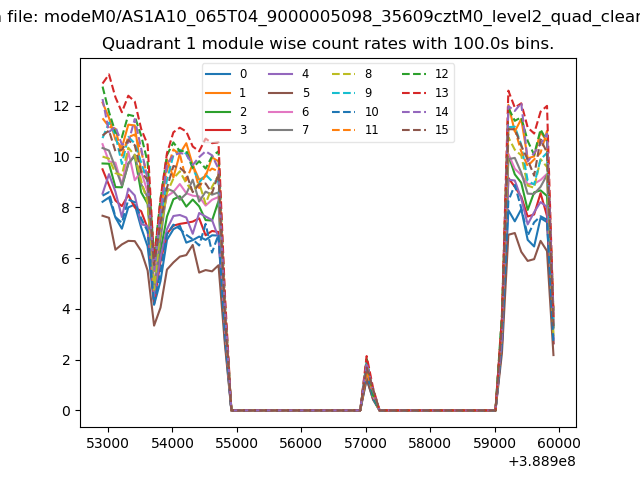
| Module-wise count rates for Quadrant B Data is divided into 100 sec bins |
 |
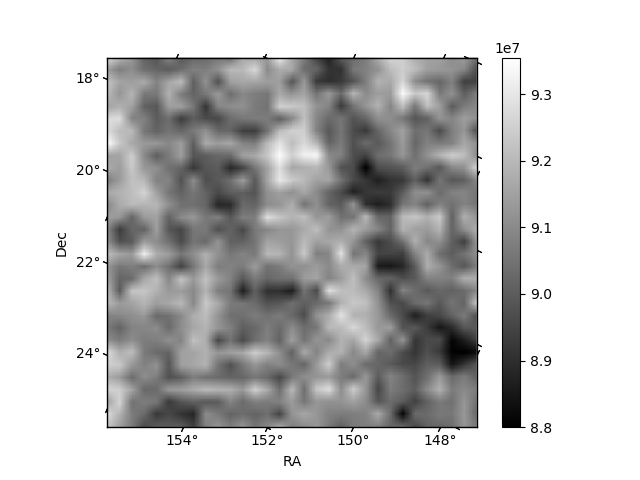 |
| Module-wise count rates for Quadrant C Data is divided into 100 sec bins |
 |
 |
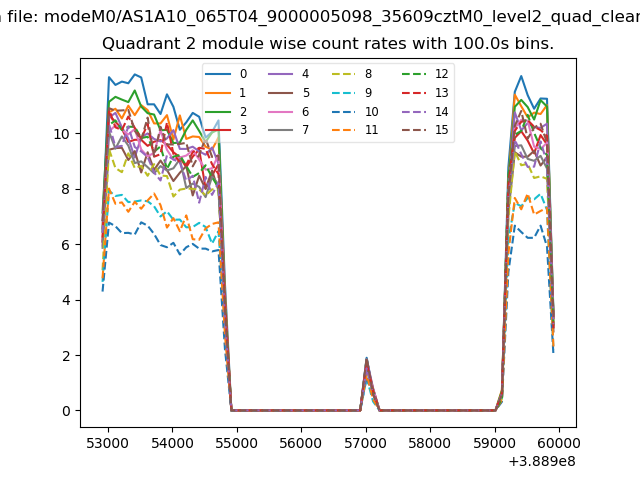
| Module-wise count rates for Quadrant D Data is divided into 100 sec bins |
 |
 |
| Parameter | Plot |
|---|---|
| CZT HV Monitor | 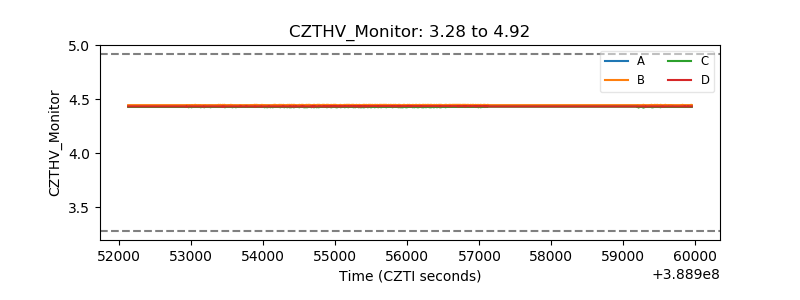 |
| D_VDD |  |
| Temperature 1 | 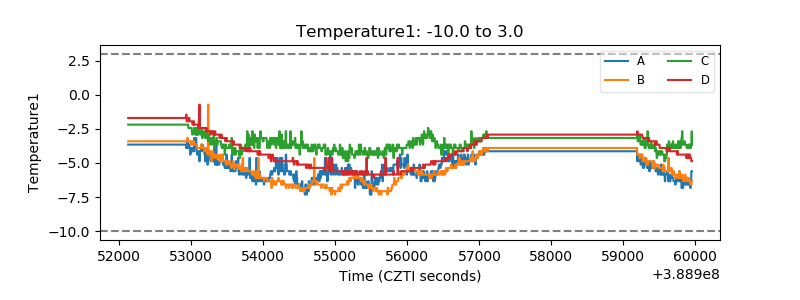 |
| Veto HV Monitor | 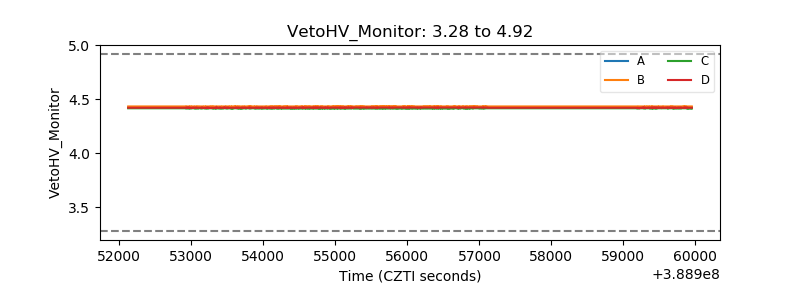 |
| Veto LLD | 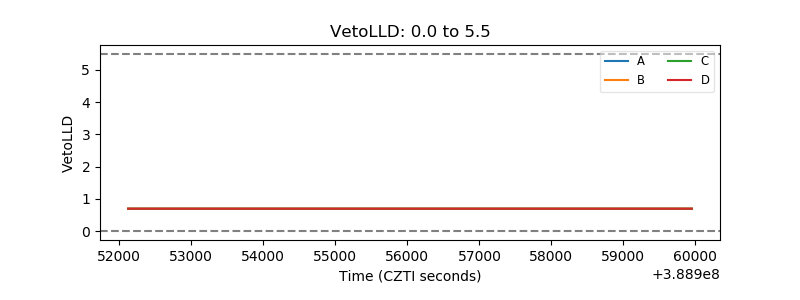 |
| Alpha Counter | 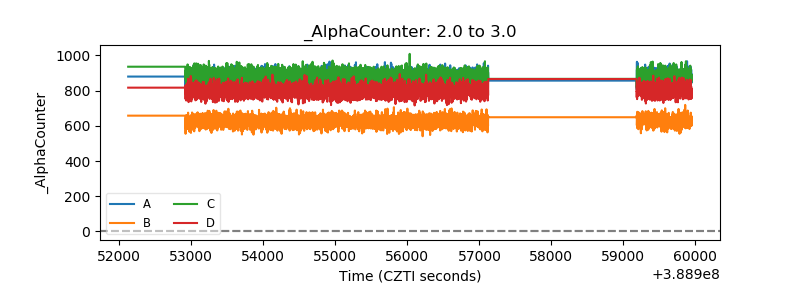 |
| _CPM_Rate | 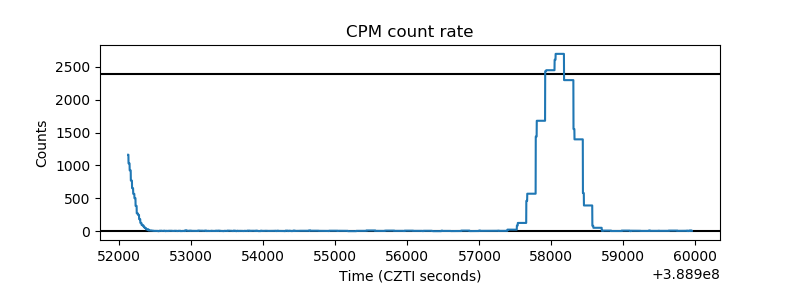 |
| CZT Counter | 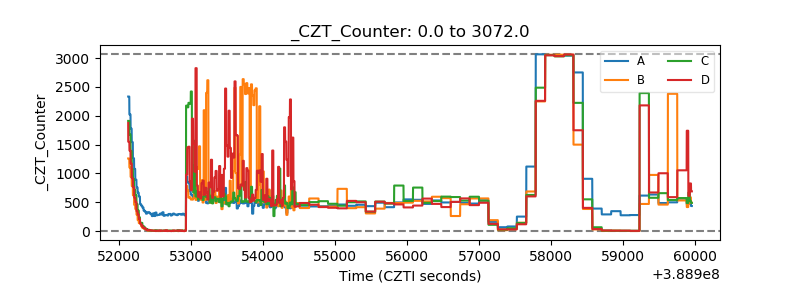 |
| +2.5 Volts monitor | 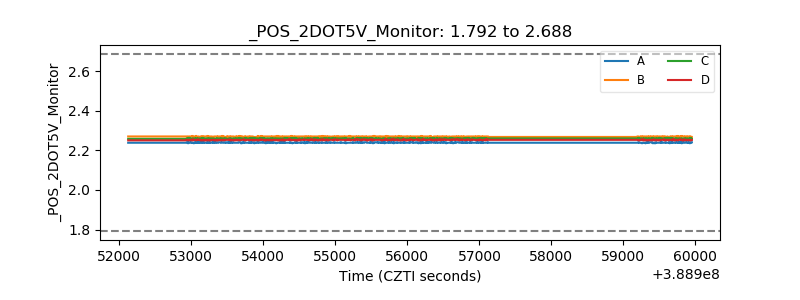 |
| +5 Volts monitor | 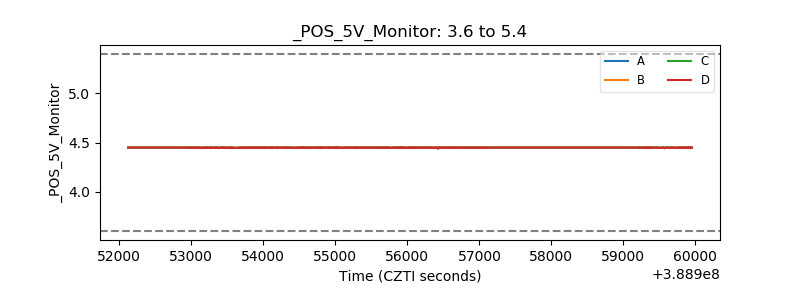 |
| _ROLL_ROT | 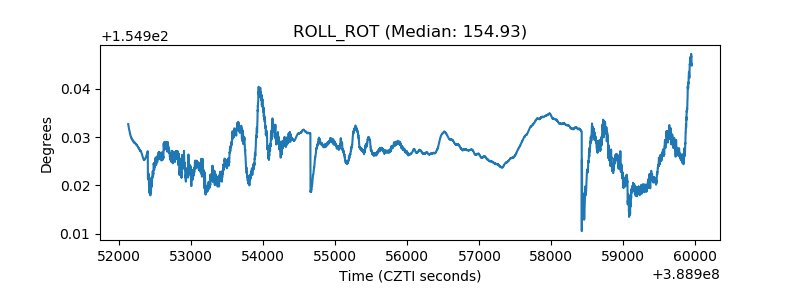 |
| _Roll_DEC | 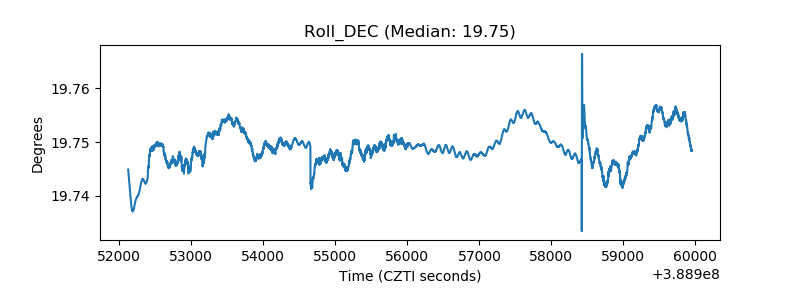 |
| _Roll_RA | 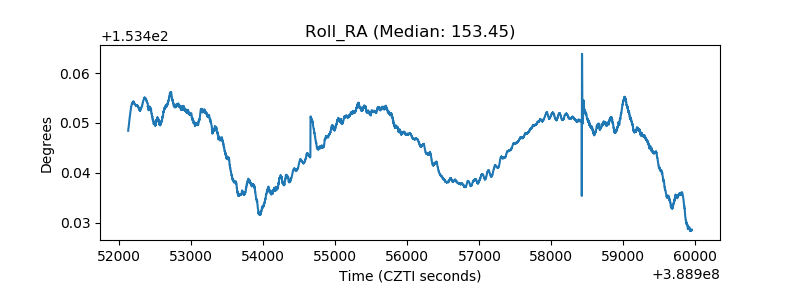 |
| Veto Counter | 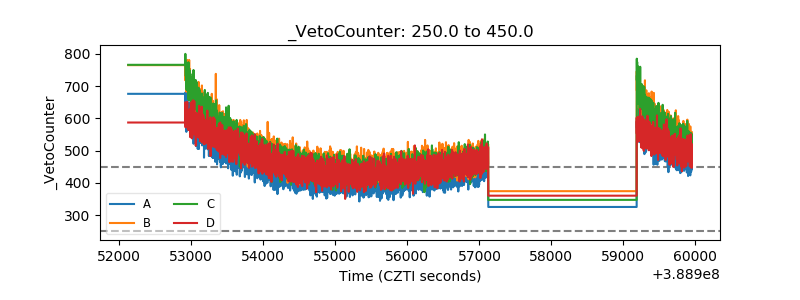 |