| Param | Original file | Final file |
|---|---|---|
| Filename | modeM0/AS1A10_065T04_9000005098_35607cztM0_level2.evt | modeM0/AS1A10_065T04_9000005098_35607cztM0_level2_quad_clean.evt |
| Size (bytes) | 505,143,360 | 74,125,440 |
| Size | 481.7 MB | 70.7 MB |
| Events in quadrant A | 2,595,637 | 497,584 |
| Events in quadrant B | 4,172,873 | 481,494 |
| Events in quadrant C | 3,640,330 | 471,467 |
| Events in quadrant D | 4,530,475 | 422,669 |
| Mode M9 | |||
|---|---|---|---|
| Quadrant | BADHDUFLAG | Total packets | Discarded packets |
| A | 0 | 19 | 0 |
| B | 0 | 19 | 0 |
| C | 0 | 19 | 0 |
| D | 0 | 19 | 0 |
| Mode M0 | |||
|---|---|---|---|
| Quadrant | BADHDUFLAG | Total packets | Discarded packets |
| A | 0 | 11136 | 3 |
| B | 0 | 15882 | 2 |
| C | 0 | 14128 | 2 |
| D | 0 | 16937 | 2 |
| Mode SS | |||
|---|---|---|---|
| Quadrant | BADHDUFLAG | Total packets | Discarded packets |
| A | 0 | 108 | 0 |
| B | 0 | 108 | 0 |
| C | 0 | 108 | 0 |
| D | 0 | 108 | 0 |
| Quadrant | Total seconds | Saturated seconds | Saturation percentage |
|---|---|---|---|
| A | 5294 | 6 | 0.113336% |
| B | 5294 | 408 | 7.706838% |
| C | 5294 | 285 | 5.383453% |
| D | 5294 | 611 | 11.541368% |
Noise dominated data is calculated using 1-second bins in cleaned event files. If a bin has >2000 counts, and if more than 50% of those come from <1% of pixels, then it is considered to be noise-dominated and hence unusable.
| Quadrant | # 1 sec bins | Bins with >0 counts | Bins with >2000 counts | High rate bins dominated by noise | Noise dominated (total time) | Noise dominated (detector-on time) | Marked lightcurve |
|---|---|---|---|---|---|---|---|
| A | 7146 | 5295 | 1 | 1 | 0.01% | 0.02% | 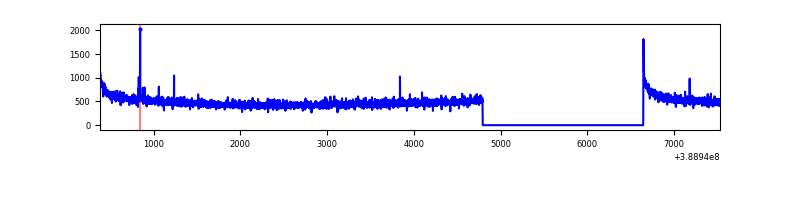 |
| B | 7146 | 5295 | 315 | 315 | 4.41% | 5.95% | 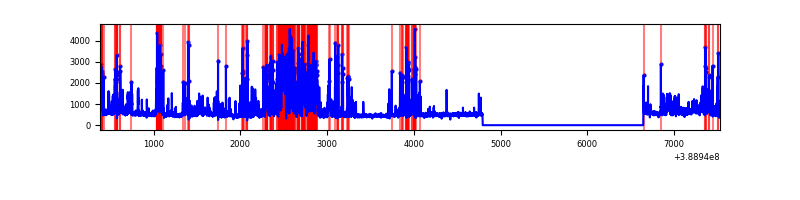 |
| C | 7146 | 5295 | 228 | 228 | 3.19% | 4.31% | 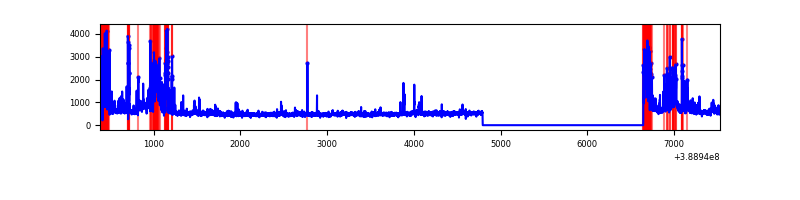 |
| D | 7145 | 5294 | 496 | 496 | 6.94% | 9.37% | 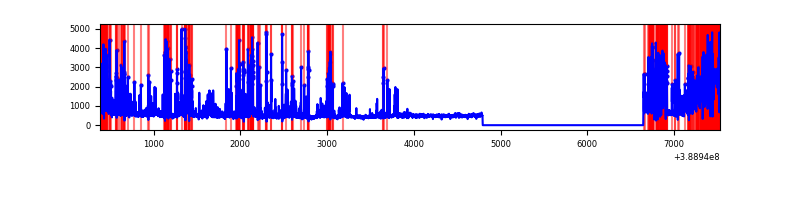 |
Top three noisy pixels from each quadrant. If the there are fewer than three noisy pixels in the level2.evt file, extra rows are filled as -1
| Pixel properties | Quadrant properties | ||||||
|---|---|---|---|---|---|---|---|
| Quadrant | DetID | PixID | Counts | Sigma | Mean | Median | Sigma |
| A | 10 | 83 | 140132 | 1105.16 | 629 | 618 | 126.2 |
| A | 8 | 144 | 8650 | 63.63 | 629 | 618 | 126.2 |
| A | 13 | 6 | 8129 | 59.5 | 629 | 618 | 126.2 |
| B | 5 | 172 | 1305149 | 11347.55 | 605 | 590 | 115.0 |
| B | 4 | 81 | 179150 | 1553.18 | 605 | 590 | 115.0 |
| B | 5 | 200 | 107064 | 926.15 | 605 | 590 | 115.0 |
| C | 0 | 10 | 475761 | 3422.35 | 597 | 602 | 138.8 |
| C | 1 | 23 | 406774 | 2925.47 | 597 | 602 | 138.8 |
| C | 15 | 214 | 214802 | 1542.79 | 597 | 602 | 138.8 |
| D | 7 | 80 | 1589748 | 11250.65 | 574 | 557 | 141.3 |
| D | 2 | 249 | 235820 | 1665.54 | 574 | 557 | 141.3 |
| D | 12 | 227 | 122609 | 864.06 | 574 | 557 | 141.3 |
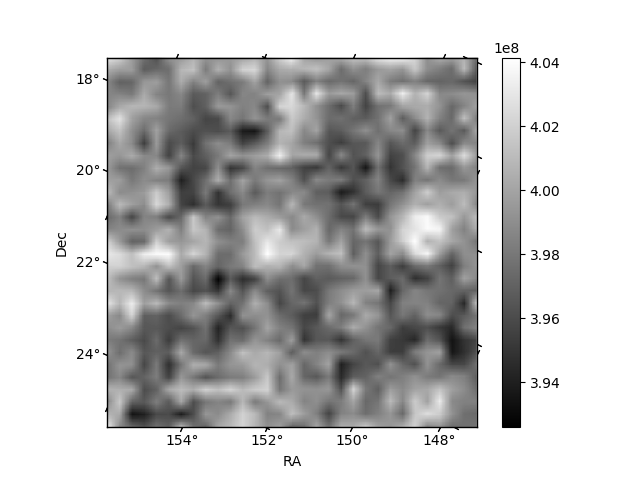
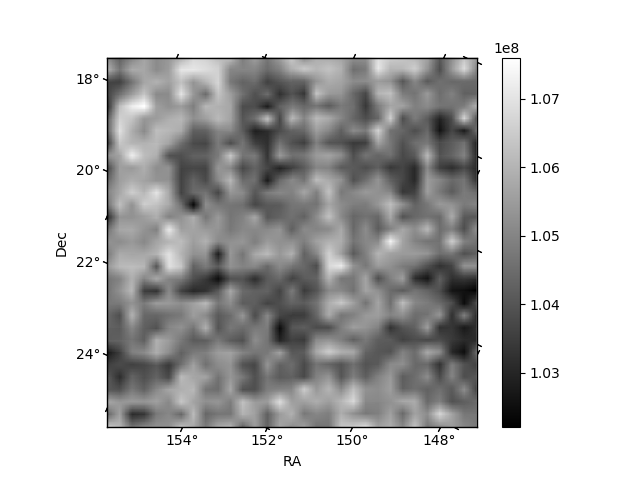
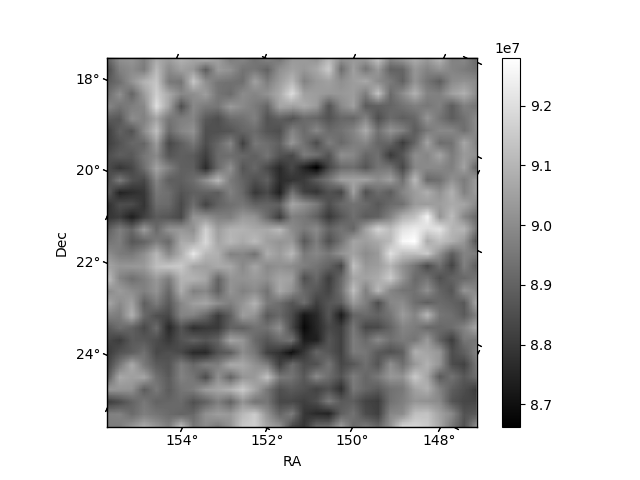
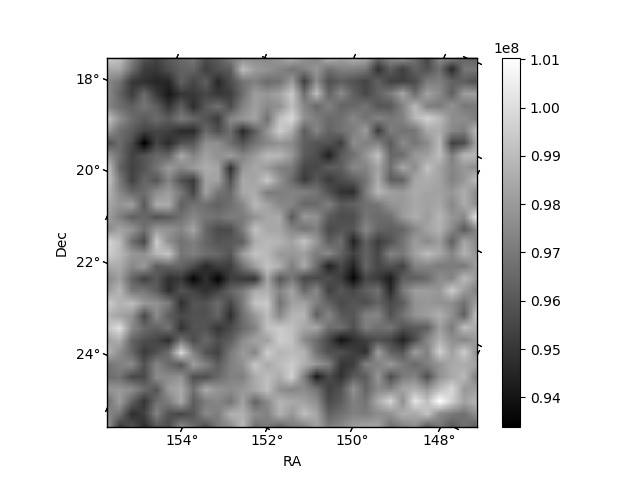
Histogram calculated using DETX and DETY for each event in the final _common_clean file
| Quadrant A | 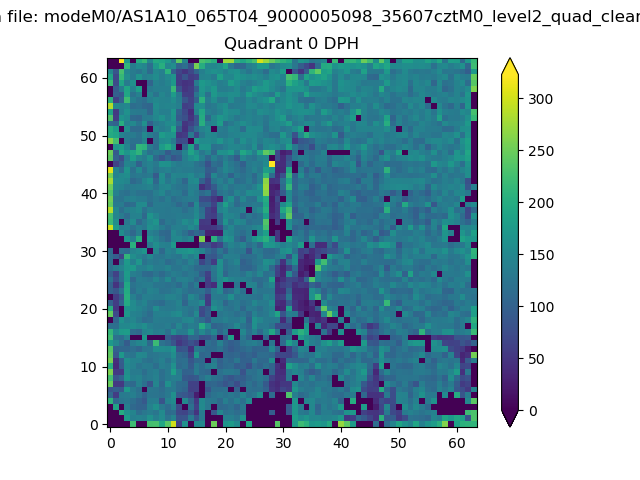 |
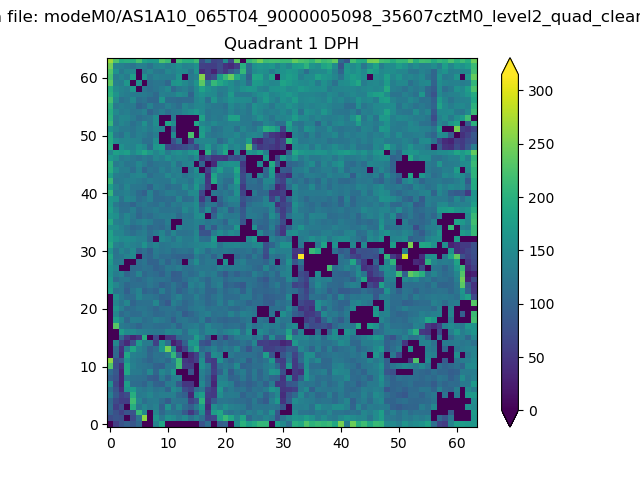 |
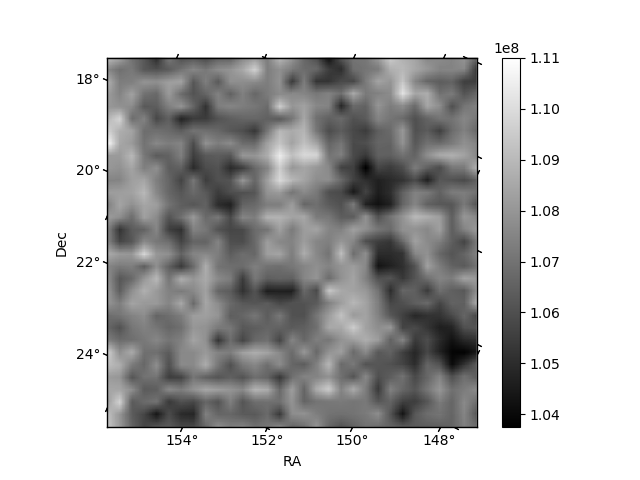
Quadrant B |
|---|---|---|---|
| Quadrant D | 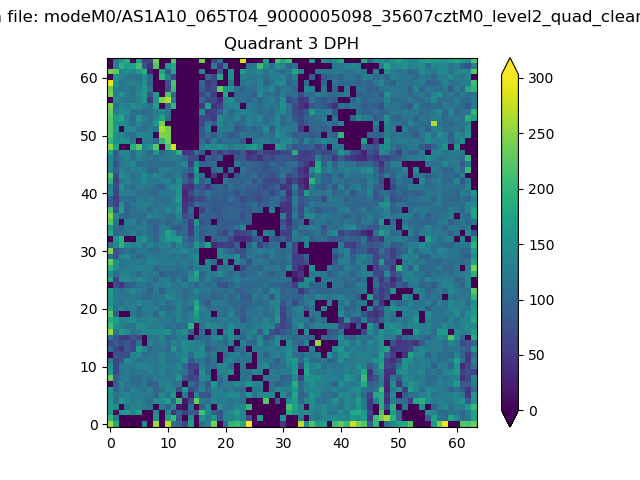 |
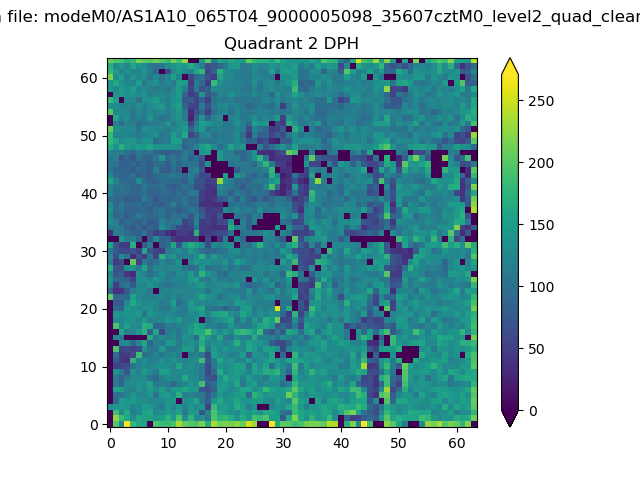 |
Quadrant C |
| Plot type | Count rate plots | Images |
|---|---|---|
| Comparison with Poisson distribution Blue bars denote a histogram of data divided into 1 sec bins. Red curve is a Poisson curve with rate = median count rate of data. |
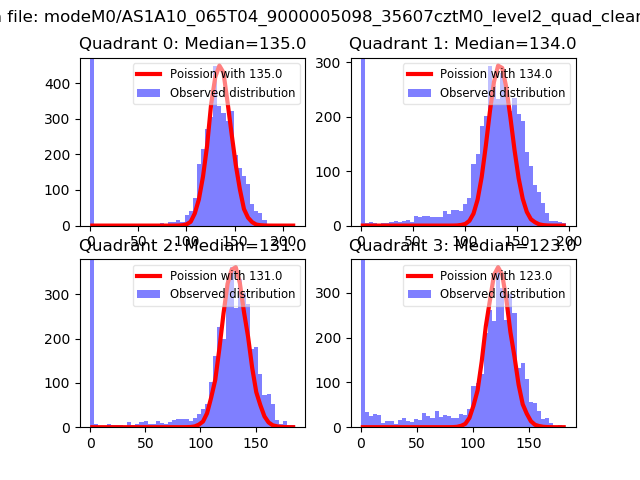 |
 |
| Quadrant-wise count rates Data is divided into 100 sec bins |
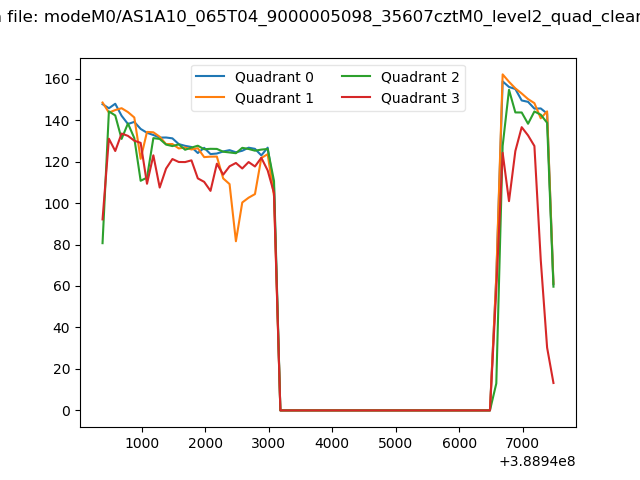 |
|
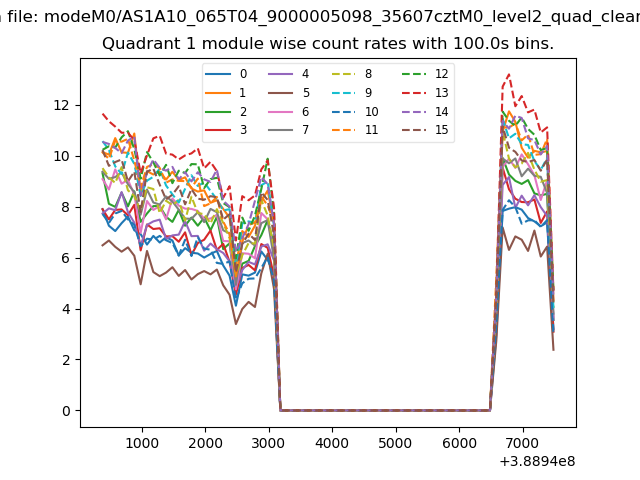
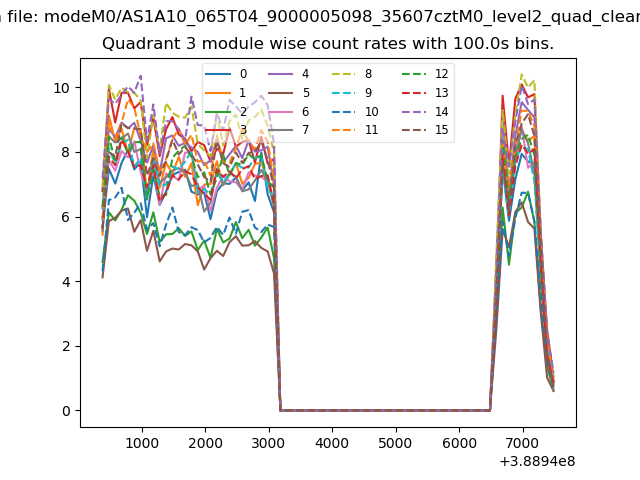
| Module-wise count rates for Quadrant A Data is divided into 100 sec bins |
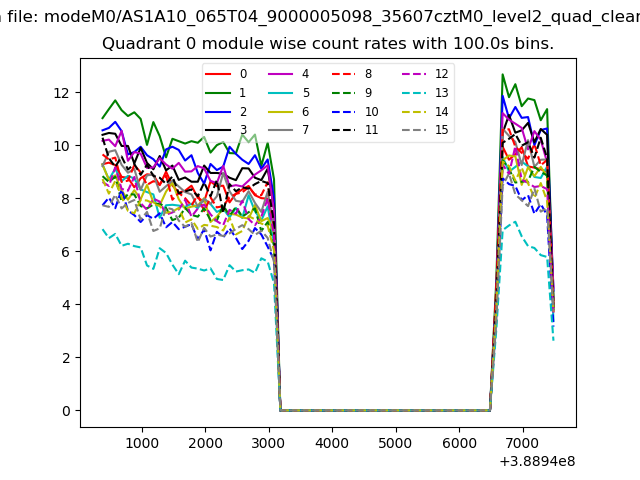 |
 |
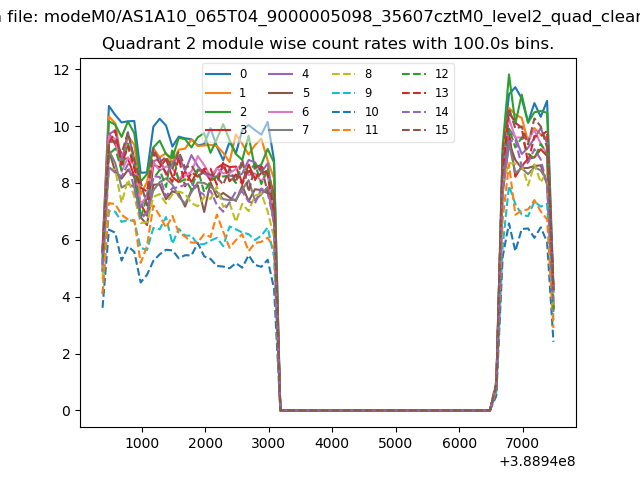
| Module-wise count rates for Quadrant B Data is divided into 100 sec bins |
 |
 |
| Module-wise count rates for Quadrant C Data is divided into 100 sec bins |
 |
 |
| Module-wise count rates for Quadrant D Data is divided into 100 sec bins |
 |
 |
| Parameter | Plot |
|---|---|
| CZT HV Monitor | 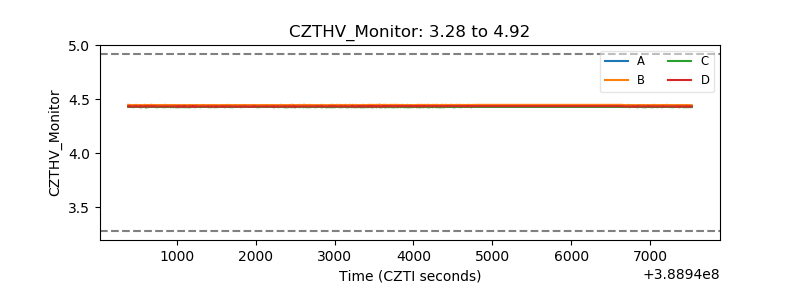 |
| D_VDD | 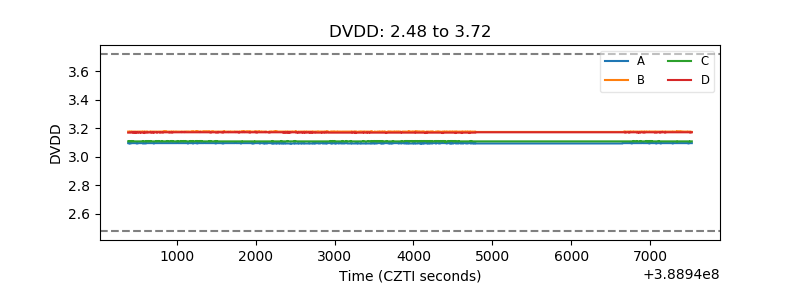 |
| Temperature 1 | 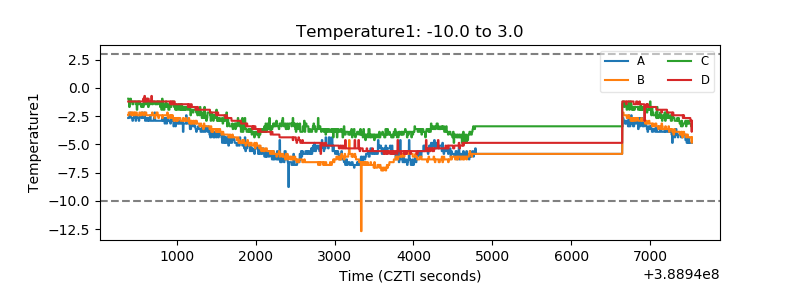 |
| Veto HV Monitor | 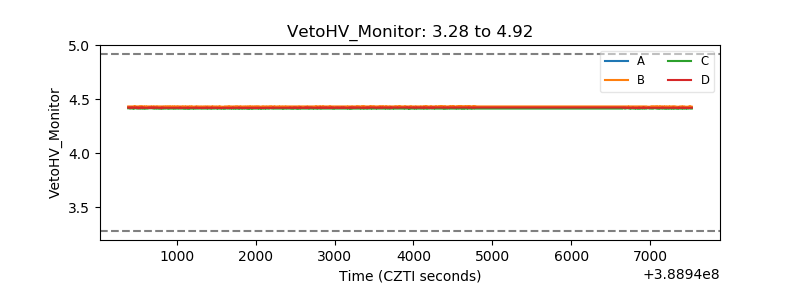 |
| Veto LLD | 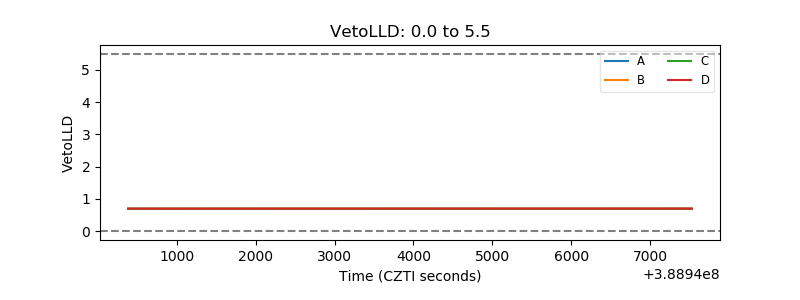 |
| Alpha Counter | 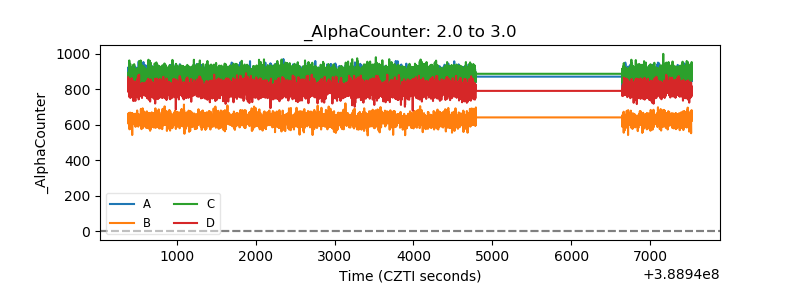 |
| _CPM_Rate | 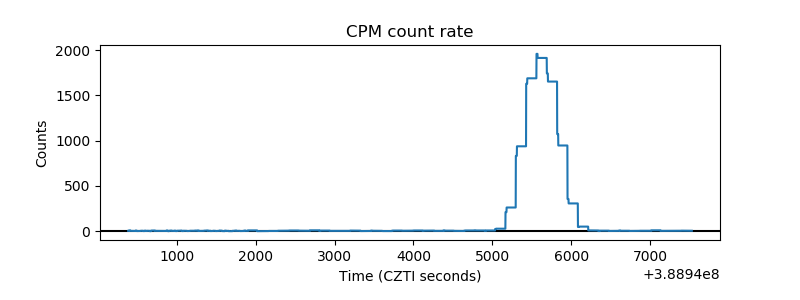 |
| CZT Counter | 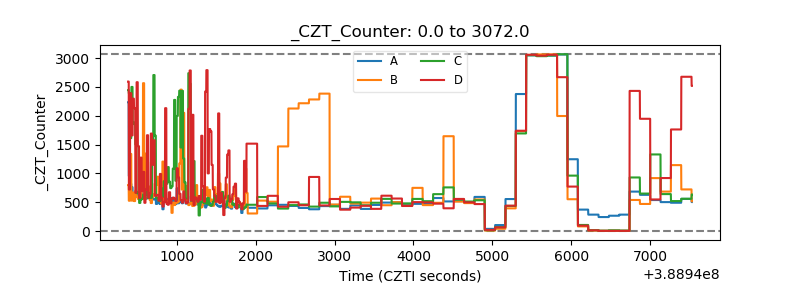 |
| +2.5 Volts monitor | 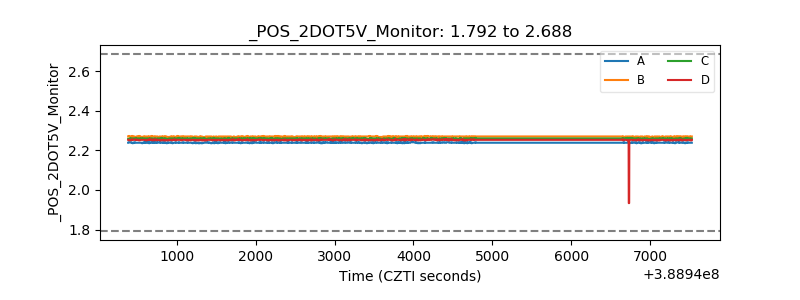 |
| +5 Volts monitor | 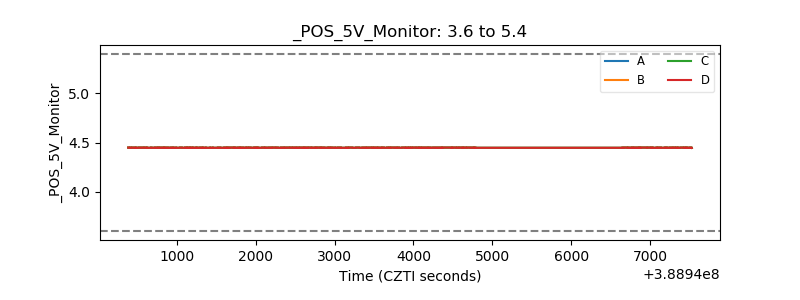 |
| _ROLL_ROT | 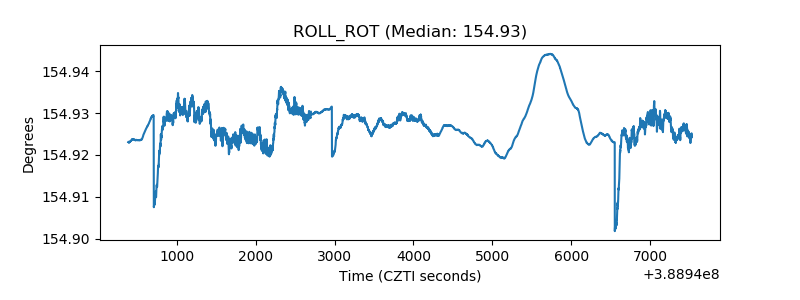 |
| _Roll_DEC | 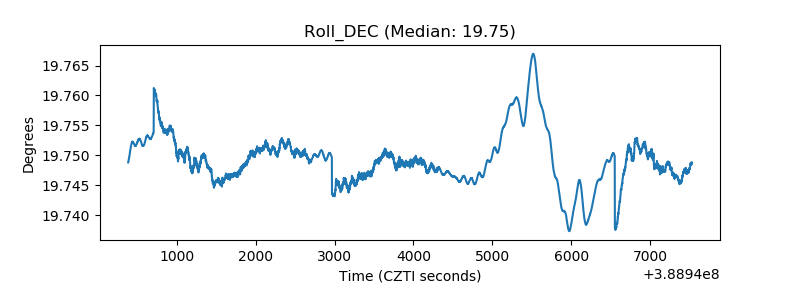 |
| _Roll_RA | 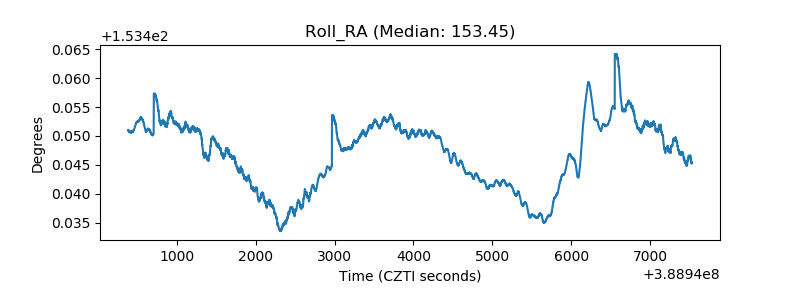 |
| Veto Counter | 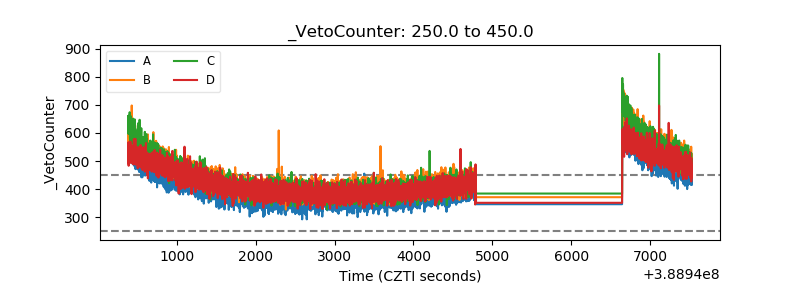 |