| Param | Original file | Final file |
|---|---|---|
| Filename | modeM0/AS1A10_065T04_9000005098_35605cztM0_level2.evt | modeM0/AS1A10_065T04_9000005098_35605cztM0_level2_quad_clean.evt |
| Size (bytes) | 487,290,240 | 79,963,200 |
| Size | 464.7 MB | 76.3 MB |
| Events in quadrant A | 2,660,997 | 529,532 |
| Events in quadrant B | 3,511,675 | 522,376 |
| Events in quadrant C | 3,725,753 | 504,782 |
| Events in quadrant D | 4,486,738 | 480,315 |
| Mode M9 | |||
|---|---|---|---|
| Quadrant | BADHDUFLAG | Total packets | Discarded packets |
| A | 0 | 18 | 0 |
| B | 0 | 18 | 0 |
| C | 0 | 18 | 0 |
| D | 0 | 19 | 0 |
| Mode M0 | |||
|---|---|---|---|
| Quadrant | BADHDUFLAG | Total packets | Discarded packets |
| A | 0 | 11518 | 3 |
| B | 0 | 14139 | 2 |
| C | 0 | 14496 | 2 |
| D | 0 | 17001 | 2 |
| Mode SS | |||
|---|---|---|---|
| Quadrant | BADHDUFLAG | Total packets | Discarded packets |
| A | 0 | 112 | 0 |
| B | 0 | 112 | 0 |
| C | 0 | 112 | 0 |
| D | 0 | 112 | 0 |
| Quadrant | Total seconds | Saturated seconds | Saturation percentage |
|---|---|---|---|
| A | 5489 | 13 | 0.236837% |
| B | 5489 | 281 | 5.119330% |
| C | 5489 | 270 | 4.918929% |
| D | 5489 | 505 | 9.200219% |
Noise dominated data is calculated using 1-second bins in cleaned event files. If a bin has >2000 counts, and if more than 50% of those come from <1% of pixels, then it is considered to be noise-dominated and hence unusable.
| Quadrant | # 1 sec bins | Bins with >0 counts | Bins with >2000 counts | High rate bins dominated by noise | Noise dominated (total time) | Noise dominated (detector-on time) | Marked lightcurve |
|---|---|---|---|---|---|---|---|
| A | 7191 | 5490 | 2 | 2 | 0.03% | 0.04% | 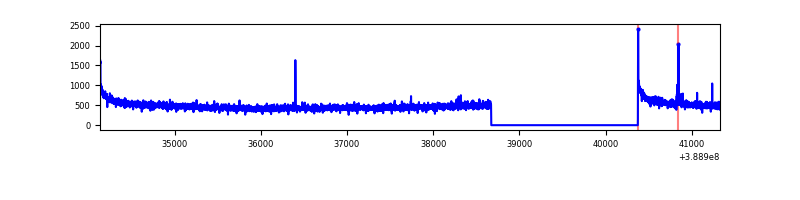 |
| B | 7191 | 5490 | 162 | 162 | 2.25% | 2.95% | 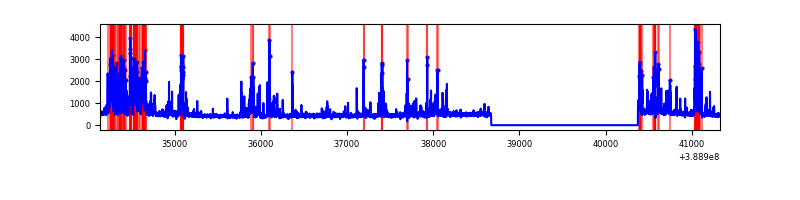 |
| C | 7191 | 5490 | 201 | 201 | 2.80% | 3.66% | 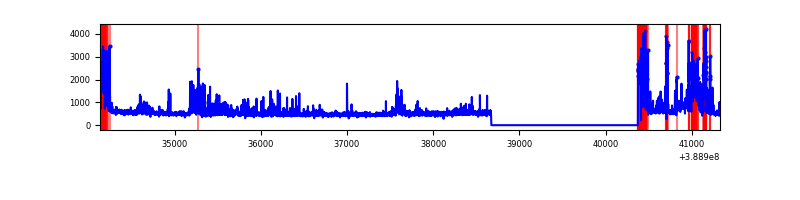 |
| D | 7191 | 5490 | 445 | 445 | 6.19% | 8.11% | 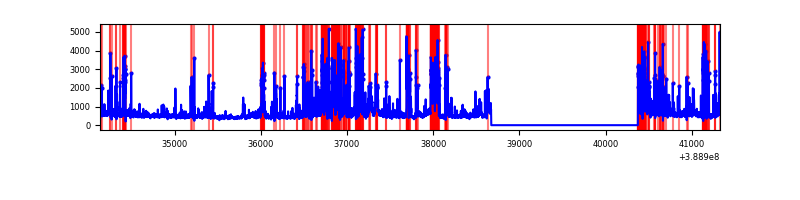 |
Top three noisy pixels from each quadrant. If the there are fewer than three noisy pixels in the level2.evt file, extra rows are filled as -1
| Pixel properties | Quadrant properties | ||||||
|---|---|---|---|---|---|---|---|
| Quadrant | DetID | PixID | Counts | Sigma | Mean | Median | Sigma |
| A | 10 | 83 | 145720 | 1126.15 | 640 | 627 | 128.8 |
| A | 8 | 144 | 14769 | 109.76 | 640 | 627 | 128.8 |
| A | 9 | 254 | 7885 | 56.33 | 640 | 627 | 128.8 |
| B | 5 | 172 | 951589 | 7917.45 | 622 | 607 | 120.1 |
| B | 15 | 85 | 55174 | 454.3 | 622 | 607 | 120.1 |
| B | 4 | 81 | 25076 | 203.72 | 622 | 607 | 120.1 |
| C | 0 | 10 | 731176 | 5150.81 | 608 | 613 | 141.8 |
| C | 1 | 23 | 361258 | 2542.71 | 608 | 613 | 141.8 |
| C | 15 | 214 | 224046 | 1575.31 | 608 | 613 | 141.8 |
| D | 7 | 80 | 1447373 | 9792.59 | 599 | 581 | 147.7 |
| D | 2 | 249 | 235365 | 1589.13 | 599 | 581 | 147.7 |
| D | 2 | 153 | 125360 | 844.56 | 599 | 581 | 147.7 |
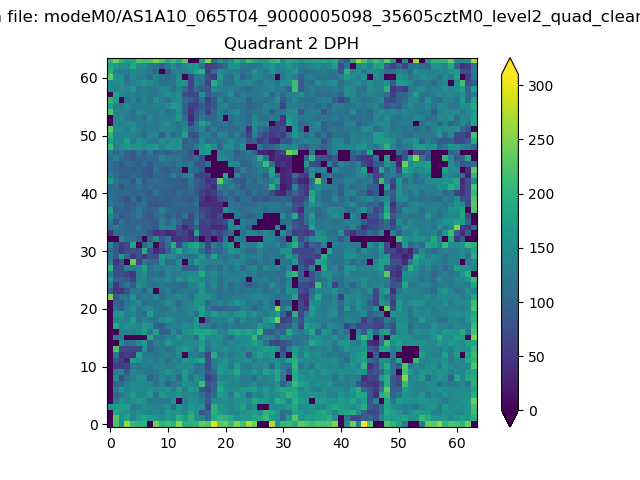
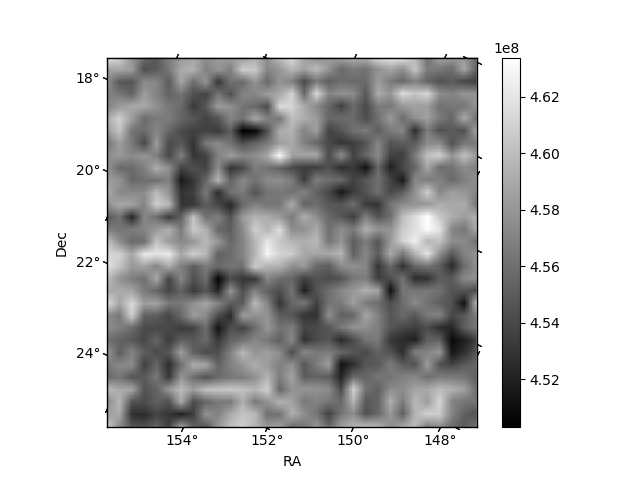
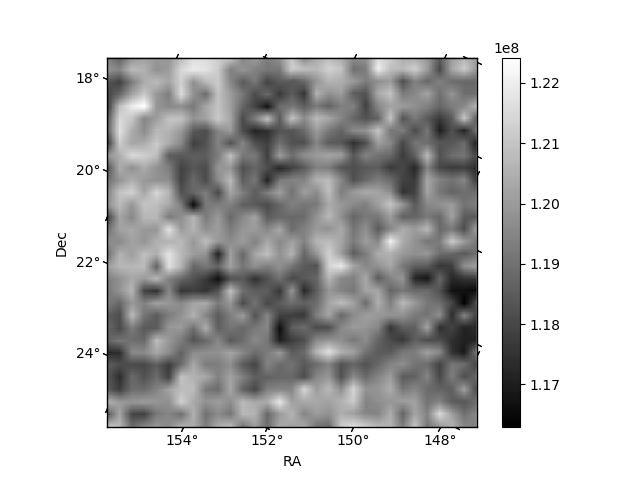
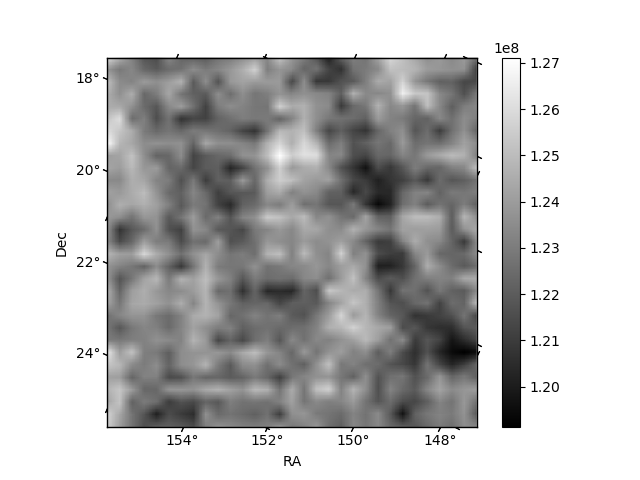
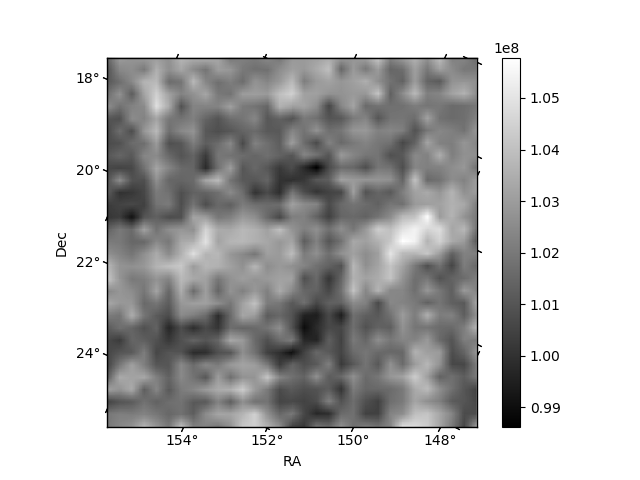
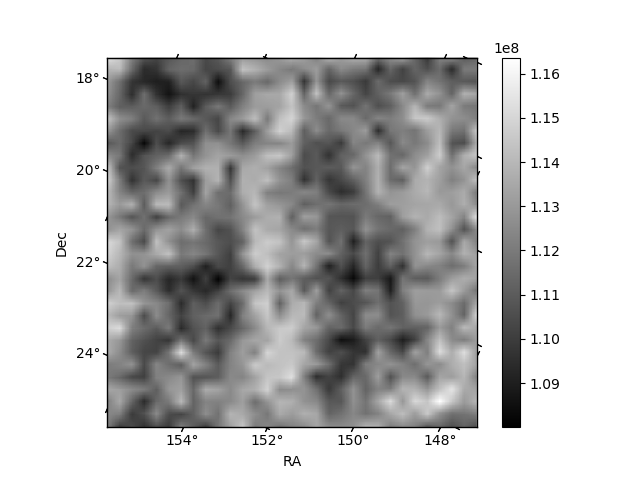
Histogram calculated using DETX and DETY for each event in the final _common_clean file
| Quadrant A | 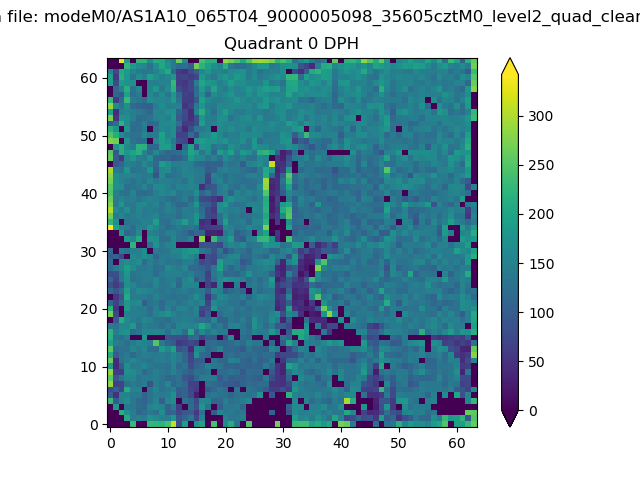 |
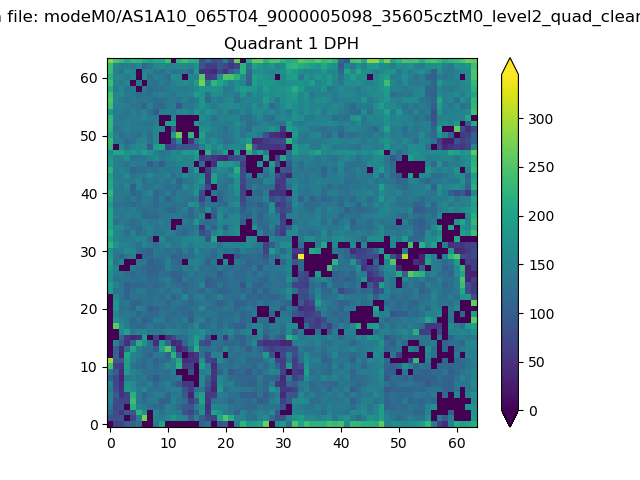 |
Quadrant B |
|---|---|---|---|
| Quadrant D | 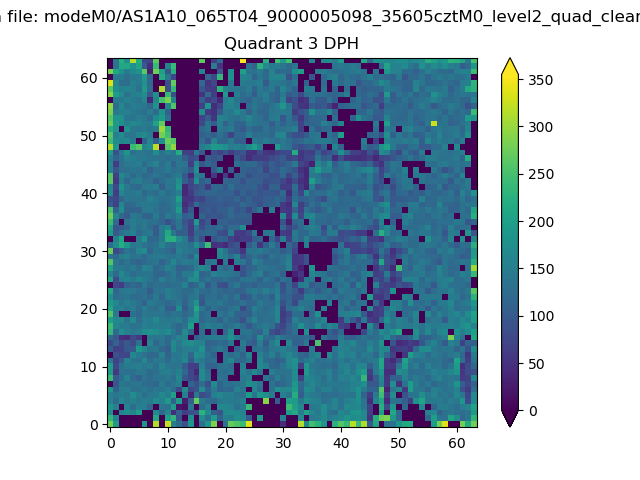 |
 |
Quadrant C |
| Plot type | Count rate plots | Images |
|---|---|---|
| Comparison with Poisson distribution Blue bars denote a histogram of data divided into 1 sec bins. Red curve is a Poisson curve with rate = median count rate of data. |
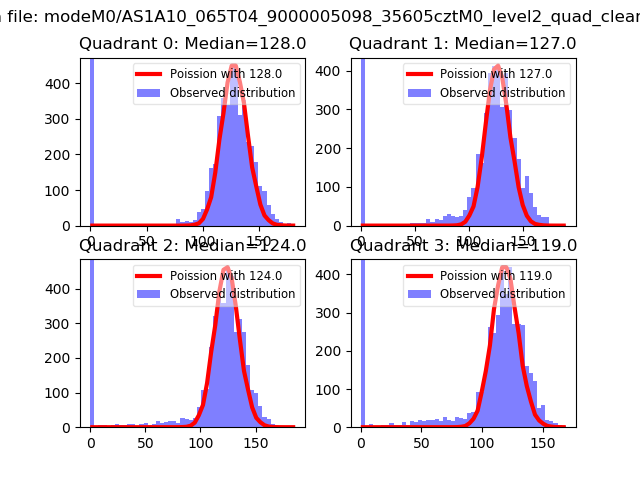 |
 |
| Quadrant-wise count rates Data is divided into 100 sec bins |
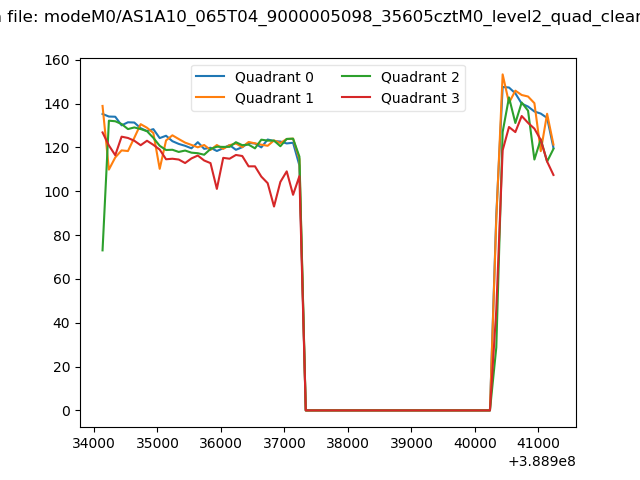 |
|
| Module-wise count rates for Quadrant A Data is divided into 100 sec bins |
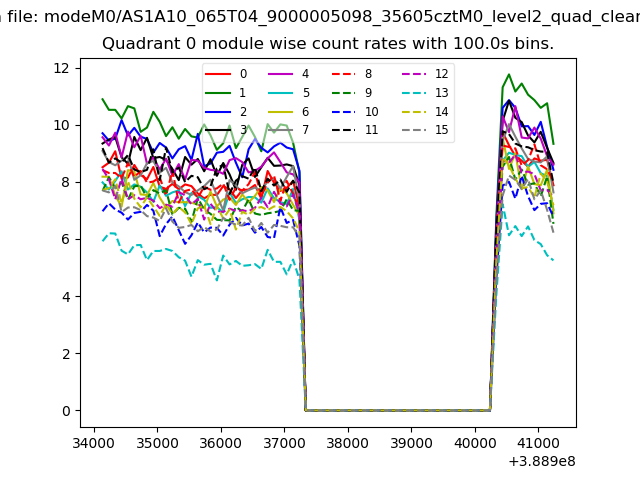 |
 |
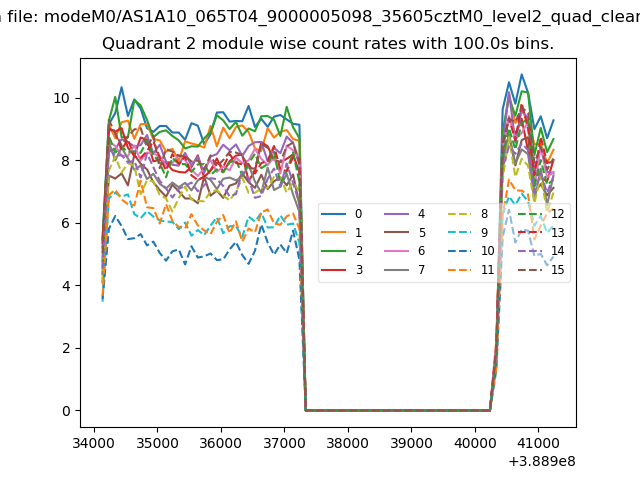
| Module-wise count rates for Quadrant B Data is divided into 100 sec bins |
 |
 |
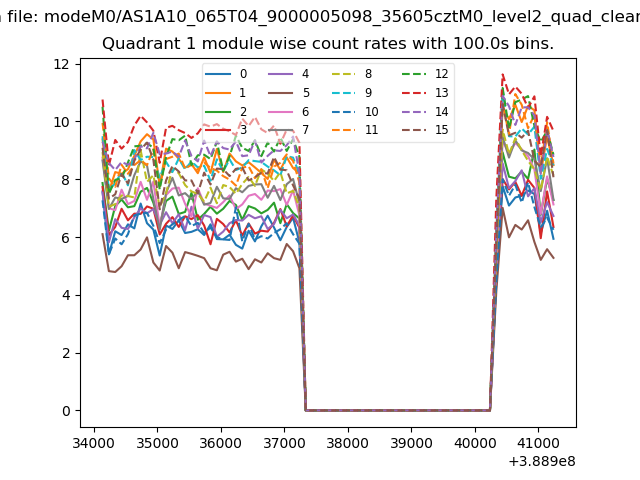
| Module-wise count rates for Quadrant C Data is divided into 100 sec bins |
 |
 |
| Module-wise count rates for Quadrant D Data is divided into 100 sec bins |
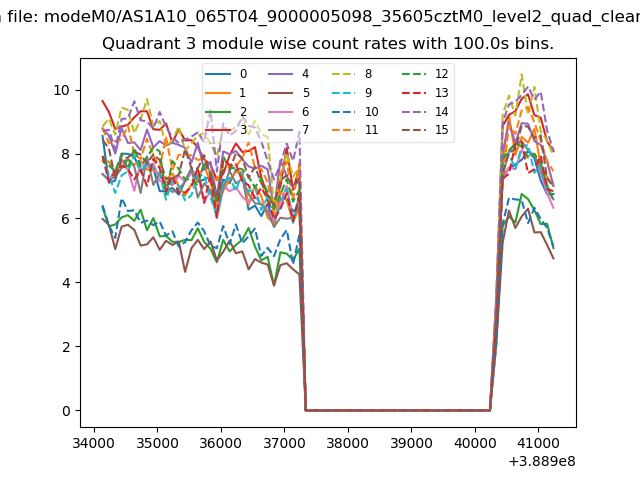 |
 |
| Parameter | Plot |
|---|---|
| CZT HV Monitor | 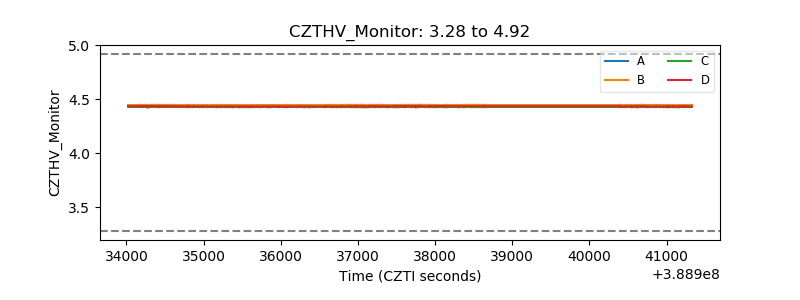 |
| D_VDD | 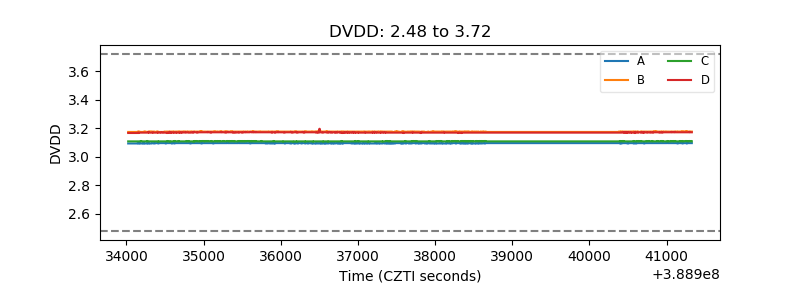 |
| Temperature 1 | 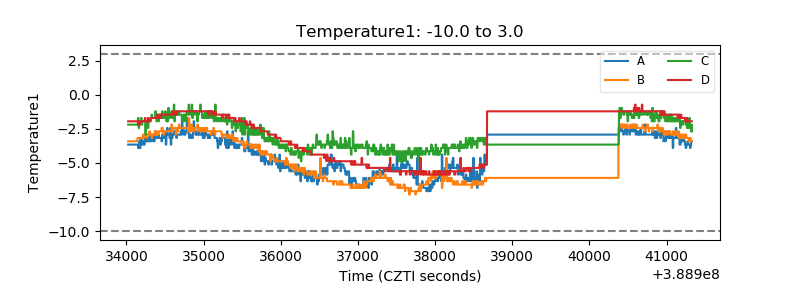 |
| Veto HV Monitor | 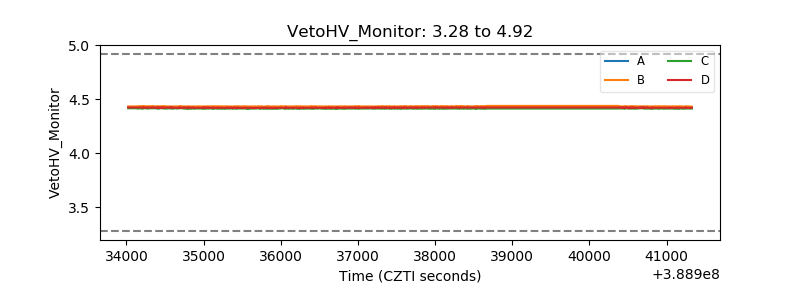 |
| Veto LLD | 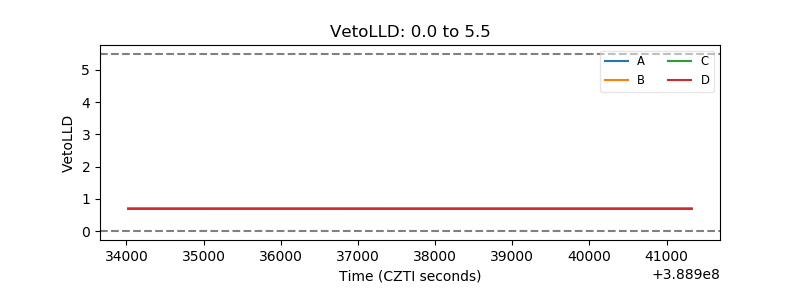 |
| Alpha Counter | 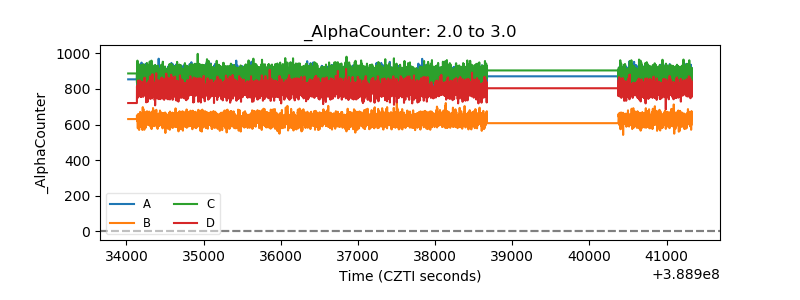 |
| _CPM_Rate | 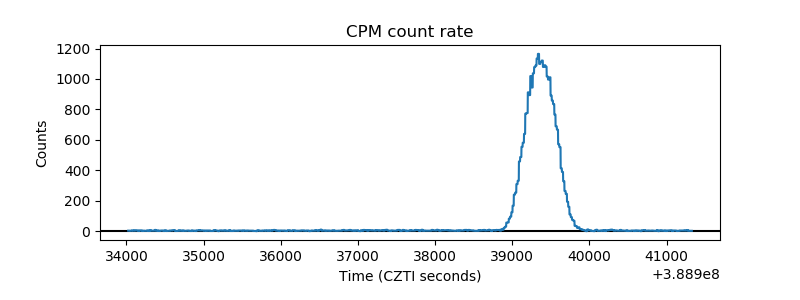 |
| CZT Counter |  |
| +2.5 Volts monitor | 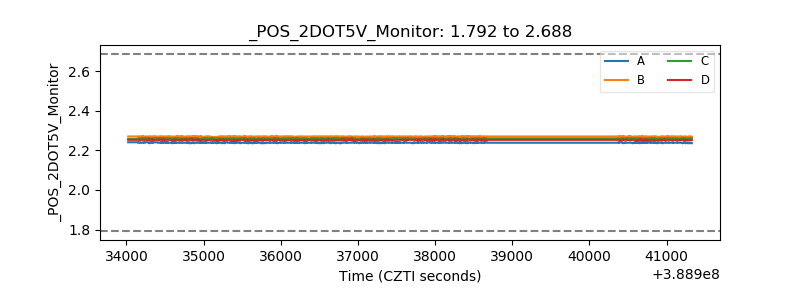 |
| +5 Volts monitor | 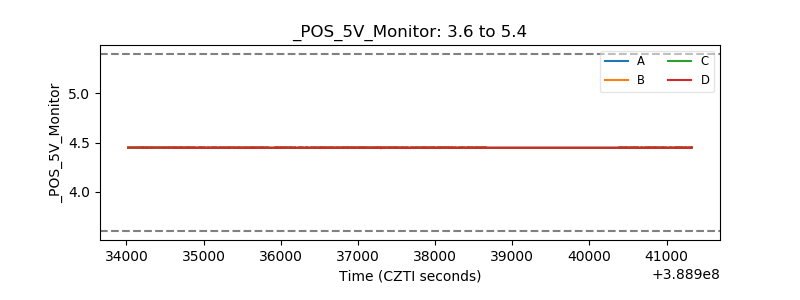 |
| _ROLL_ROT | 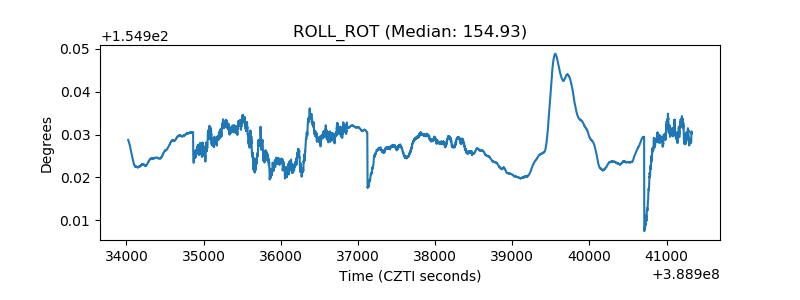 |
| _Roll_DEC | 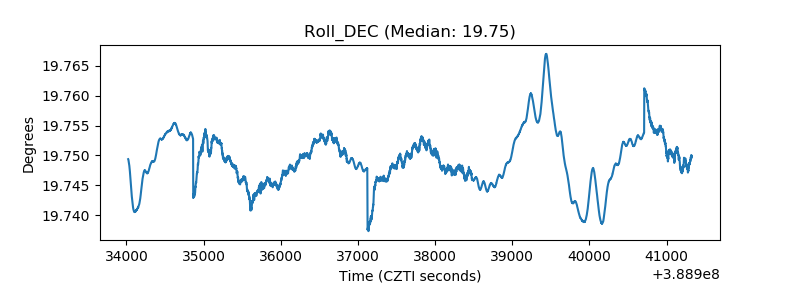 |
| _Roll_RA | 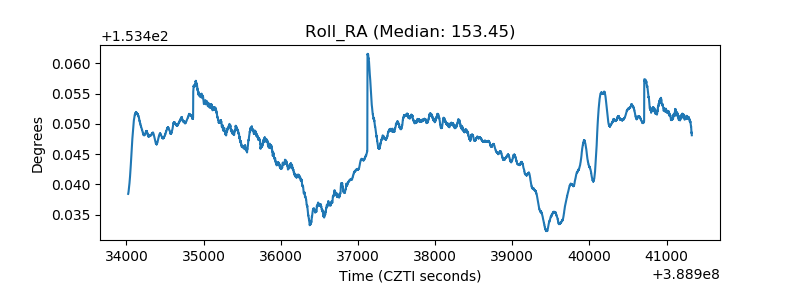 |
| Veto Counter | 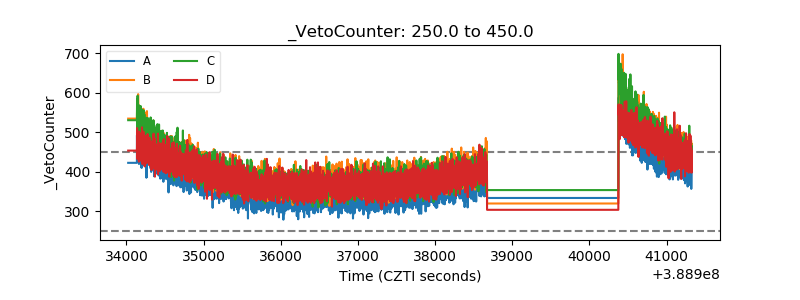 |