| Param | Original file | Final file |
|---|---|---|
| Filename | modeM0/AS1A10_065T04_9000005098_35604cztM0_level2.evt | modeM0/AS1A10_065T04_9000005098_35604cztM0_level2_quad_clean.evt |
| Size (bytes) | 500,068,800 | 85,265,280 |
| Size | 476.9 MB | 81.3 MB |
| Events in quadrant A | 2,727,276 | 567,402 |
| Events in quadrant B | 4,250,036 | 548,484 |
| Events in quadrant C | 3,701,795 | 549,025 |
| Events in quadrant D | 4,082,237 | 521,769 |
| Mode M9 | |||
|---|---|---|---|
| Quadrant | BADHDUFLAG | Total packets | Discarded packets |
| A | 0 | 22 | 0 |
| B | 0 | 22 | 0 |
| C | 0 | 22 | 0 |
| D | 0 | 23 | 0 |
| Mode M0 | |||
|---|---|---|---|
| Quadrant | BADHDUFLAG | Total packets | Discarded packets |
| A | 0 | 11780 | 3 |
| B | 0 | 16330 | 2 |
| C | 0 | 14485 | 2 |
| D | 0 | 15899 | 2 |
| Mode SS | |||
|---|---|---|---|
| Quadrant | BADHDUFLAG | Total packets | Discarded packets |
| A | 0 | 116 | 0 |
| B | 0 | 116 | 0 |
| C | 0 | 116 | 0 |
| D | 0 | 116 | 0 |
| Quadrant | Total seconds | Saturated seconds | Saturation percentage |
|---|---|---|---|
| A | 5645 | 19 | 0.336581% |
| B | 5645 | 440 | 7.794508% |
| C | 5645 | 170 | 3.011515% |
| D | 5645 | 341 | 6.040744% |
Noise dominated data is calculated using 1-second bins in cleaned event files. If a bin has >2000 counts, and if more than 50% of those come from <1% of pixels, then it is considered to be noise-dominated and hence unusable.
| Quadrant | # 1 sec bins | Bins with >0 counts | Bins with >2000 counts | High rate bins dominated by noise | Noise dominated (total time) | Noise dominated (detector-on time) | Marked lightcurve |
|---|---|---|---|---|---|---|---|
| A | 7258 | 5646 | 7 | 7 | 0.10% | 0.12% | 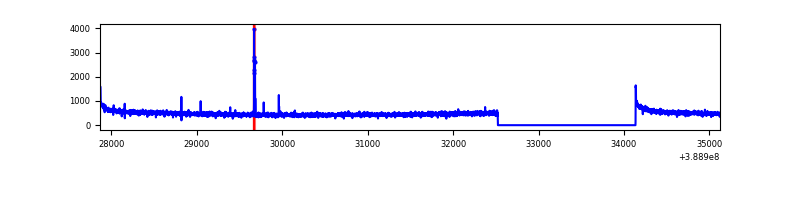 |
| B | 7258 | 5646 | 286 | 286 | 3.94% | 5.07% | 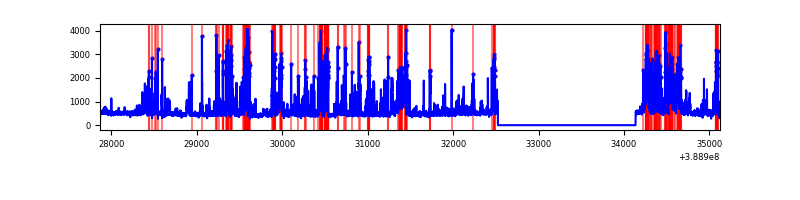 |
| C | 7258 | 5646 | 128 | 128 | 1.76% | 2.27% | 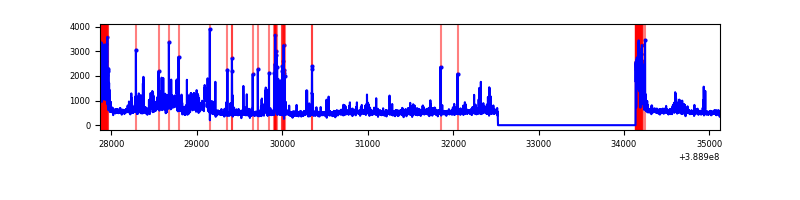 |
| D | 7258 | 5646 | 289 | 289 | 3.98% | 5.12% | 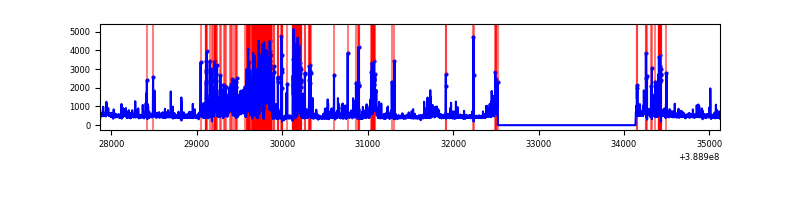 |
Top three noisy pixels from each quadrant. If the there are fewer than three noisy pixels in the level2.evt file, extra rows are filled as -1
| Pixel properties | Quadrant properties | ||||||
|---|---|---|---|---|---|---|---|
| Quadrant | DetID | PixID | Counts | Sigma | Mean | Median | Sigma |
| A | 10 | 83 | 143227 | 1069.26 | 654 | 641 | 133.4 |
| A | 7 | 3 | 31424 | 230.84 | 654 | 641 | 133.4 |
| A | 13 | 6 | 12988 | 92.59 | 654 | 641 | 133.4 |
| B | 5 | 172 | 1643626 | 13412.4 | 629 | 612 | 122.5 |
| B | 15 | 85 | 75819 | 613.94 | 629 | 612 | 122.5 |
| B | 3 | 112 | 21021 | 166.6 | 629 | 612 | 122.5 |
| C | 0 | 10 | 796008 | 5395.91 | 628 | 632 | 147.4 |
| C | 15 | 214 | 231373 | 1565.37 | 628 | 632 | 147.4 |
| C | 0 | 207 | 204157 | 1380.73 | 628 | 632 | 147.4 |
| D | 12 | 227 | 797588 | 5117.73 | 627 | 610 | 155.7 |
| D | 10 | 118 | 305047 | 1954.92 | 627 | 610 | 155.7 |
| D | 13 | 249 | 132260 | 845.38 | 627 | 610 | 155.7 |
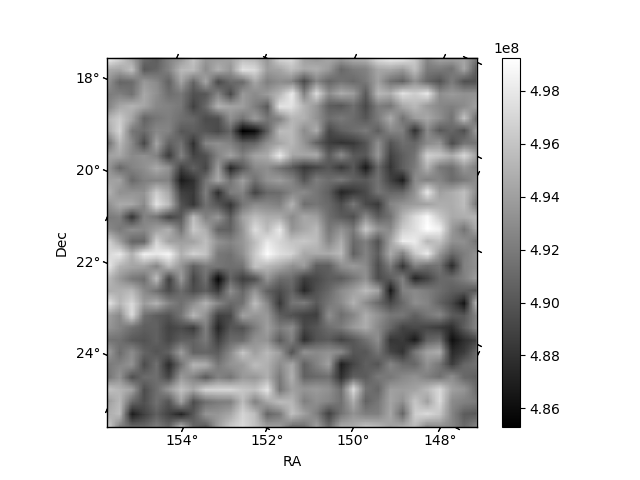
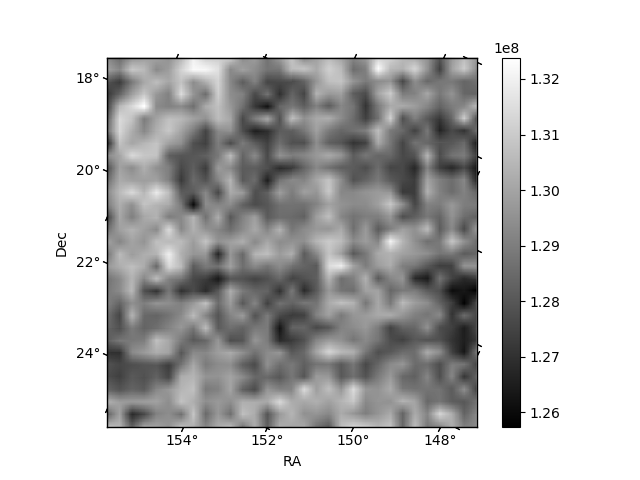
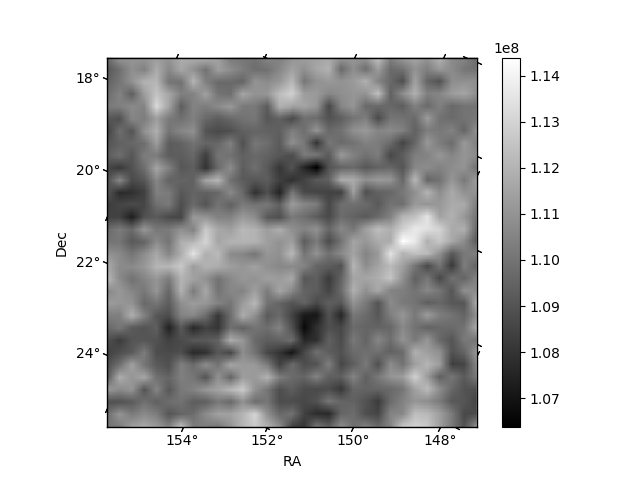
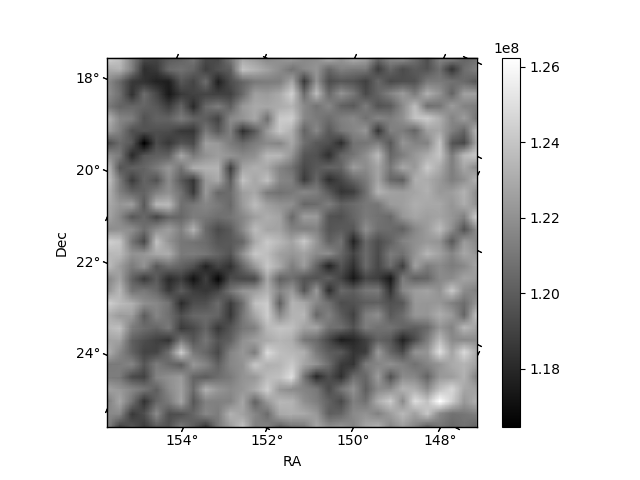
Histogram calculated using DETX and DETY for each event in the final _common_clean file
| Quadrant A | 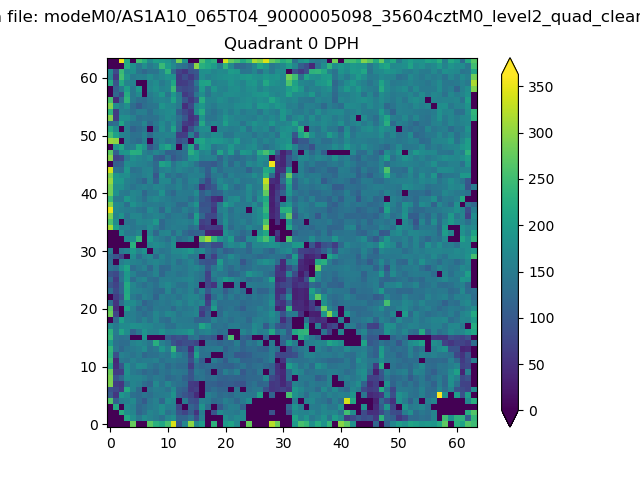 |
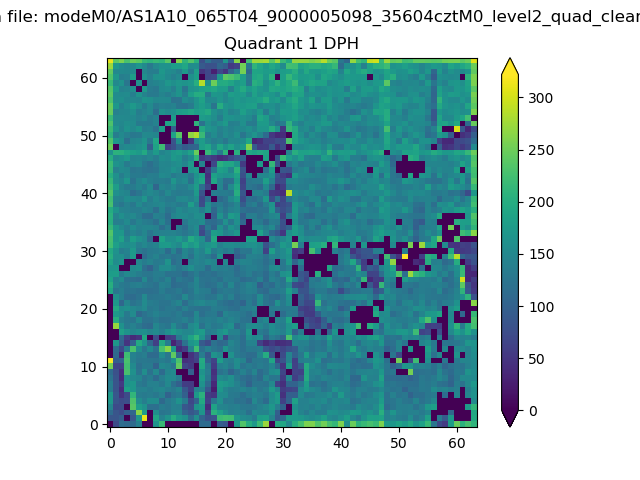 |
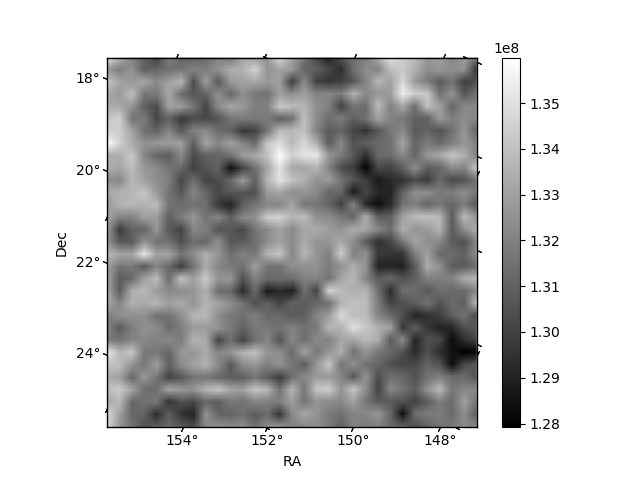
Quadrant B |
|---|---|---|---|
| Quadrant D | 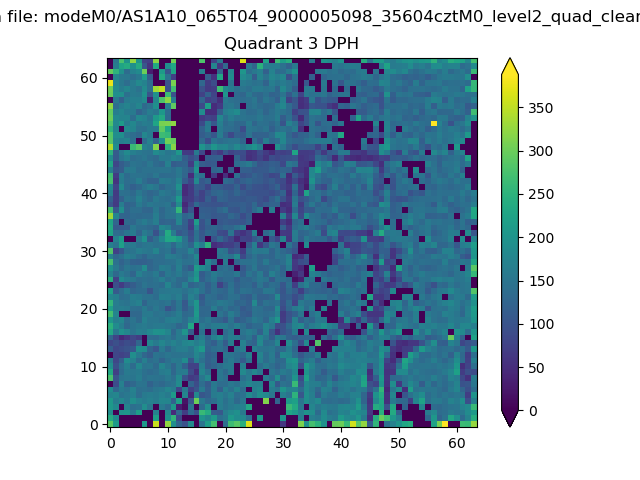 |
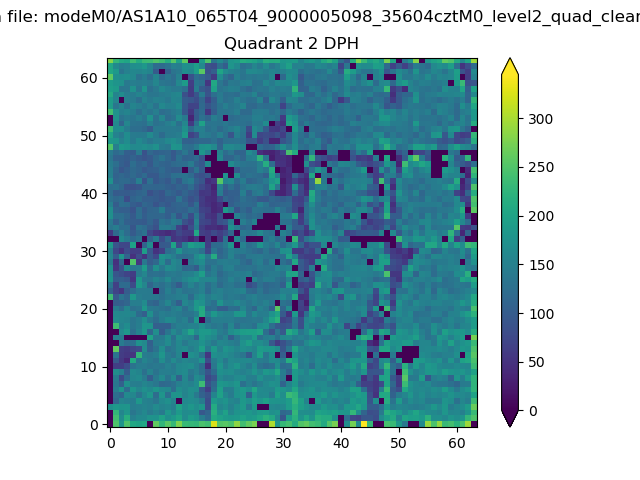 |
Quadrant C |
| Plot type | Count rate plots | Images |
|---|---|---|
| Comparison with Poisson distribution Blue bars denote a histogram of data divided into 1 sec bins. Red curve is a Poisson curve with rate = median count rate of data. |
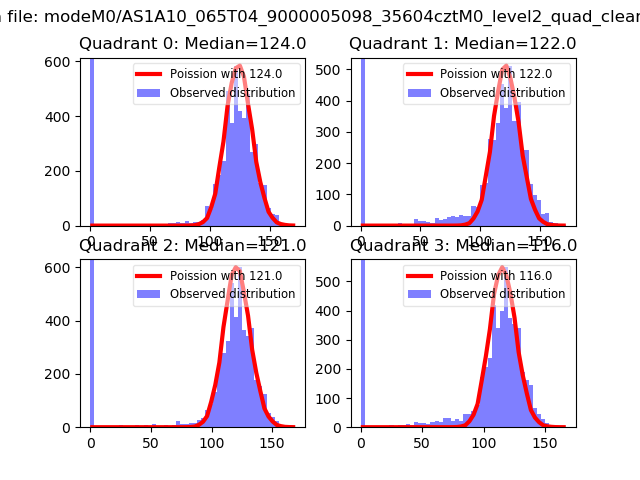 |
 |
| Quadrant-wise count rates Data is divided into 100 sec bins |
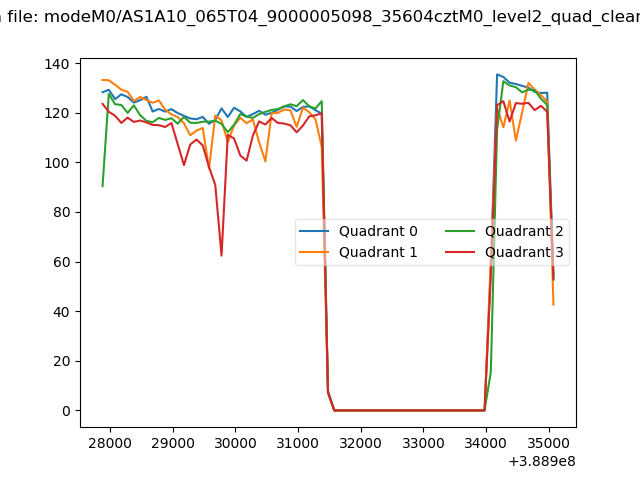 |
|
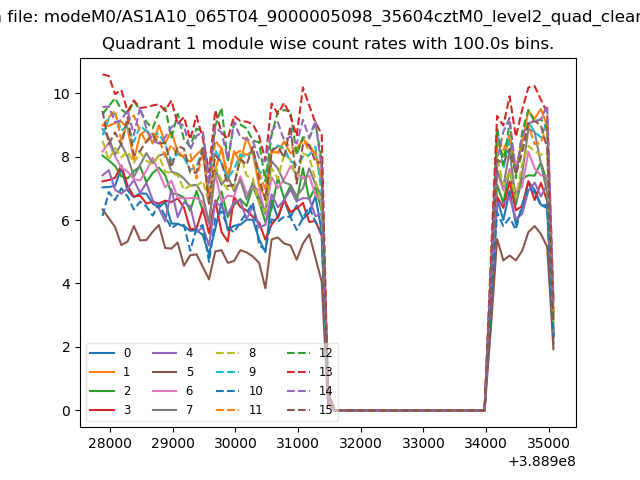
| Module-wise count rates for Quadrant A Data is divided into 100 sec bins |
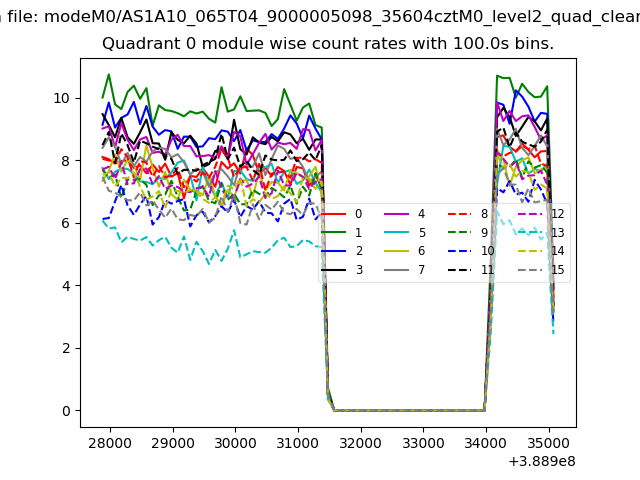 |
 |
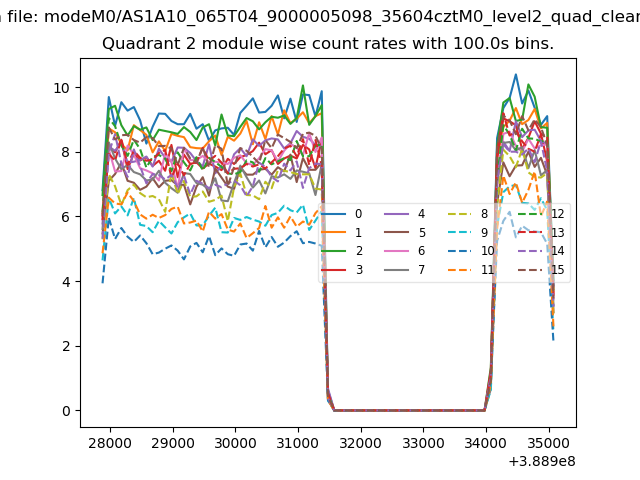
| Module-wise count rates for Quadrant B Data is divided into 100 sec bins |
 |
 |
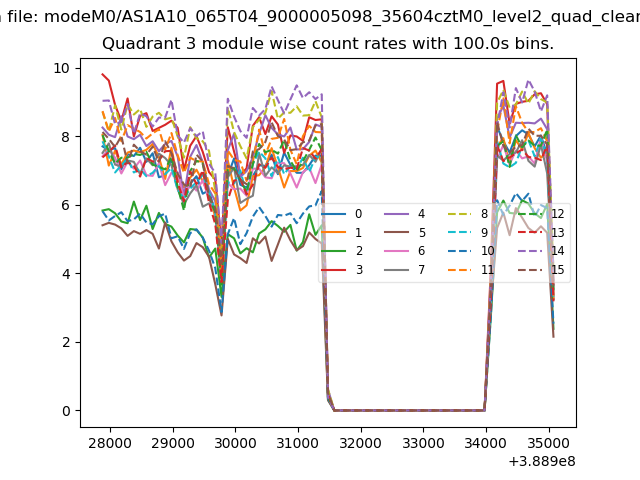
| Module-wise count rates for Quadrant C Data is divided into 100 sec bins |
 |
 |
| Module-wise count rates for Quadrant D Data is divided into 100 sec bins |
 |
 |
| Parameter | Plot |
|---|---|
| CZT HV Monitor | 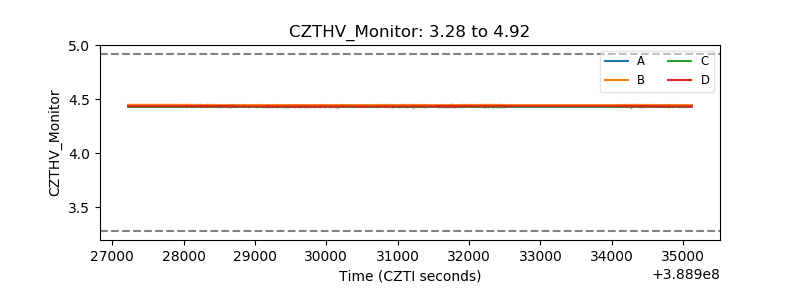 |
| D_VDD | 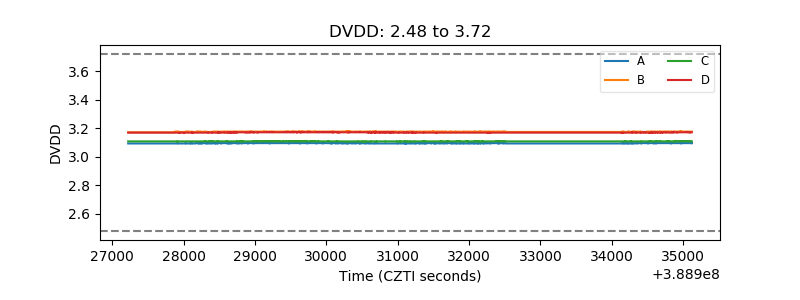 |
| Temperature 1 | 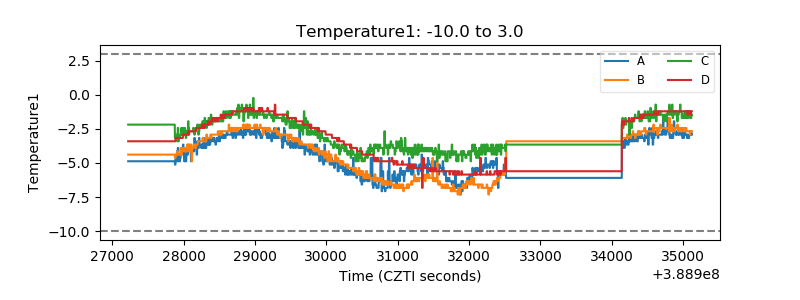 |
| Veto HV Monitor | 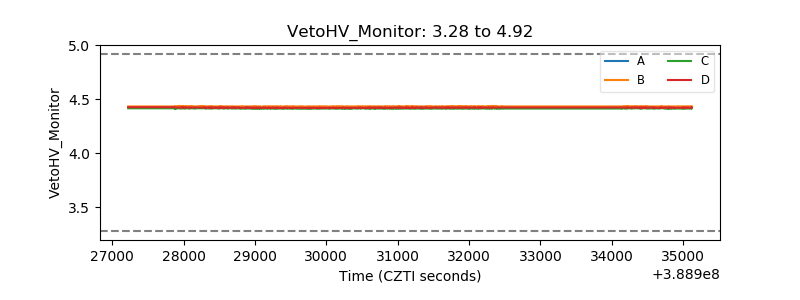 |
| Veto LLD | 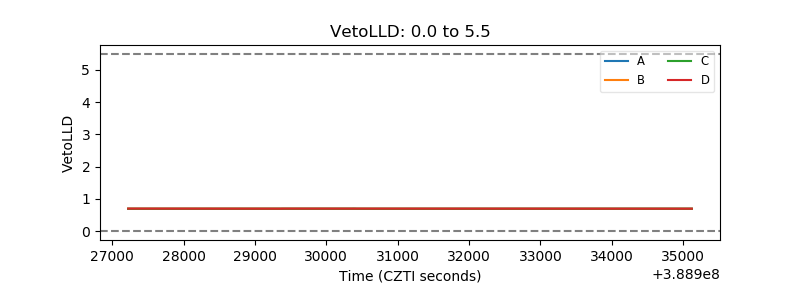 |
| Alpha Counter | 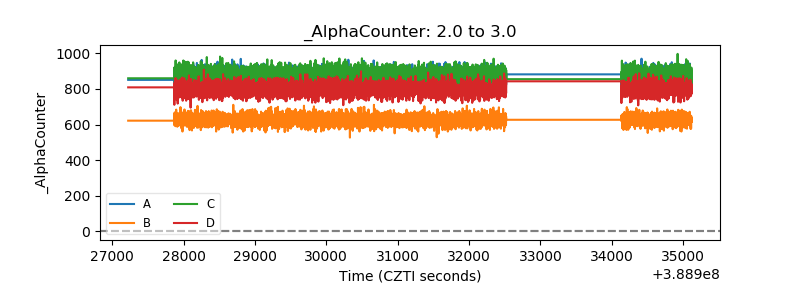 |
| _CPM_Rate | 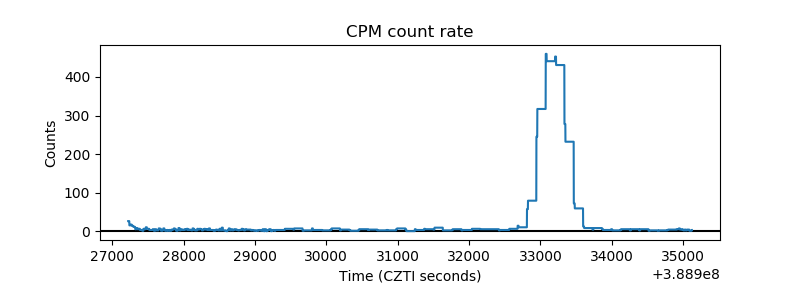 |
| CZT Counter | 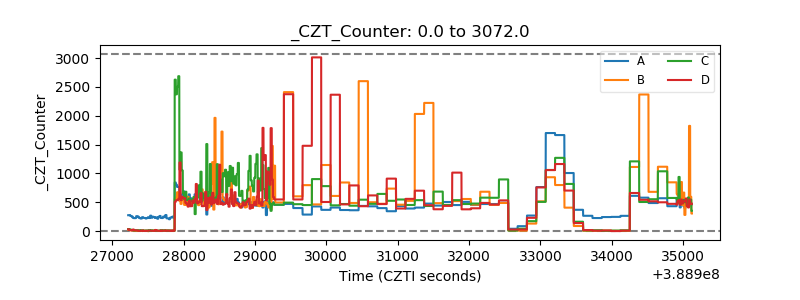 |
| +2.5 Volts monitor | 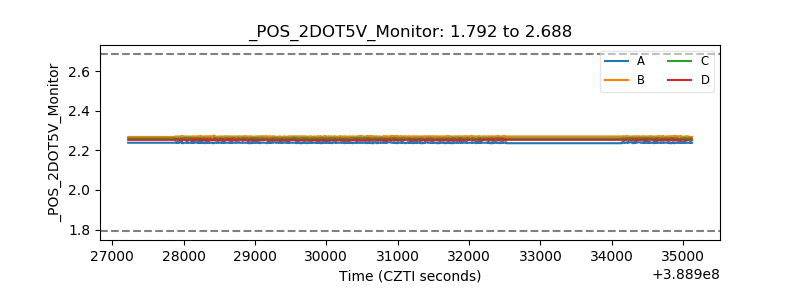 |
| +5 Volts monitor | 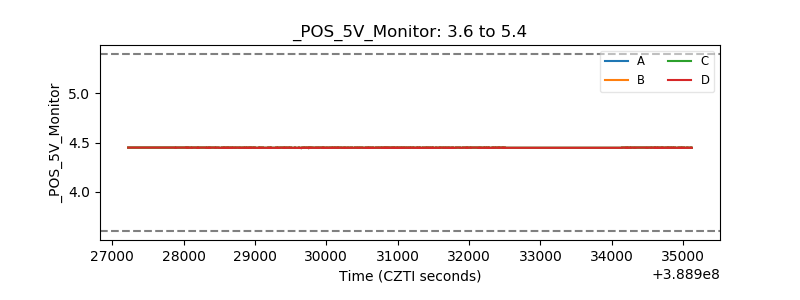 |
| _ROLL_ROT | 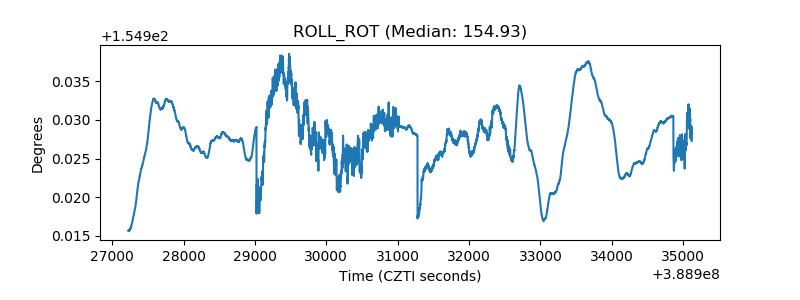 |
| _Roll_DEC | 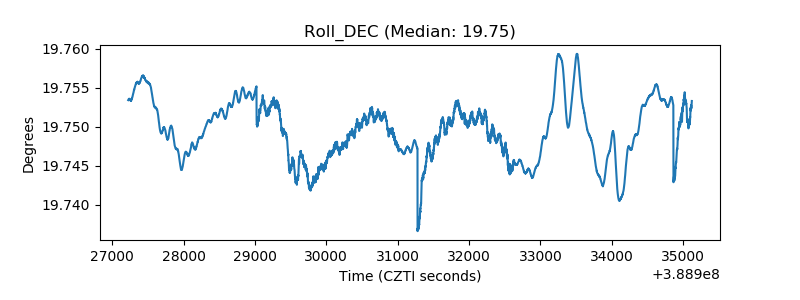 |
| _Roll_RA | 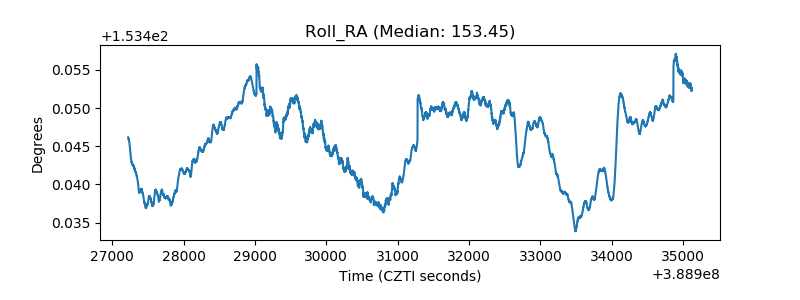 |
| Veto Counter | 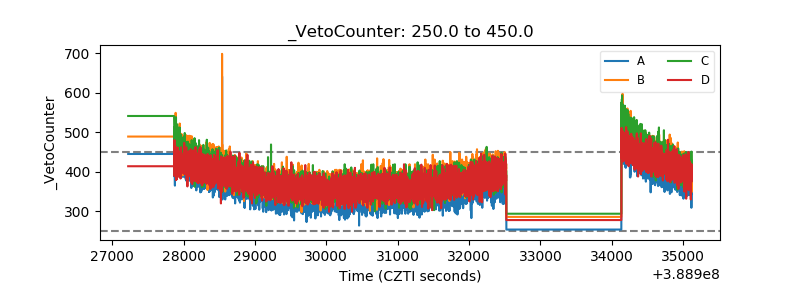 |