| Param | Original file | Final file |
|---|---|---|
| Filename | modeM0/AS1A10_065T04_9000005098_35600cztM0_level2.evt | modeM0/AS1A10_065T04_9000005098_35600cztM0_level2_quad_clean.evt |
| Size (bytes) | 536,702,400 | 84,234,240 |
| Size | 511.8 MB | 80.3 MB |
| Events in quadrant A | 3,247,823 | 531,069 |
| Events in quadrant B | 4,616,307 | 520,269 |
| Events in quadrant C | 3,748,393 | 530,987 |
| Events in quadrant D | 4,184,874 | 498,889 |
| Mode M9 | |||
|---|---|---|---|
| Quadrant | BADHDUFLAG | Total packets | Discarded packets |
| A | 0 | 27 | 0 |
| B | 0 | 27 | 0 |
| C | 0 | 27 | 0 |
| D | 0 | 27 | 0 |
| Mode M0 | |||
|---|---|---|---|
| Quadrant | BADHDUFLAG | Total packets | Discarded packets |
| A | 0 | 13766 | 3 |
| B | 0 | 18112 | 2 |
| C | 0 | 14948 | 2 |
| D | 0 | 16921 | 2 |
| Mode SS | |||
|---|---|---|---|
| Quadrant | BADHDUFLAG | Total packets | Discarded packets |
| A | 0 | 140 | 0 |
| B | 0 | 140 | 0 |
| C | 0 | 140 | 0 |
| D | 0 | 140 | 0 |
| Quadrant | Total seconds | Saturated seconds | Saturation percentage |
|---|---|---|---|
| A | 6730 | 6 | 0.089153% |
| B | 6730 | 364 | 5.408618% |
| C | 6730 | 108 | 1.604755% |
| D | 6730 | 152 | 2.258544% |
Noise dominated data is calculated using 1-second bins in cleaned event files. If a bin has >2000 counts, and if more than 50% of those come from <1% of pixels, then it is considered to be noise-dominated and hence unusable.
| Quadrant | # 1 sec bins | Bins with >0 counts | Bins with >2000 counts | High rate bins dominated by noise | Noise dominated (total time) | Noise dominated (detector-on time) | Marked lightcurve |
|---|---|---|---|---|---|---|---|
| A | 9506 | 6732 | 2 | 2 | 0.02% | 0.03% | 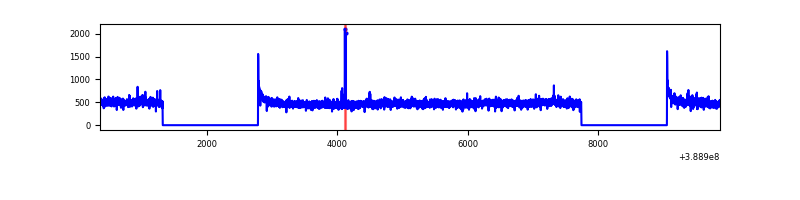 |
| B | 9506 | 6732 | 241 | 241 | 2.54% | 3.58% | 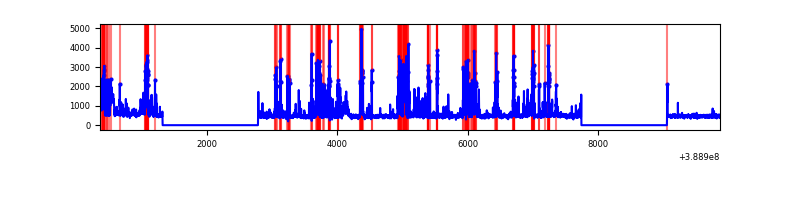 |
| C | 9506 | 6732 | 69 | 69 | 0.73% | 1.02% | 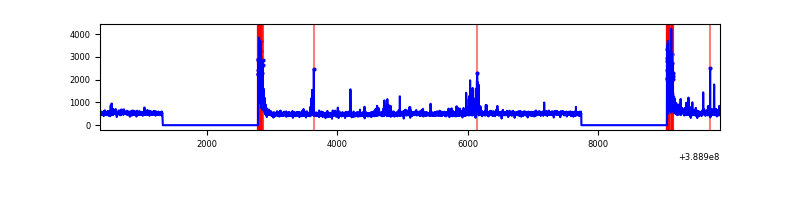 |
| D | 9506 | 6732 | 126 | 126 | 1.33% | 1.87% | 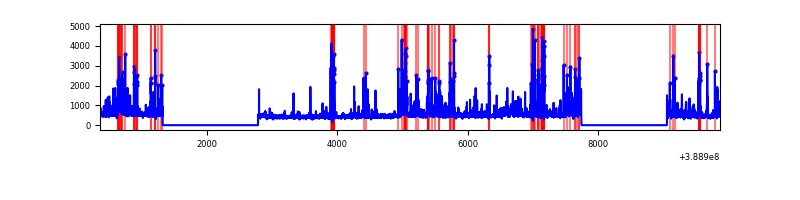 |
Top three noisy pixels from each quadrant. If the there are fewer than three noisy pixels in the level2.evt file, extra rows are filled as -1
| Pixel properties | Quadrant properties | ||||||
|---|---|---|---|---|---|---|---|
| Quadrant | DetID | PixID | Counts | Sigma | Mean | Median | Sigma |
| A | 10 | 83 | 157691 | 989.93 | 783 | 766 | 158.5 |
| A | 5 | 168 | 22468 | 136.9 | 783 | 766 | 158.5 |
| A | 15 | 169 | 15694 | 94.17 | 783 | 766 | 158.5 |
| B | 5 | 172 | 1350895 | 9163.83 | 764 | 744 | 147.3 |
| B | 15 | 85 | 184510 | 1247.27 | 764 | 744 | 147.3 |
| B | 4 | 81 | 26583 | 175.38 | 764 | 744 | 147.3 |
| C | 0 | 10 | 422451 | 2333.64 | 762 | 766 | 180.7 |
| C | 15 | 214 | 279133 | 1540.5 | 762 | 766 | 180.7 |
| C | 0 | 207 | 42474 | 230.82 | 762 | 766 | 180.7 |
| D | 7 | 80 | 460405 | 2475.96 | 758 | 737 | 185.7 |
| D | 12 | 17 | 176716 | 947.9 | 758 | 737 | 185.7 |
| D | 12 | 6 | 144493 | 774.33 | 758 | 737 | 185.7 |
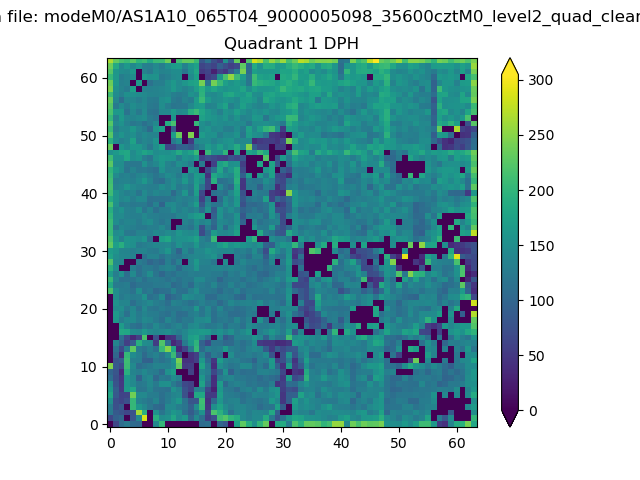
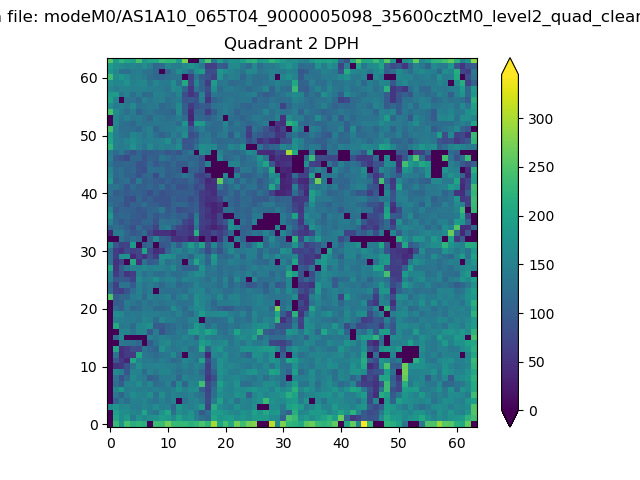
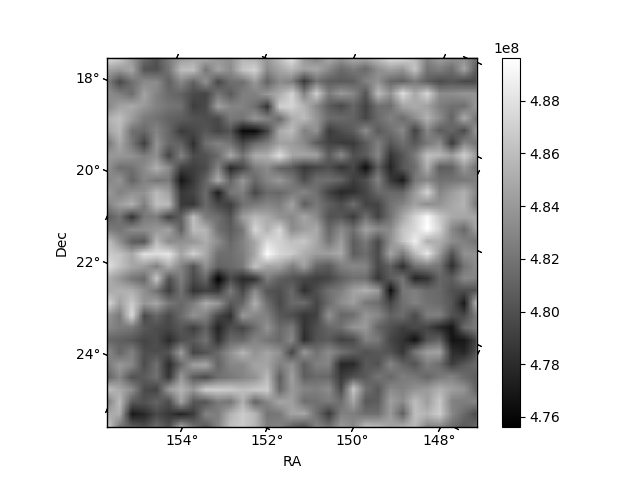
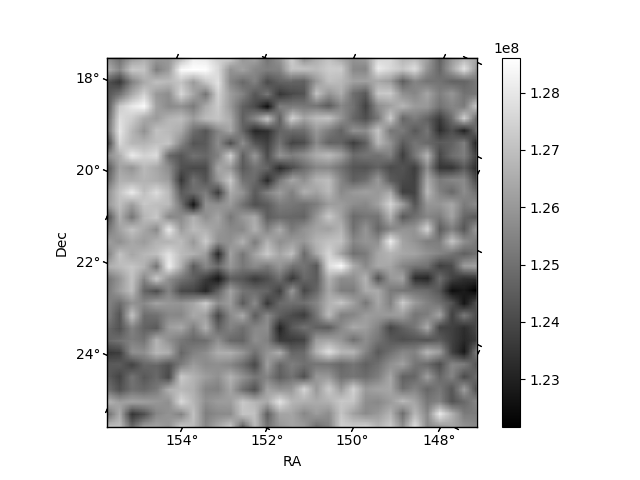
Histogram calculated using DETX and DETY for each event in the final _common_clean file
| Quadrant A |  |
 |
Quadrant B |
|---|---|---|---|
| Quadrant D | 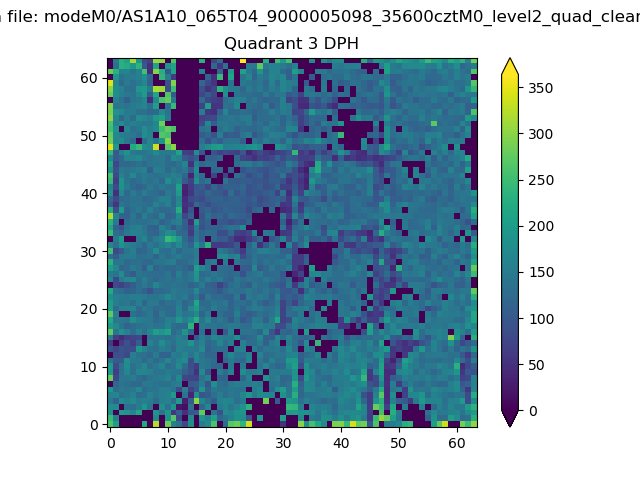 |
 |
Quadrant C |
| Plot type | Count rate plots | Images |
|---|---|---|
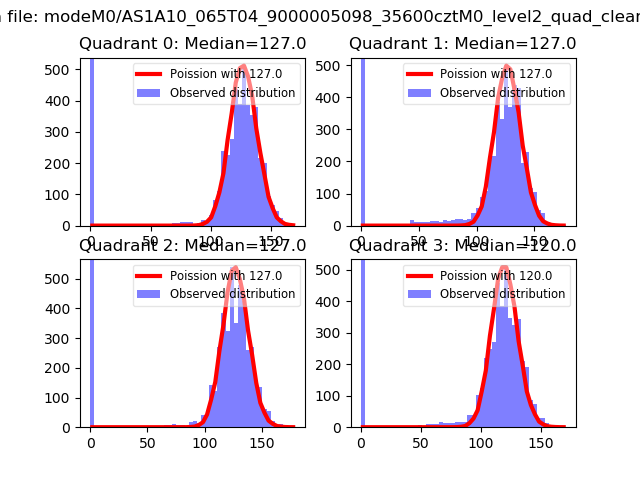
| Comparison with Poisson distribution Blue bars denote a histogram of data divided into 1 sec bins. Red curve is a Poisson curve with rate = median count rate of data. |
 |
 |
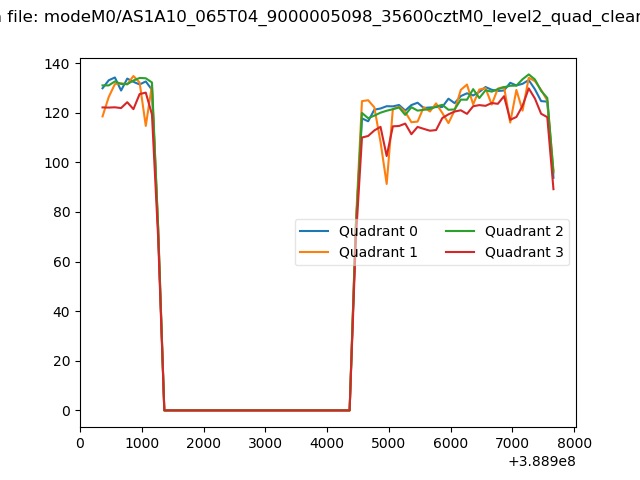
| Quadrant-wise count rates Data is divided into 100 sec bins |
 |
|
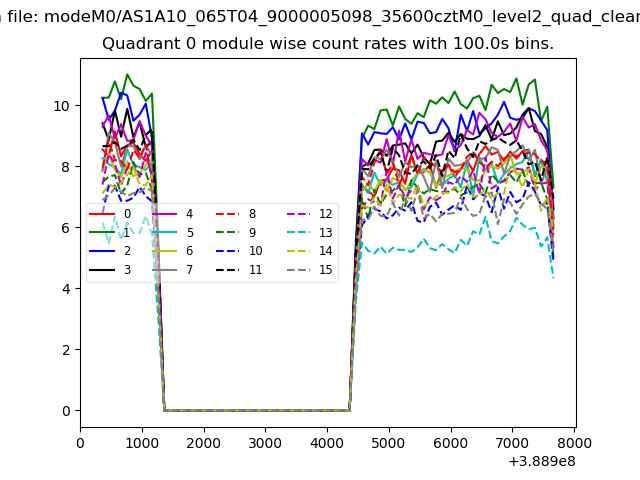
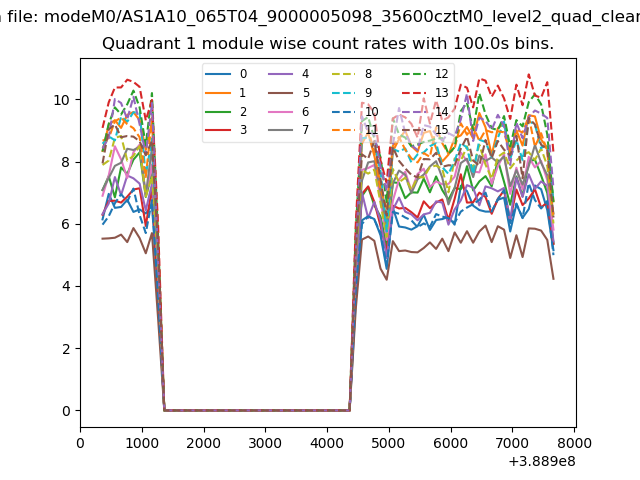
| Module-wise count rates for Quadrant A Data is divided into 100 sec bins |
 |
 |
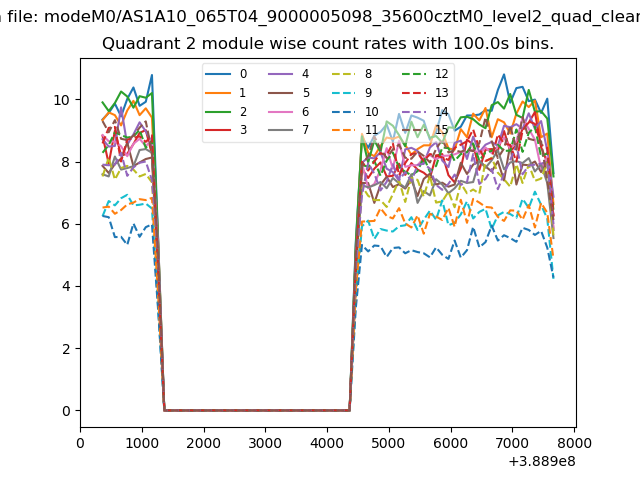
| Module-wise count rates for Quadrant B Data is divided into 100 sec bins |
 |
 |
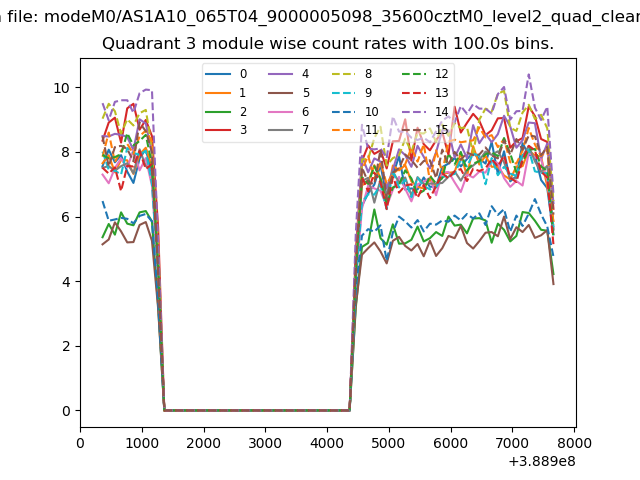
| Module-wise count rates for Quadrant C Data is divided into 100 sec bins |
 |
 |
| Module-wise count rates for Quadrant D Data is divided into 100 sec bins |
 |
 |
| Parameter | Plot |
|---|---|
| CZT HV Monitor |  |
| D_VDD | 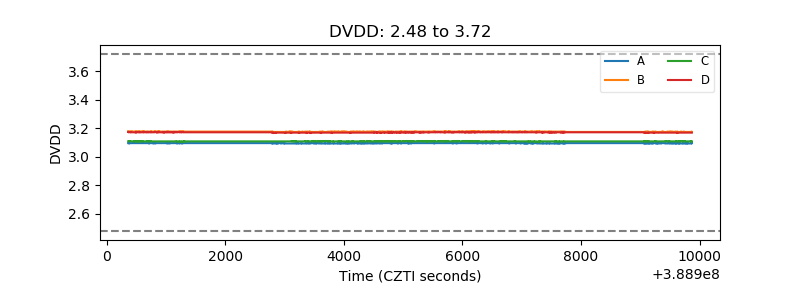 |
| Temperature 1 | 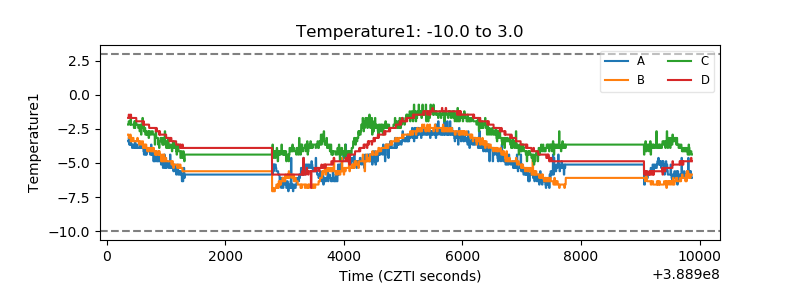 |
| Veto HV Monitor | 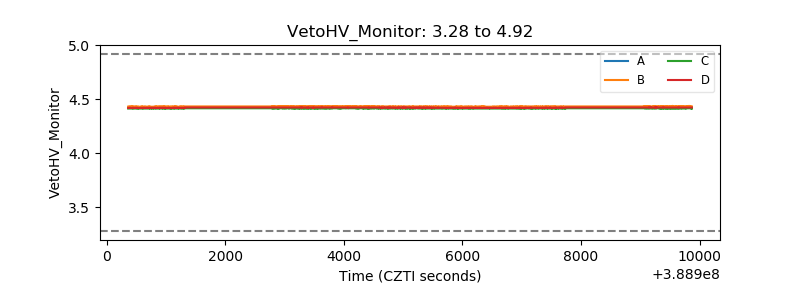 |
| Veto LLD | 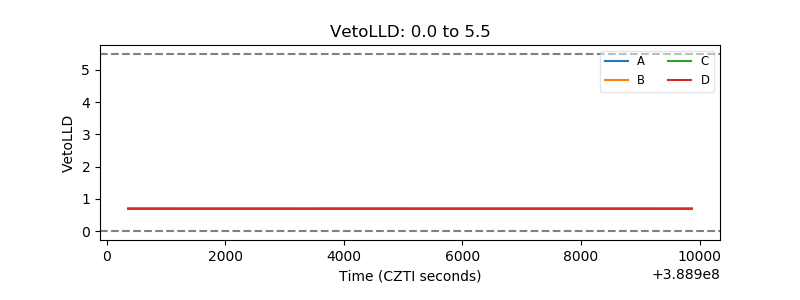 |
| Alpha Counter | 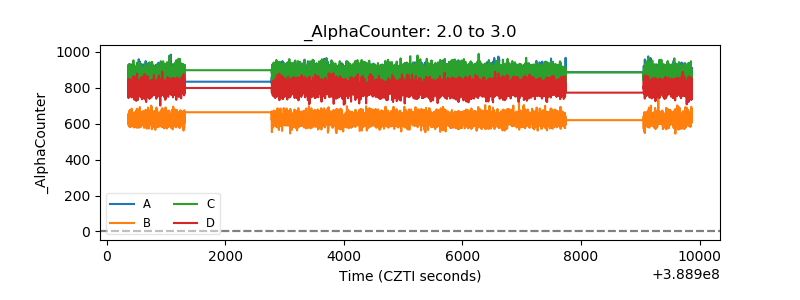 |
| _CPM_Rate | 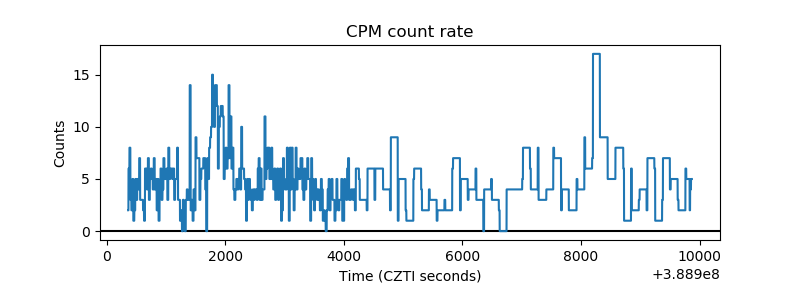 |
| CZT Counter | 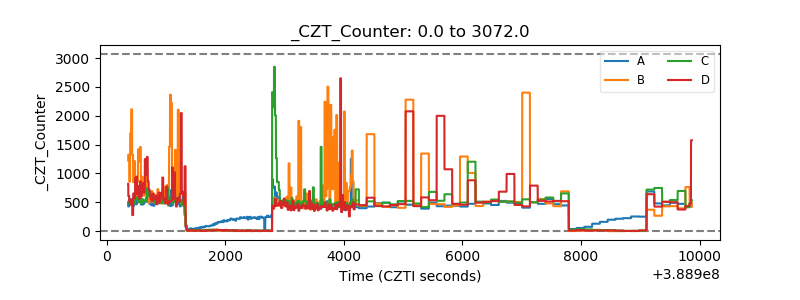 |
| +2.5 Volts monitor | 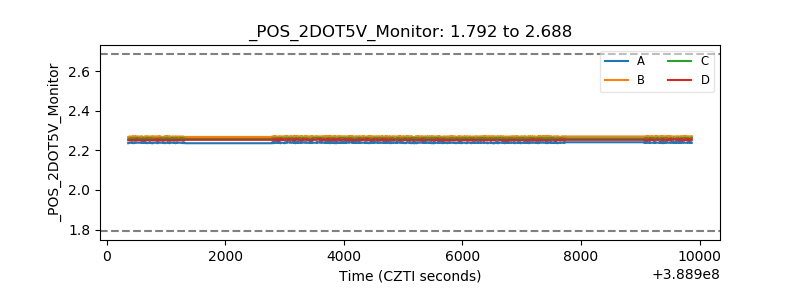 |
| +5 Volts monitor | 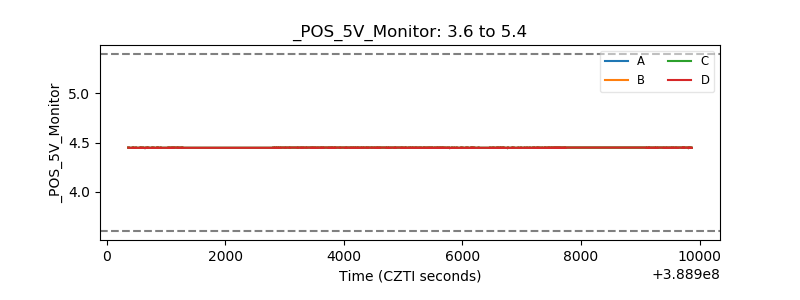 |
| _ROLL_ROT | 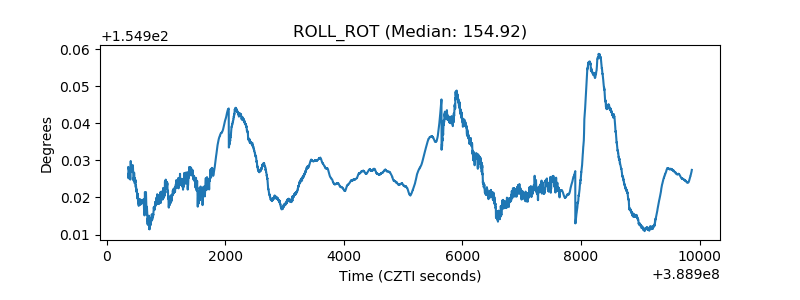 |
| _Roll_DEC | 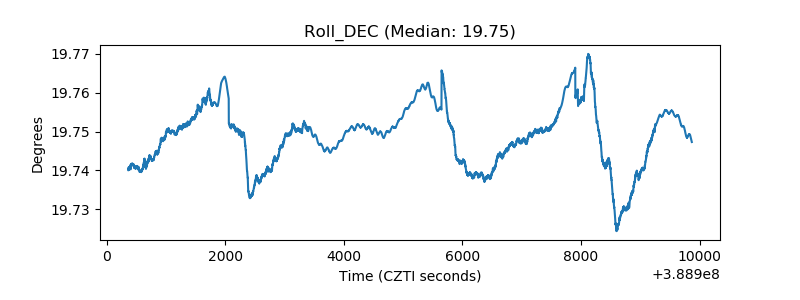 |
| _Roll_RA | 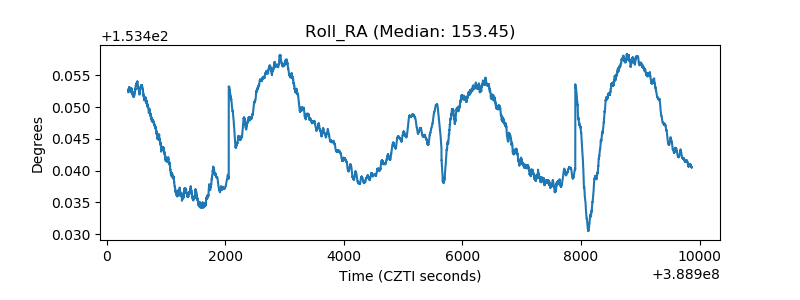 |
| Veto Counter | 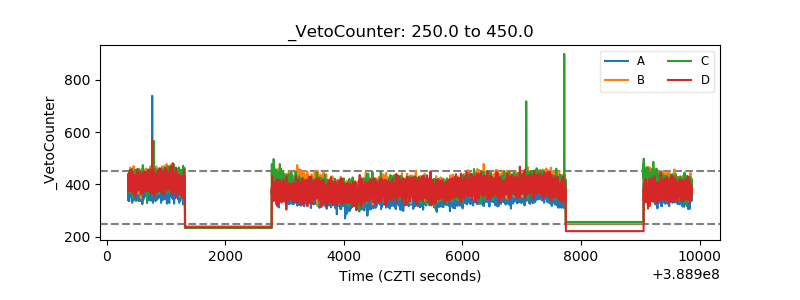 |