| Param | Original file | Final file |
|---|---|---|
| Filename | modeM0/AS1A10_065T04_9000005098_35599cztM0_level2.evt | modeM0/AS1A10_065T04_9000005098_35599cztM0_level2_quad_clean.evt |
| Size (bytes) | 432,017,280 | 57,104,640 |
| Size | 412.0 MB | 54.5 MB |
| Events in quadrant A | 2,733,944 | 339,839 |
| Events in quadrant B | 3,561,126 | 337,647 |
| Events in quadrant C | 3,098,423 | 337,904 |
| Events in quadrant D | 3,302,936 | 314,969 |
| Mode M9 | |||
|---|---|---|---|
| Quadrant | BADHDUFLAG | Total packets | Discarded packets |
| A | 0 | 28 | 0 |
| B | 0 | 28 | 0 |
| C | 0 | 28 | 0 |
| D | 0 | 29 | 0 |
| Mode M0 | |||
|---|---|---|---|
| Quadrant | BADHDUFLAG | Total packets | Discarded packets |
| A | 0 | 11659 | 3 |
| B | 0 | 14341 | 2 |
| C | 0 | 12441 | 2 |
| D | 0 | 13774 | 2 |
| Mode SS | |||
|---|---|---|---|
| Quadrant | BADHDUFLAG | Total packets | Discarded packets |
| A | 0 | 118 | 0 |
| B | 0 | 118 | 0 |
| C | 0 | 118 | 0 |
| D | 0 | 118 | 0 |
| Quadrant | Total seconds | Saturated seconds | Saturation percentage |
|---|---|---|---|
| A | 5691 | 8 | 0.140573% |
| B | 5691 | 207 | 3.637322% |
| C | 5691 | 103 | 1.809875% |
| D | 5691 | 85 | 1.493586% |
Noise dominated data is calculated using 1-second bins in cleaned event files. If a bin has >2000 counts, and if more than 50% of those come from <1% of pixels, then it is considered to be noise-dominated and hence unusable.
| Quadrant | # 1 sec bins | Bins with >0 counts | Bins with >2000 counts | High rate bins dominated by noise | Noise dominated (total time) | Noise dominated (detector-on time) | Marked lightcurve |
|---|---|---|---|---|---|---|---|
| A | 7154 | 5692 | 1 | 1 | 0.01% | 0.02% | 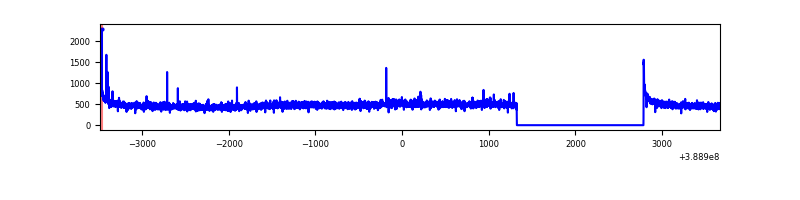 |
| B | 7154 | 5692 | 129 | 129 | 1.80% | 2.27% | 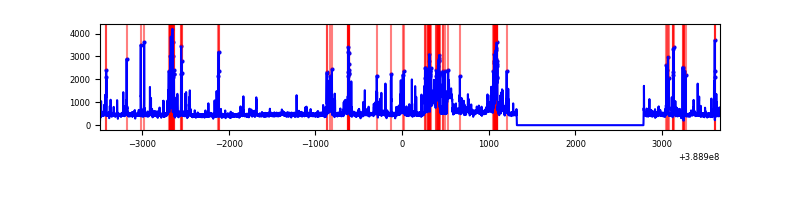 |
| C | 7154 | 5692 | 76 | 76 | 1.06% | 1.34% | 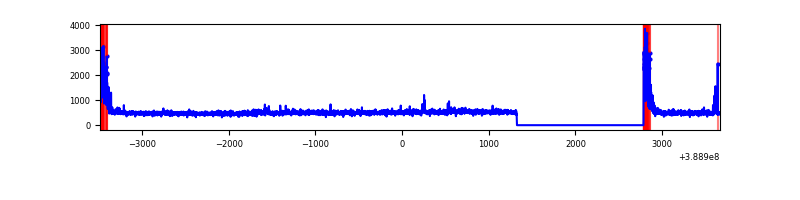 |
| D | 7154 | 5692 | 75 | 75 | 1.05% | 1.32% | 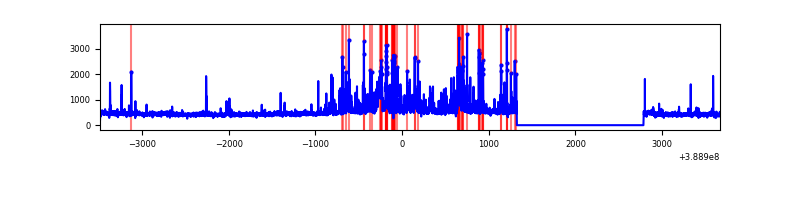 |
Top three noisy pixels from each quadrant. If the there are fewer than three noisy pixels in the level2.evt file, extra rows are filled as -1
| Pixel properties | Quadrant properties | ||||||
|---|---|---|---|---|---|---|---|
| Quadrant | DetID | PixID | Counts | Sigma | Mean | Median | Sigma |
| A | 10 | 83 | 141589 | 1057.57 | 657 | 643 | 133.3 |
| A | 15 | 169 | 31027 | 227.98 | 657 | 643 | 133.3 |
| A | 8 | 6 | 7554 | 51.86 | 657 | 643 | 133.3 |
| B | 5 | 172 | 839339 | 6609.49 | 646 | 629 | 126.9 |
| B | 15 | 85 | 100765 | 789.13 | 646 | 629 | 126.9 |
| B | 4 | 81 | 35536 | 275.09 | 646 | 629 | 126.9 |
| C | 0 | 10 | 355858 | 2381.3 | 636 | 640 | 149.2 |
| C | 15 | 214 | 237842 | 1590.15 | 636 | 640 | 149.2 |
| C | 0 | 207 | 11462 | 72.55 | 636 | 640 | 149.2 |
| D | 12 | 17 | 290618 | 1842.41 | 635 | 616 | 157.4 |
| D | 7 | 80 | 226550 | 1435.38 | 635 | 616 | 157.4 |
| D | 10 | 199 | 90959 | 573.96 | 635 | 616 | 157.4 |
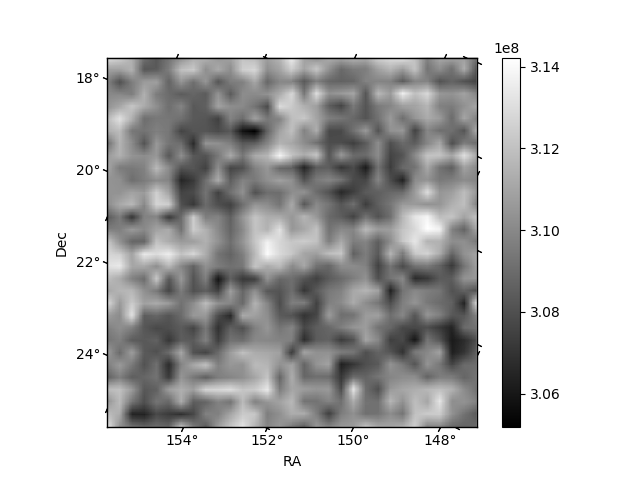
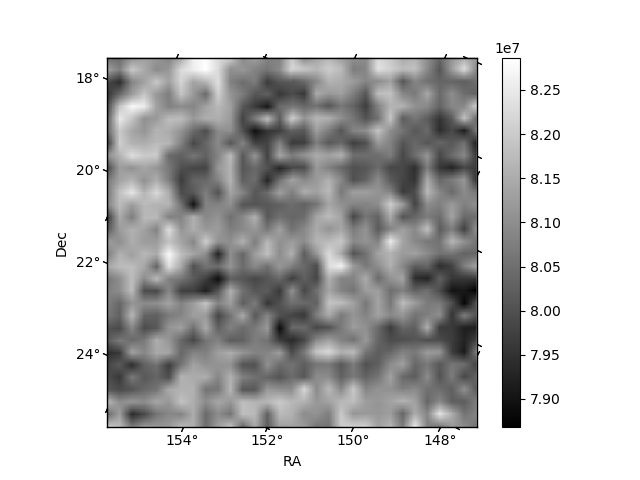
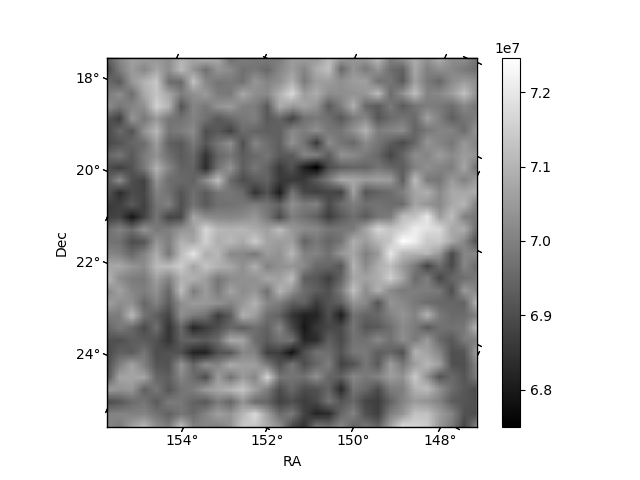
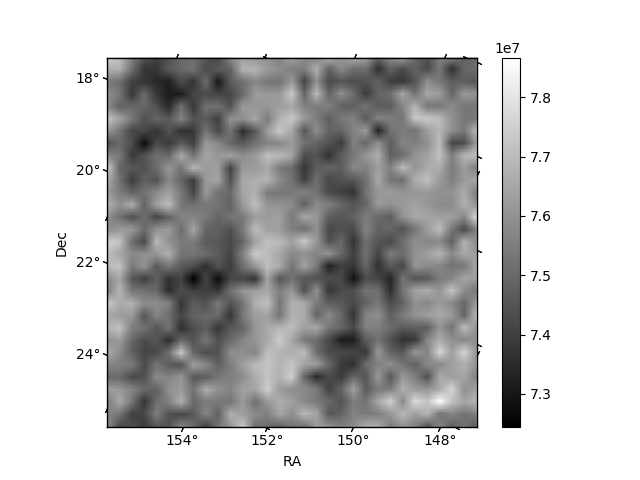
Histogram calculated using DETX and DETY for each event in the final _common_clean file
| Quadrant A | 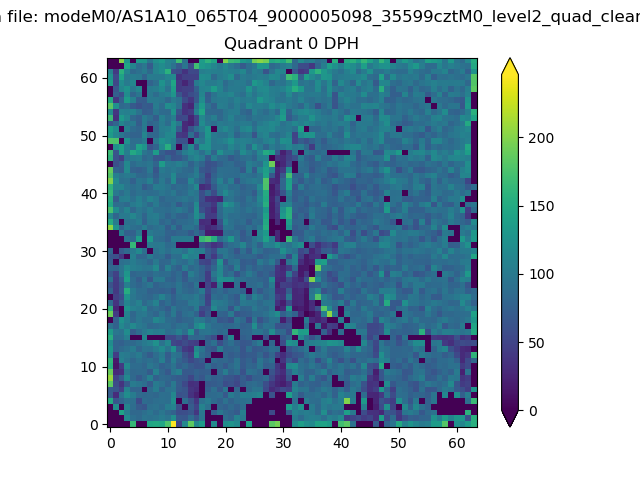 |
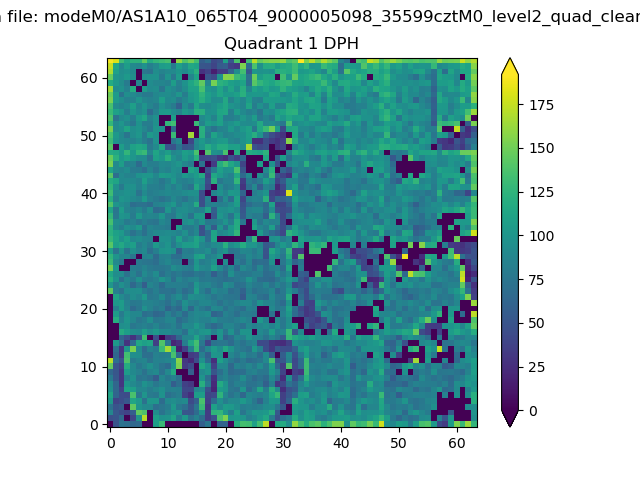 |
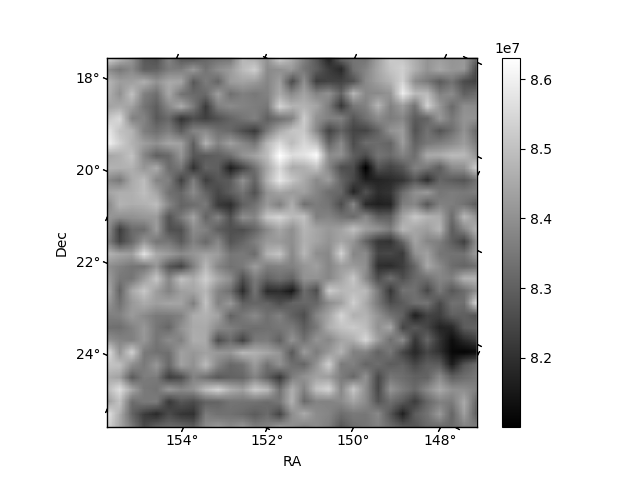
Quadrant B |
|---|---|---|---|
| Quadrant D | 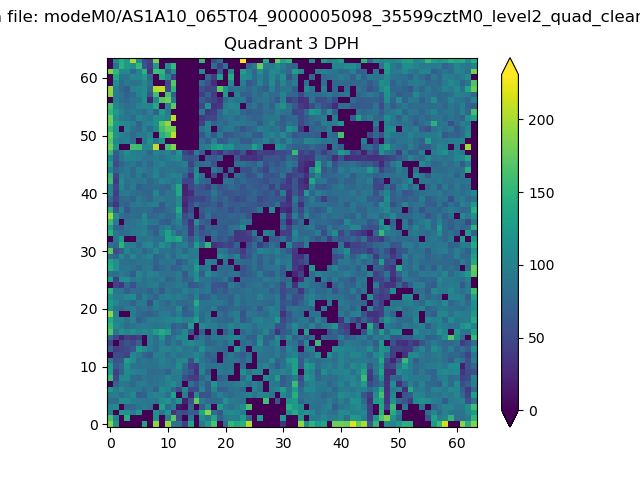 |
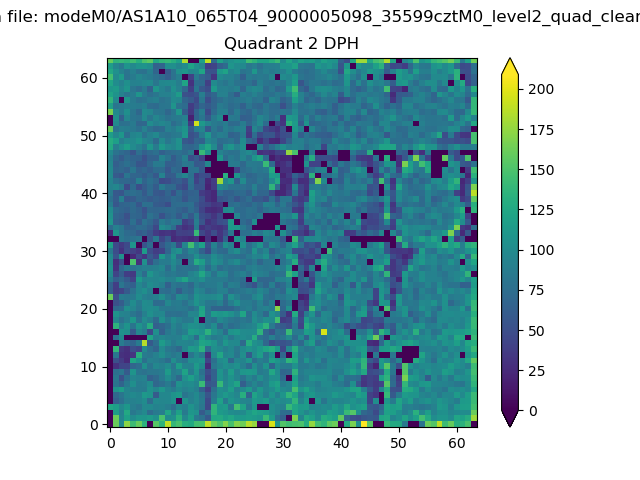 |
Quadrant C |
| Plot type | Count rate plots | Images |
|---|---|---|
| Comparison with Poisson distribution Blue bars denote a histogram of data divided into 1 sec bins. Red curve is a Poisson curve with rate = median count rate of data. |
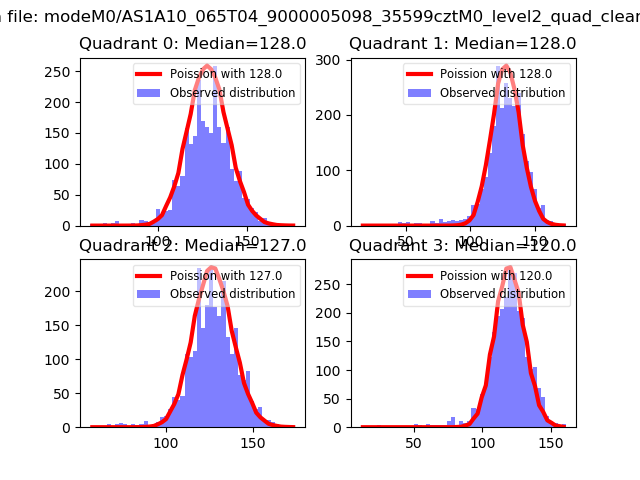 |
 |
| Quadrant-wise count rates Data is divided into 100 sec bins |
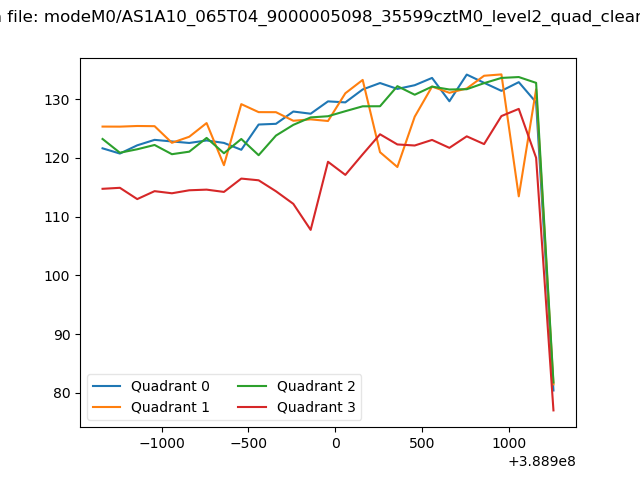 |
|
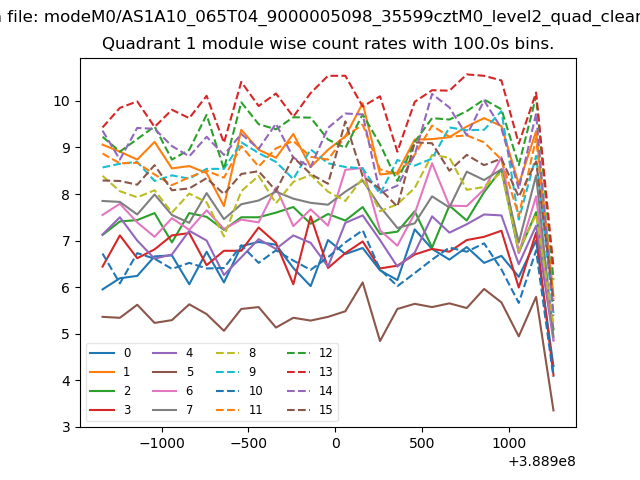
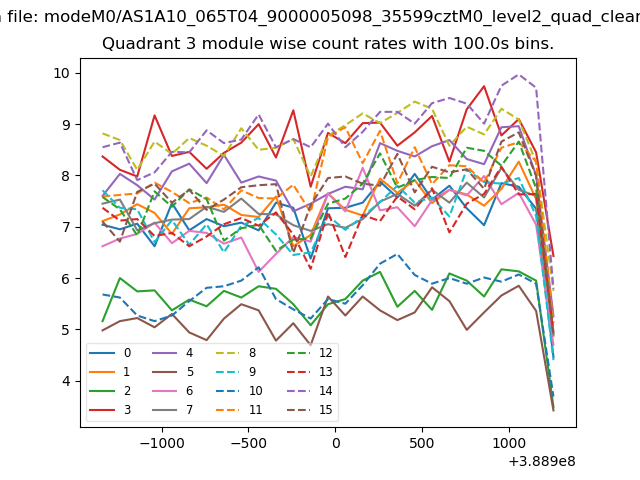
| Module-wise count rates for Quadrant A Data is divided into 100 sec bins |
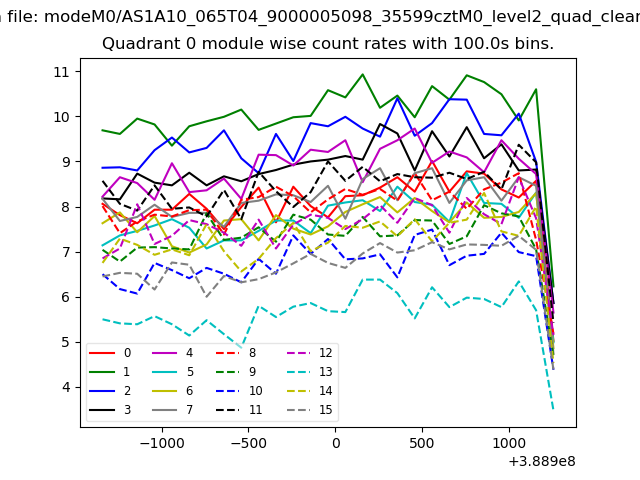 |
 |
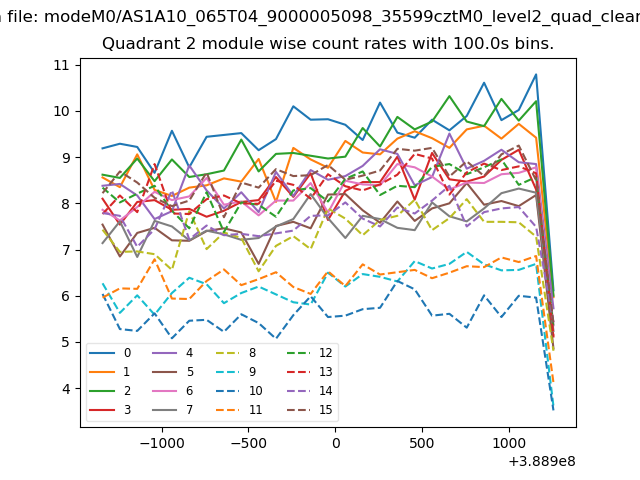
| Module-wise count rates for Quadrant B Data is divided into 100 sec bins |
 |
 |
| Module-wise count rates for Quadrant C Data is divided into 100 sec bins |
 |
 |
| Module-wise count rates for Quadrant D Data is divided into 100 sec bins |
 |
 |
| Parameter | Plot |
|---|---|
| CZT HV Monitor | 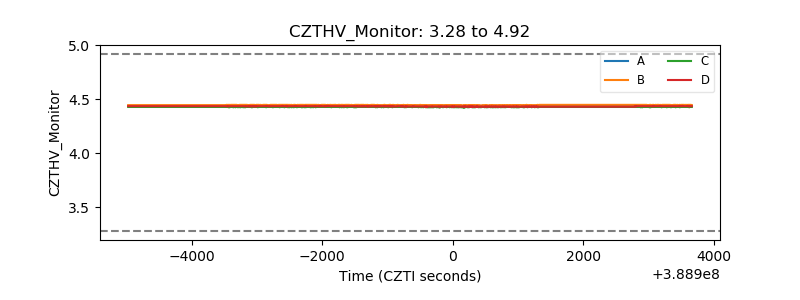 |
| D_VDD | 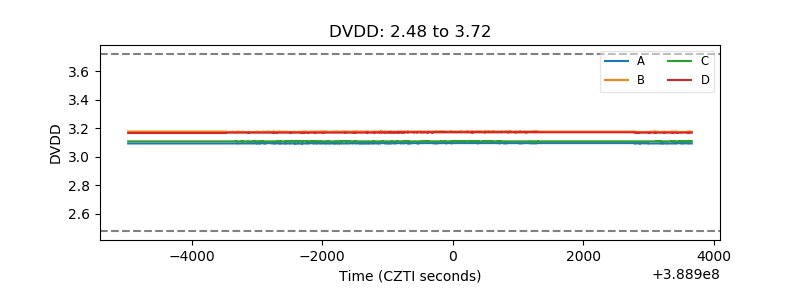 |
| Temperature 1 | 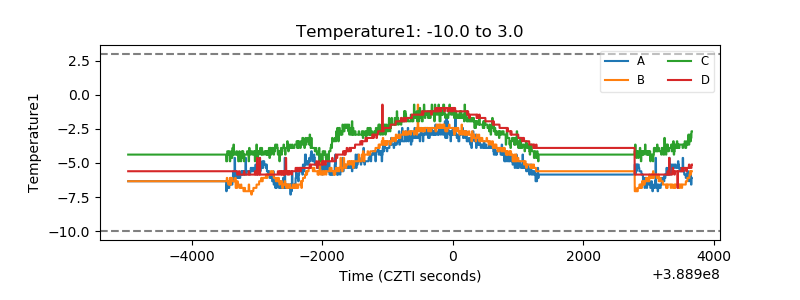 |
| Veto HV Monitor | 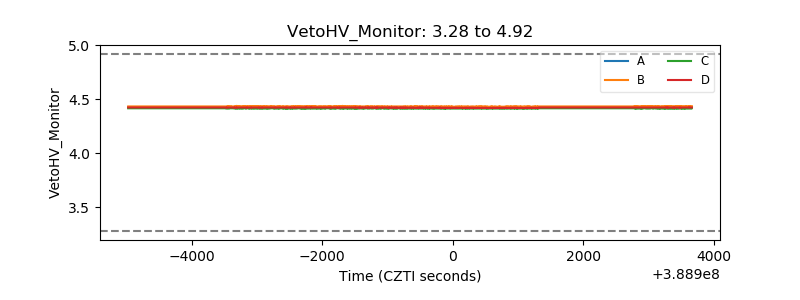 |
| Veto LLD | 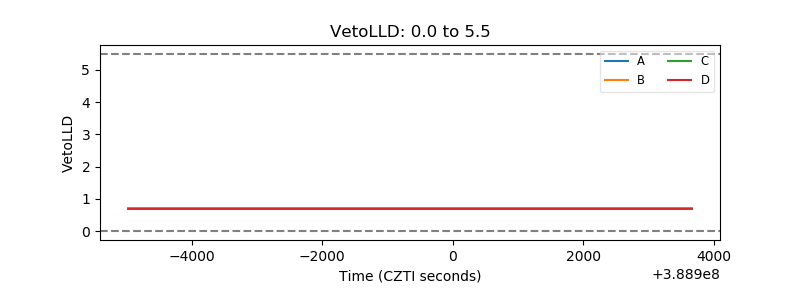 |
| Alpha Counter | 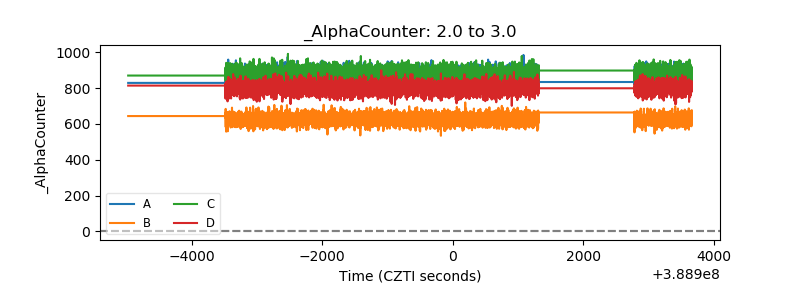 |
| _CPM_Rate | 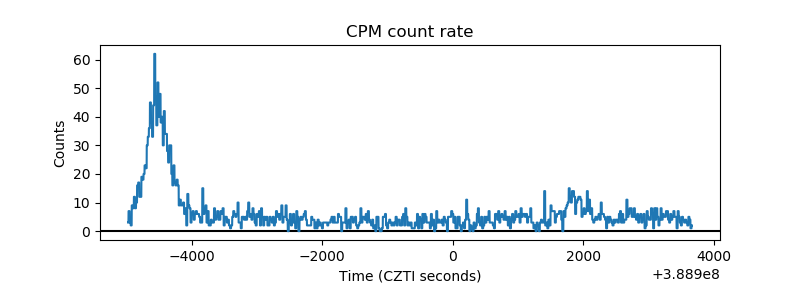 |
| CZT Counter | 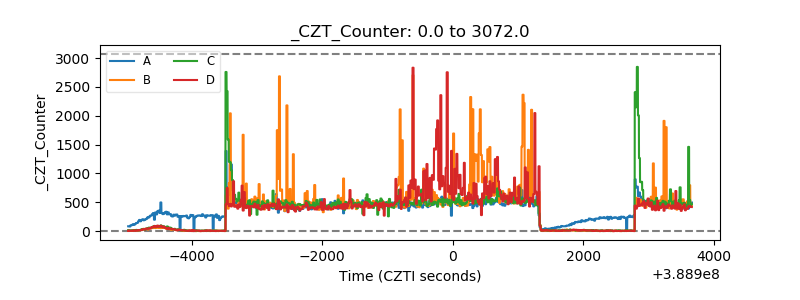 |
| +2.5 Volts monitor | 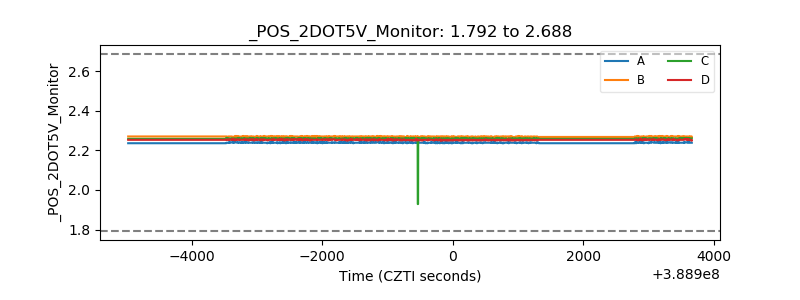 |
| +5 Volts monitor | 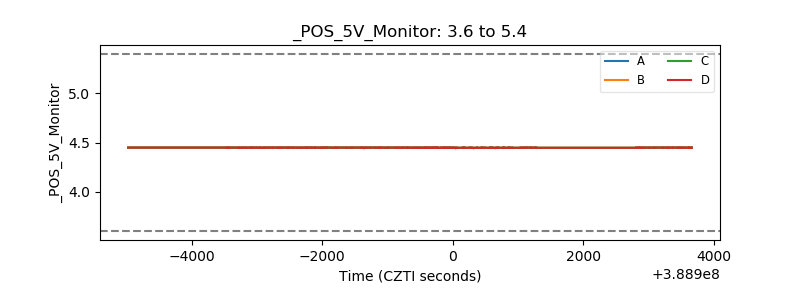 |
| _ROLL_ROT | 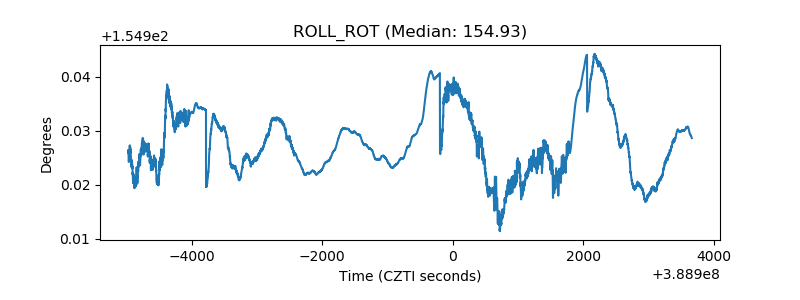 |
| _Roll_DEC | 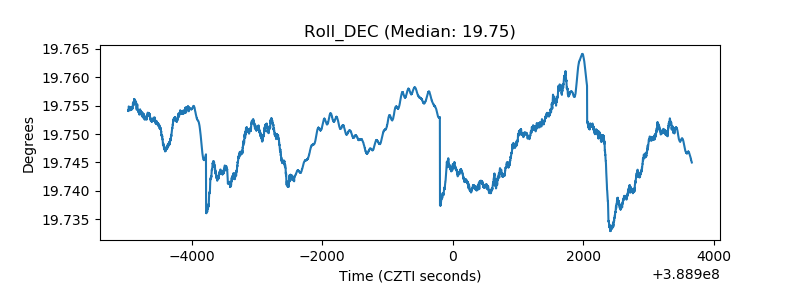 |
| _Roll_RA | 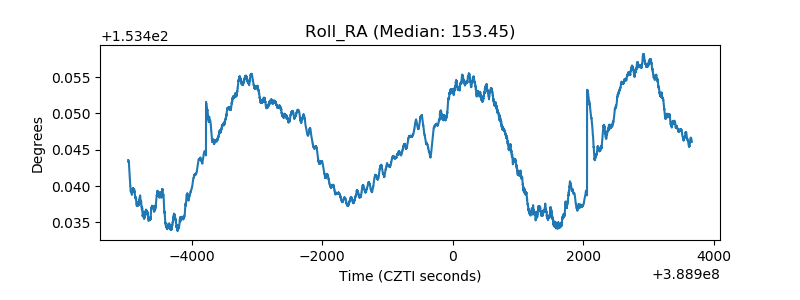 |
| Veto Counter | 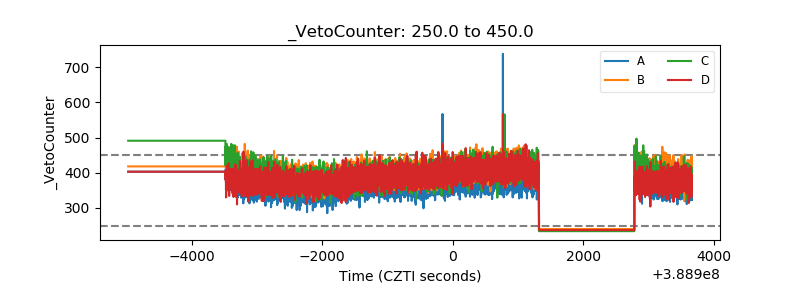 |