| Param | Original file | Final file |
|---|---|---|
| Filename | modeM0/AS1A10_065T04_9000005098_35598cztM0_level2.evt | modeM0/AS1A10_065T04_9000005098_35598cztM0_level2_quad_clean.evt |
| Size (bytes) | 416,033,280 | 52,787,520 |
| Size | 396.8 MB | 50.3 MB |
| Events in quadrant A | 2,822,641 | 313,067 |
| Events in quadrant B | 3,122,533 | 313,272 |
| Events in quadrant C | 3,065,256 | 301,600 |
| Events in quadrant D | 3,224,298 | 294,200 |
| Mode M9 | |||
|---|---|---|---|
| Quadrant | BADHDUFLAG | Total packets | Discarded packets |
| A | 0 | 38 | 0 |
| B | 0 | 38 | 0 |
| C | 0 | 38 | 0 |
| D | 0 | 38 | 0 |
| Mode M0 | |||
|---|---|---|---|
| Quadrant | BADHDUFLAG | Total packets | Discarded packets |
| A | 0 | 11719 | 3 |
| B | 0 | 12833 | 2 |
| C | 0 | 12252 | 2 |
| D | 0 | 13164 | 2 |
| Mode SS | |||
|---|---|---|---|
| Quadrant | BADHDUFLAG | Total packets | Discarded packets |
| A | 0 | 112 | 0 |
| B | 0 | 112 | 0 |
| C | 0 | 112 | 0 |
| D | 0 | 112 | 0 |
| Quadrant | Total seconds | Saturated seconds | Saturation percentage |
|---|---|---|---|
| A | 5364 | 19 | 0.354213% |
| B | 5364 | 117 | 2.181208% |
| C | 5364 | 165 | 3.076063% |
| D | 5364 | 107 | 1.994780% |
Noise dominated data is calculated using 1-second bins in cleaned event files. If a bin has >2000 counts, and if more than 50% of those come from <1% of pixels, then it is considered to be noise-dominated and hence unusable.
| Quadrant | # 1 sec bins | Bins with >0 counts | Bins with >2000 counts | High rate bins dominated by noise | Noise dominated (total time) | Noise dominated (detector-on time) | Marked lightcurve |
|---|---|---|---|---|---|---|---|
| A | 9217 | 5366 | 7 | 7 | 0.08% | 0.13% | 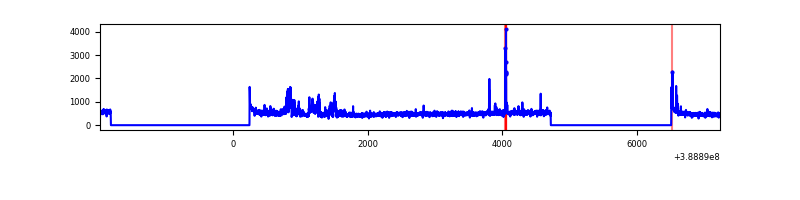 |
| B | 9217 | 5366 | 66 | 66 | 0.72% | 1.23% | 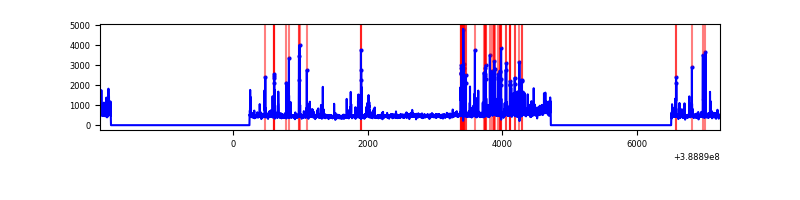 |
| C | 9217 | 5366 | 132 | 132 | 1.43% | 2.46% | 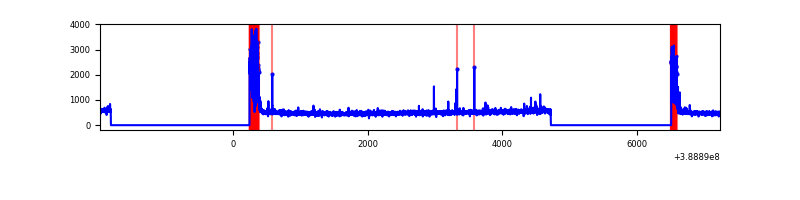 |
| D | 9217 | 5366 | 95 | 95 | 1.03% | 1.77% | 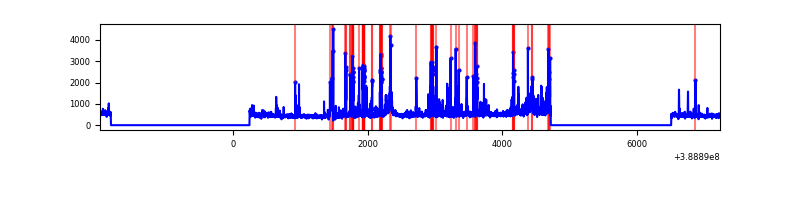 |
Top three noisy pixels from each quadrant. If the there are fewer than three noisy pixels in the level2.evt file, extra rows are filled as -1
| Pixel properties | Quadrant properties | ||||||
|---|---|---|---|---|---|---|---|
| Quadrant | DetID | PixID | Counts | Sigma | Mean | Median | Sigma |
| A | 15 | 169 | 248214 | 1978.72 | 624 | 614 | 125.1 |
| A | 10 | 83 | 136870 | 1088.9 | 624 | 614 | 125.1 |
| A | 13 | 6 | 9609 | 71.88 | 624 | 614 | 125.1 |
| B | 5 | 172 | 541458 | 4481.05 | 618 | 604 | 120.7 |
| B | 4 | 81 | 42091 | 343.73 | 618 | 604 | 120.7 |
| B | 0 | 182 | 37932 | 309.27 | 618 | 604 | 120.7 |
| C | 0 | 10 | 489818 | 3494.85 | 600 | 605 | 140.0 |
| C | 15 | 214 | 221049 | 1574.81 | 600 | 605 | 140.0 |
| C | 9 | 187 | 8134 | 53.79 | 600 | 605 | 140.0 |
| D | 7 | 80 | 351639 | 2382.44 | 603 | 587 | 147.4 |
| D | 13 | 249 | 298552 | 2022.16 | 603 | 587 | 147.4 |
| D | 2 | 153 | 47287 | 316.93 | 603 | 587 | 147.4 |
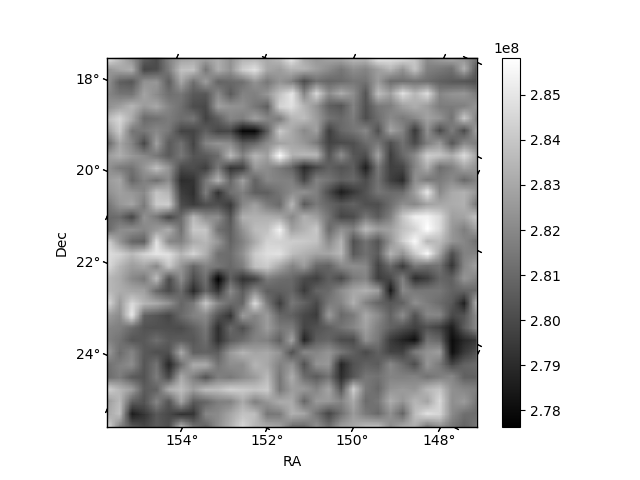
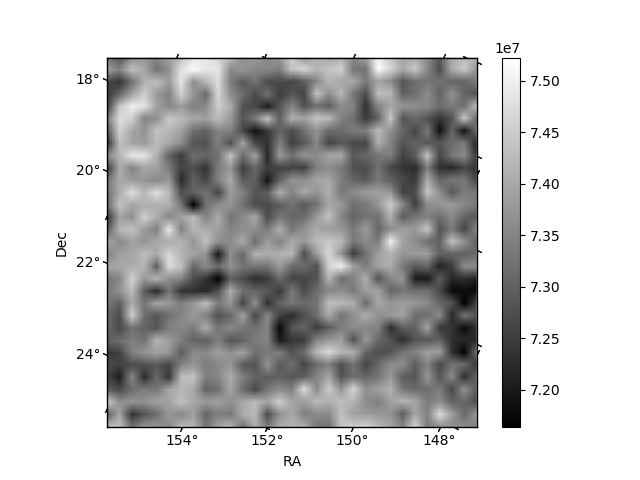
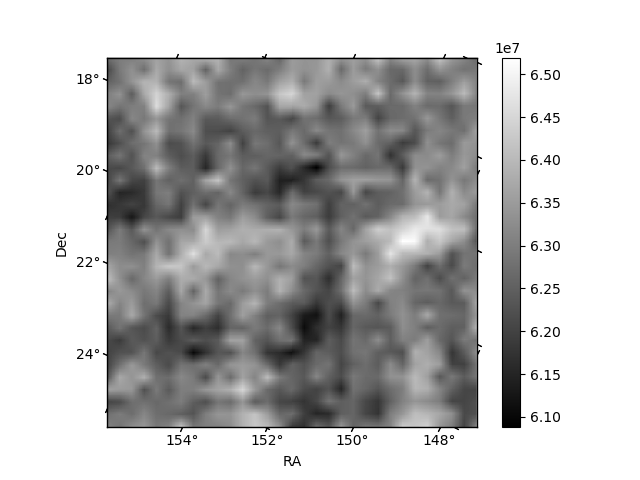
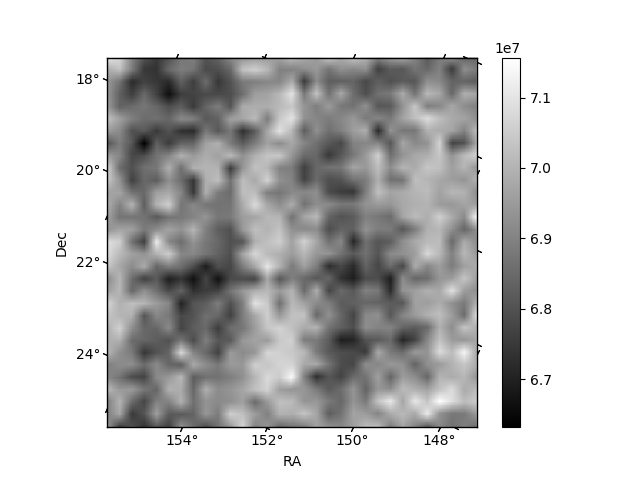
Histogram calculated using DETX and DETY for each event in the final _common_clean file
| Quadrant A | 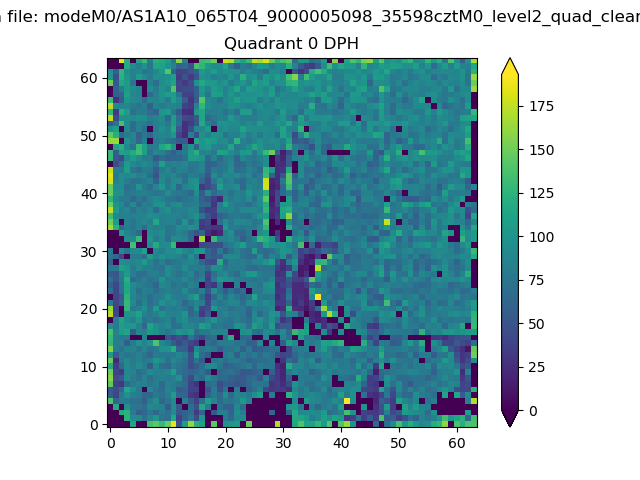 |
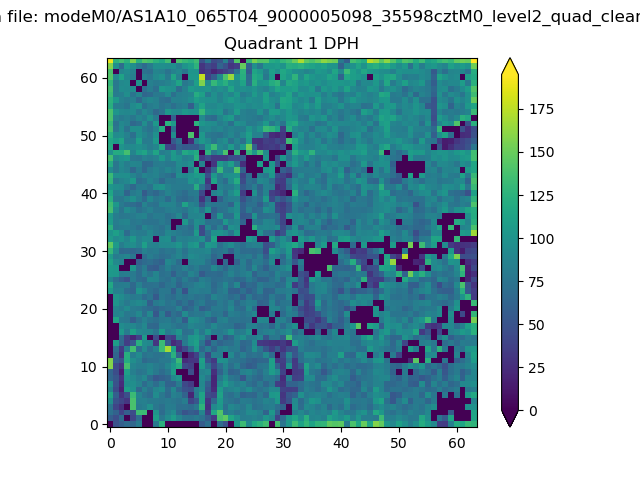 |
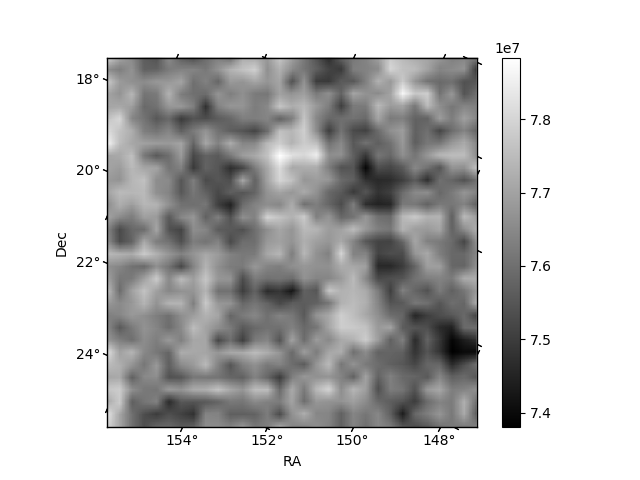
Quadrant B |
|---|---|---|---|
| Quadrant D | 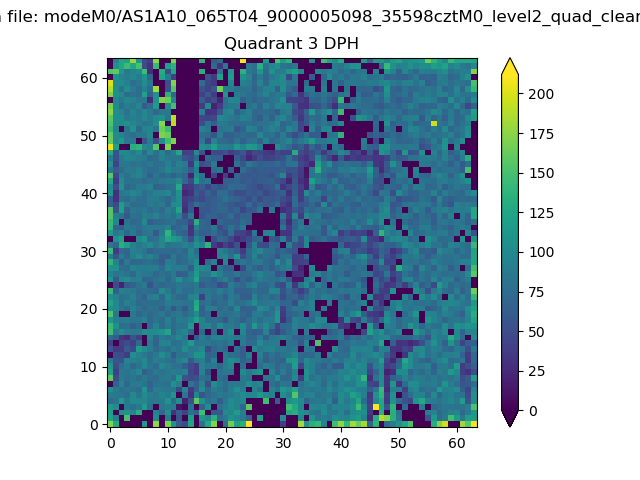 |
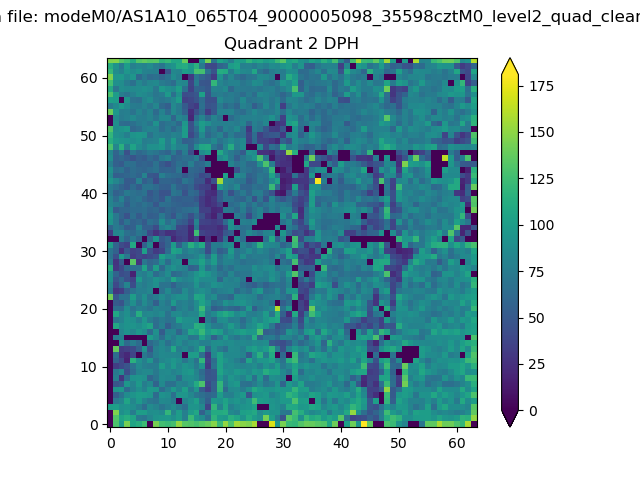 |
Quadrant C |
| Plot type | Count rate plots | Images |
|---|---|---|
| Comparison with Poisson distribution Blue bars denote a histogram of data divided into 1 sec bins. Red curve is a Poisson curve with rate = median count rate of data. |
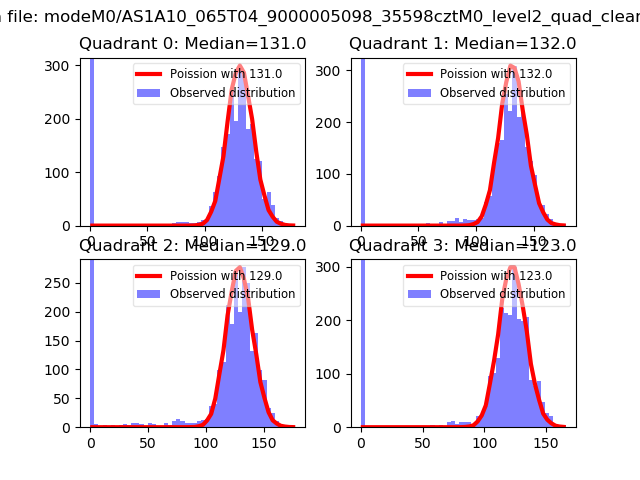 |
 |
| Quadrant-wise count rates Data is divided into 100 sec bins |
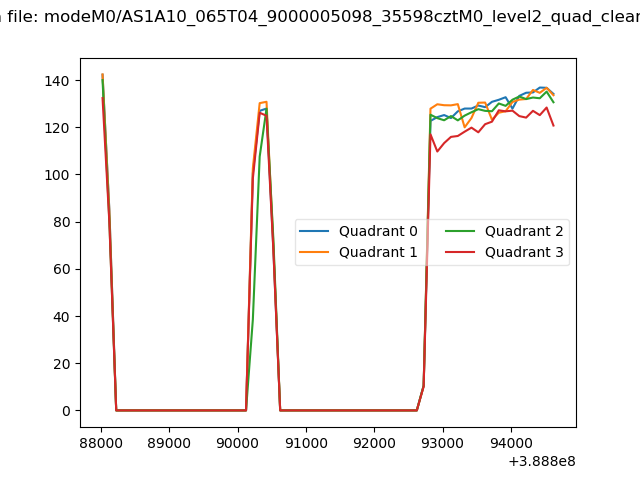 |
|
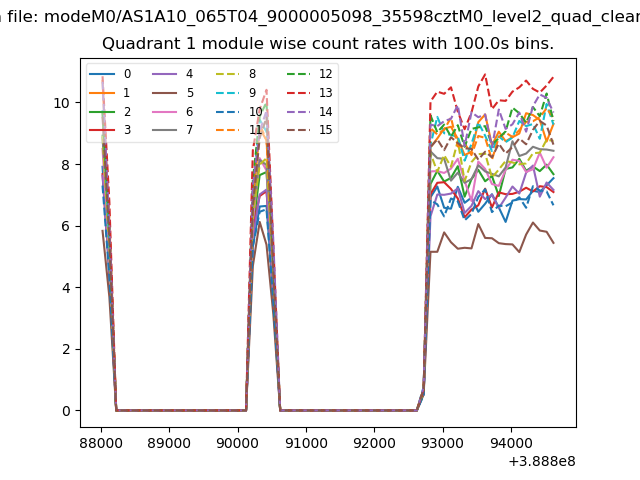
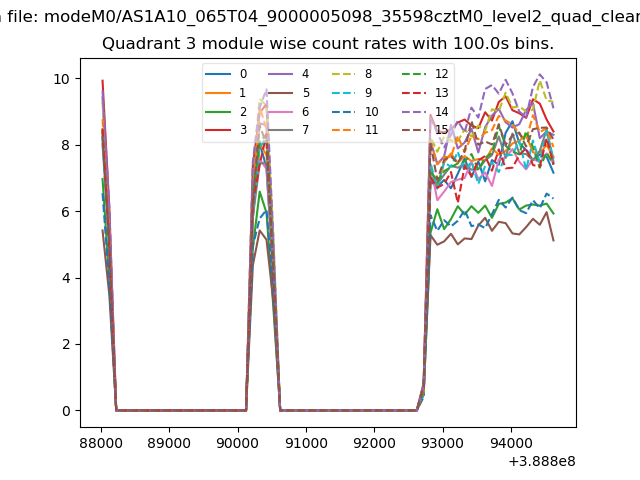
| Module-wise count rates for Quadrant A Data is divided into 100 sec bins |
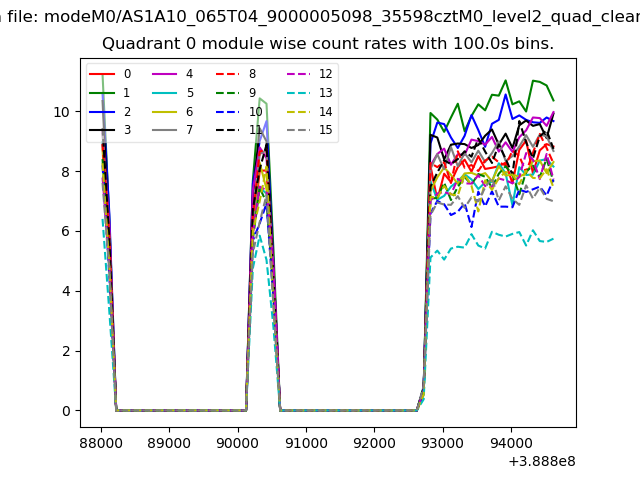 |
 |
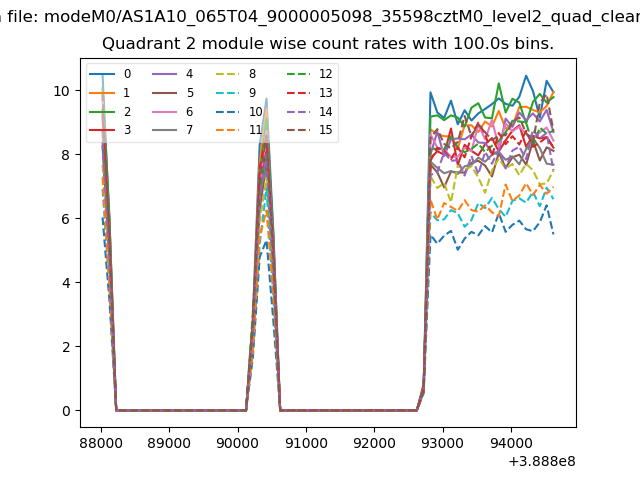
| Module-wise count rates for Quadrant B Data is divided into 100 sec bins |
 |
 |
| Module-wise count rates for Quadrant C Data is divided into 100 sec bins |
 |
 |
| Module-wise count rates for Quadrant D Data is divided into 100 sec bins |
 |
 |
| Parameter | Plot |
|---|---|
| CZT HV Monitor | 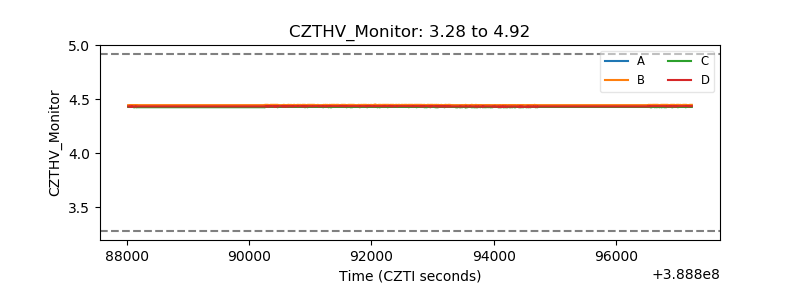 |
| D_VDD | 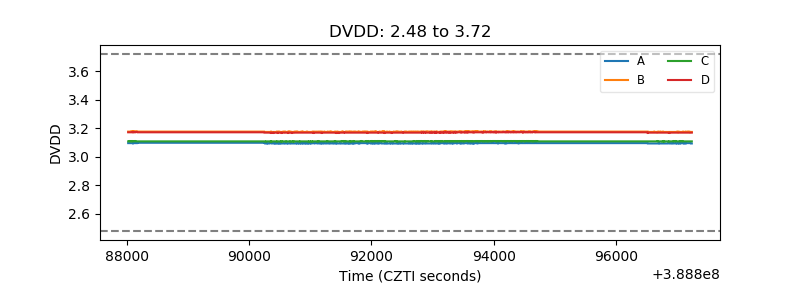 |
| Temperature 1 | 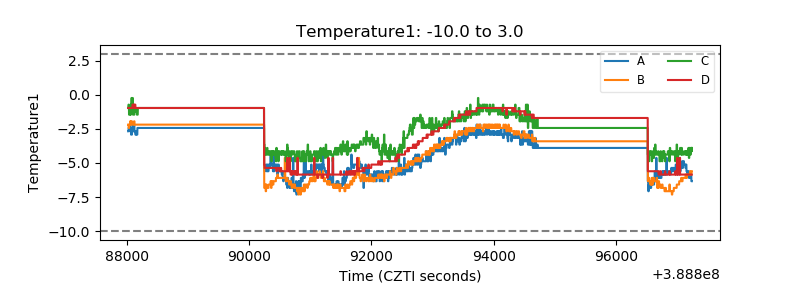 |
| Veto HV Monitor | 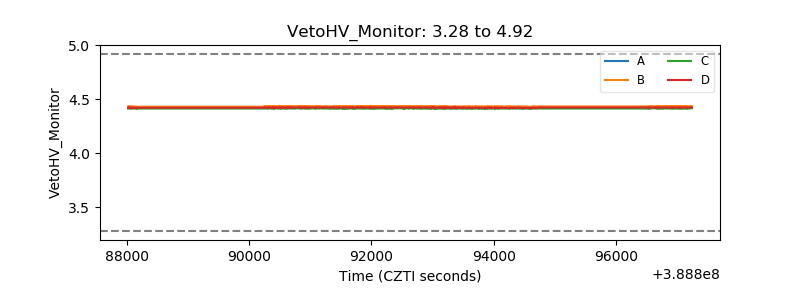 |
| Veto LLD | 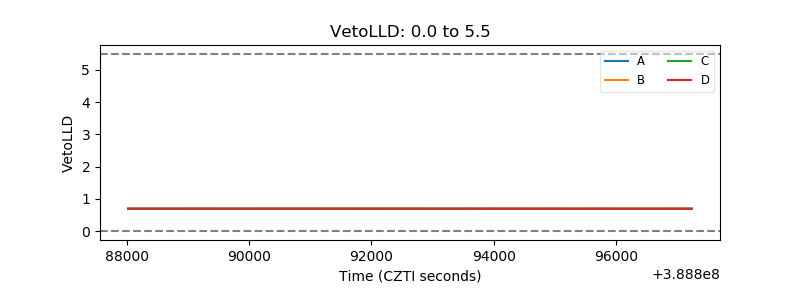 |
| Alpha Counter | 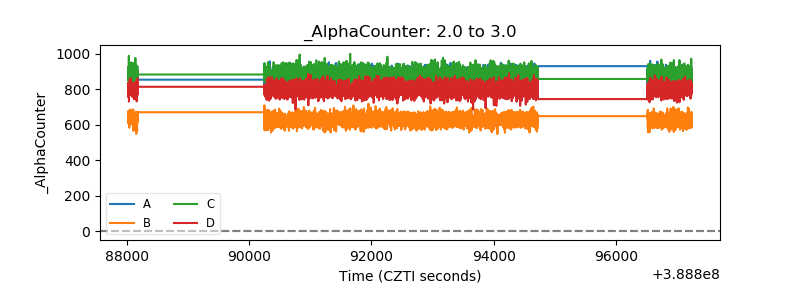 |
| _CPM_Rate | 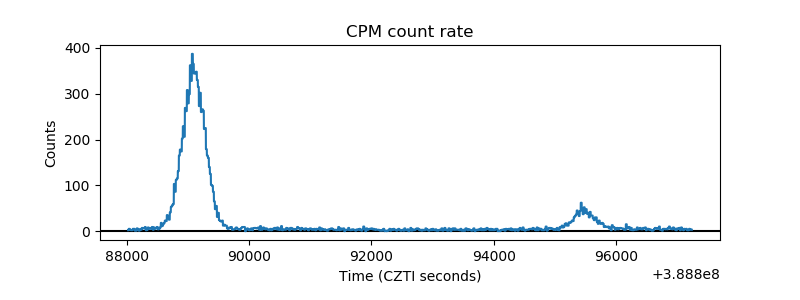 |
| CZT Counter | 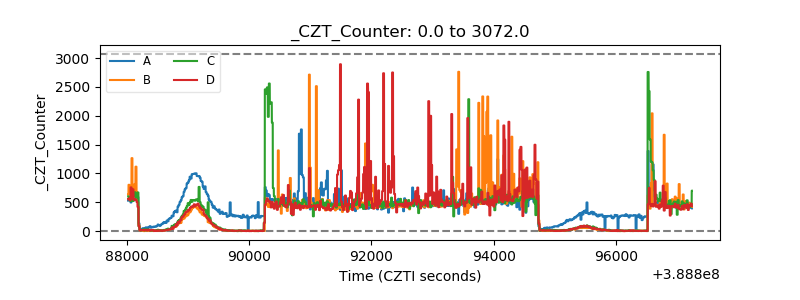 |
| +2.5 Volts monitor | 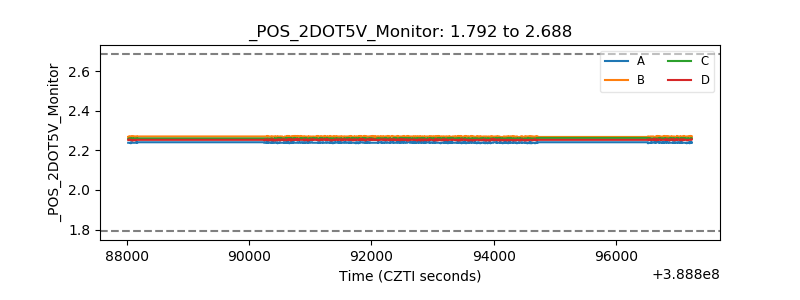 |
| +5 Volts monitor | 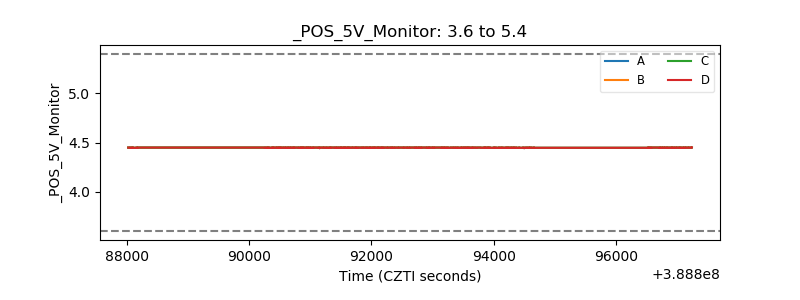 |
| _ROLL_ROT | 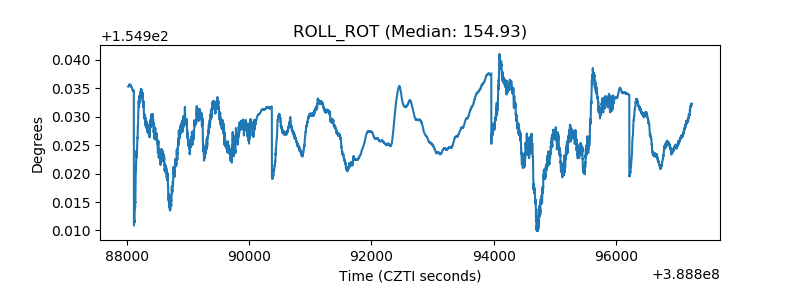 |
| _Roll_DEC | 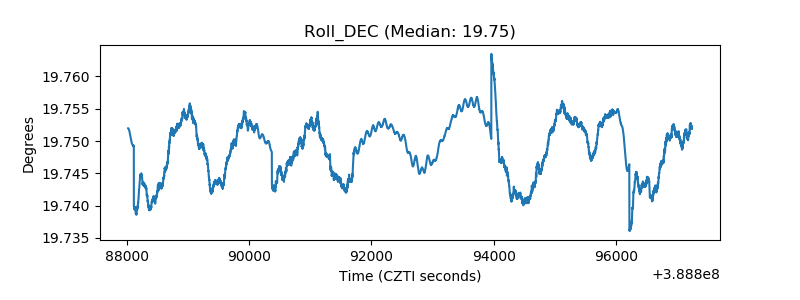 |
| _Roll_RA | 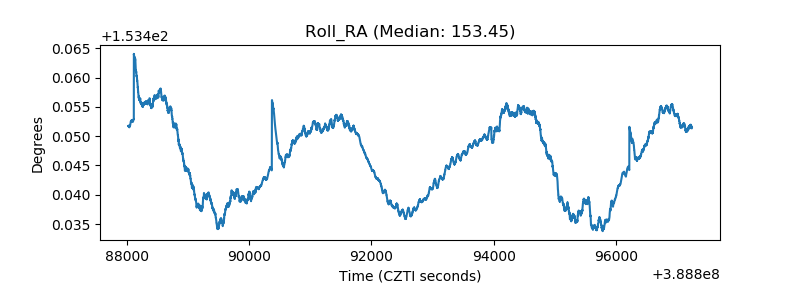 |
| Veto Counter | 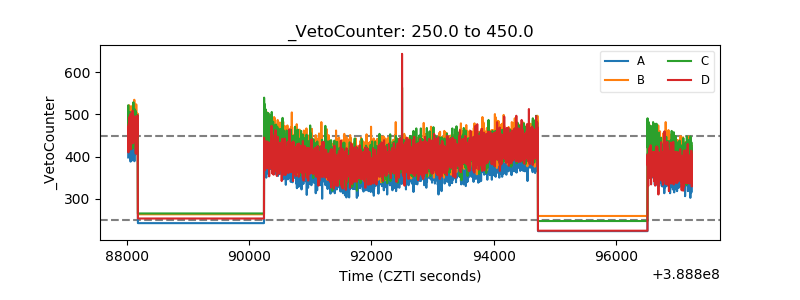 |