| Param | Original file | Final file |
|---|---|---|
| Filename | modeM0/AS1A10_065T04_9000005098_35593cztM0_level2.evt | modeM0/AS1A10_065T04_9000005098_35593cztM0_level2_quad_clean.evt |
| Size (bytes) | 734,915,520 | 62,161,920 |
| Size | 700.9 MB | 59.3 MB |
| Events in quadrant A | 6,705,875 | 353,387 |
| Events in quadrant B | 3,501,090 | 446,010 |
| Events in quadrant C | 3,302,071 | 436,294 |
| Events in quadrant D | 8,397,783 | 280,923 |
| Mode M9 | |||
|---|---|---|---|
| Quadrant | BADHDUFLAG | Total packets | Discarded packets |
| A | 0 | 28 | 0 |
| B | 0 | 28 | 0 |
| C | 0 | 28 | 0 |
| D | 0 | 29 | 0 |
| Mode M0 | |||
|---|---|---|---|
| Quadrant | BADHDUFLAG | Total packets | Discarded packets |
| A | 0 | 23380 | 3 |
| B | 0 | 13722 | 2 |
| C | 0 | 12954 | 2 |
| D | 0 | 28501 | 4 |
| Mode SS | |||
|---|---|---|---|
| Quadrant | BADHDUFLAG | Total packets | Discarded packets |
| A | 0 | 106 | 0 |
| B | 0 | 106 | 0 |
| C | 0 | 106 | 0 |
| D | 0 | 106 | 0 |
| Quadrant | Total seconds | Saturated seconds | Saturation percentage |
|---|---|---|---|
| A | 5192 | 1449 | 27.908320% |
| B | 5192 | 318 | 6.124807% |
| C | 5192 | 230 | 4.429892% |
| D | 5191 | 2144 | 41.302254% |
Noise dominated data is calculated using 1-second bins in cleaned event files. If a bin has >2000 counts, and if more than 50% of those come from <1% of pixels, then it is considered to be noise-dominated and hence unusable.
| Quadrant | # 1 sec bins | Bins with >0 counts | Bins with >2000 counts | High rate bins dominated by noise | Noise dominated (total time) | Noise dominated (detector-on time) | Marked lightcurve |
|---|---|---|---|---|---|---|---|
| A | 7104 | 5193 | 1376 | 1376 | 19.37% | 26.50% | 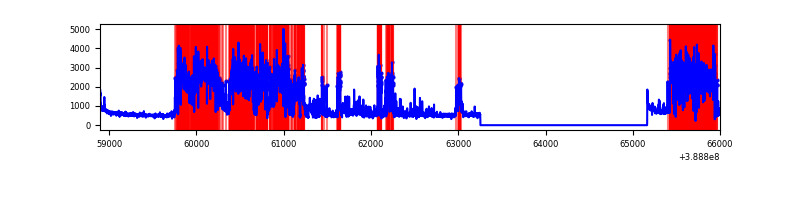 |
| B | 7104 | 5193 | 238 | 238 | 3.35% | 4.58% | 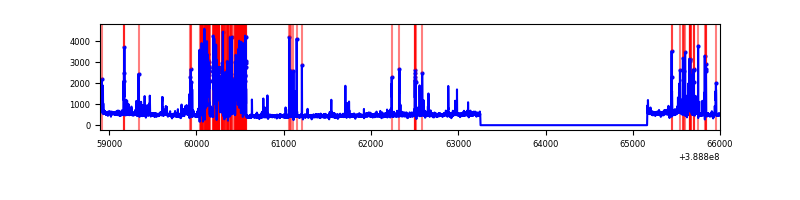 |
| C | 7104 | 5193 | 165 | 165 | 2.32% | 3.18% | 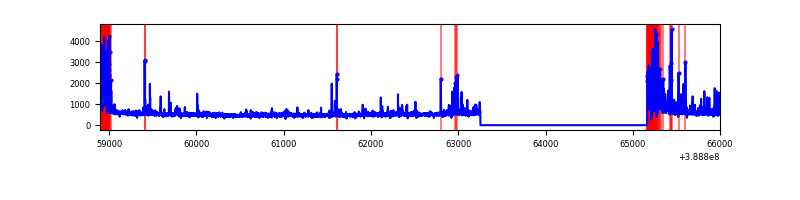 |
| D | 7104 | 5193 | 1926 | 1926 | 27.11% | 37.09% | 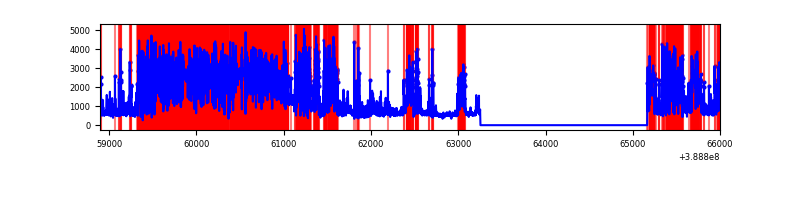 |
Top three noisy pixels from each quadrant. If the there are fewer than three noisy pixels in the level2.evt file, extra rows are filled as -1
| Pixel properties | Quadrant properties | ||||||
|---|---|---|---|---|---|---|---|
| Quadrant | DetID | PixID | Counts | Sigma | Mean | Median | Sigma |
| A | 15 | 169 | 4464562 | 41117.95 | 541 | 531 | 108.6 |
| A | 10 | 83 | 133451 | 1224.31 | 541 | 531 | 108.6 |
| A | 13 | 6 | 12833 | 113.31 | 541 | 531 | 108.6 |
| B | 5 | 172 | 1036471 | 9109.33 | 604 | 589 | 113.7 |
| B | 0 | 182 | 31781 | 274.29 | 604 | 589 | 113.7 |
| B | 4 | 81 | 29195 | 251.55 | 604 | 589 | 113.7 |
| C | 0 | 10 | 659937 | 4816.8 | 591 | 596 | 136.9 |
| C | 15 | 214 | 210359 | 1532.42 | 591 | 596 | 136.9 |
| C | 15 | 159 | 107953 | 784.29 | 591 | 596 | 136.9 |
| D | 7 | 80 | 5424100 | 46345.48 | 476 | 463 | 117.0 |
| D | 13 | 249 | 344367 | 2938.69 | 476 | 463 | 117.0 |
| D | 12 | 6 | 296338 | 2528.28 | 476 | 463 | 117.0 |
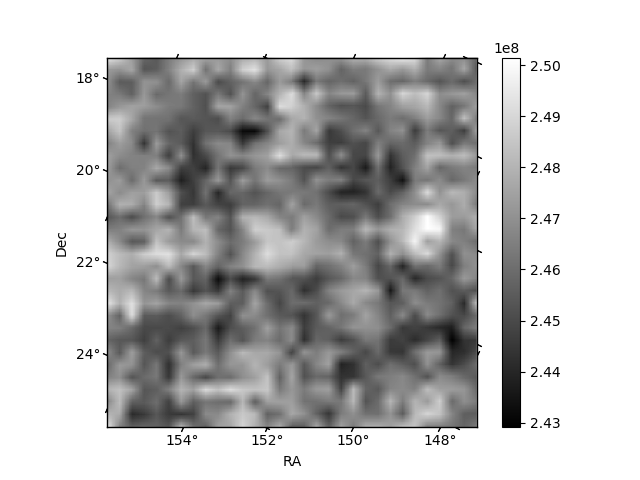
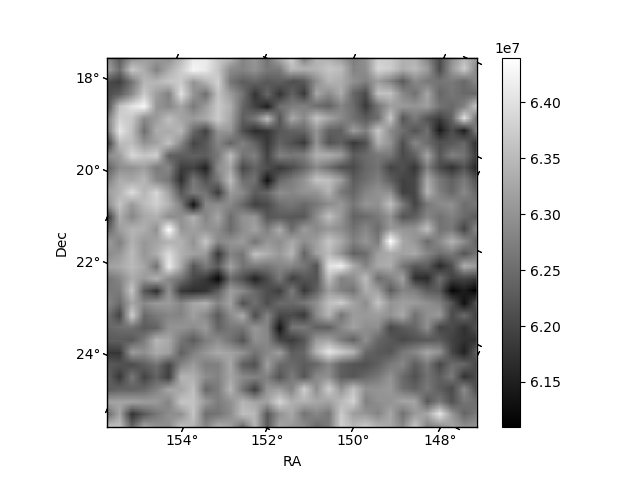
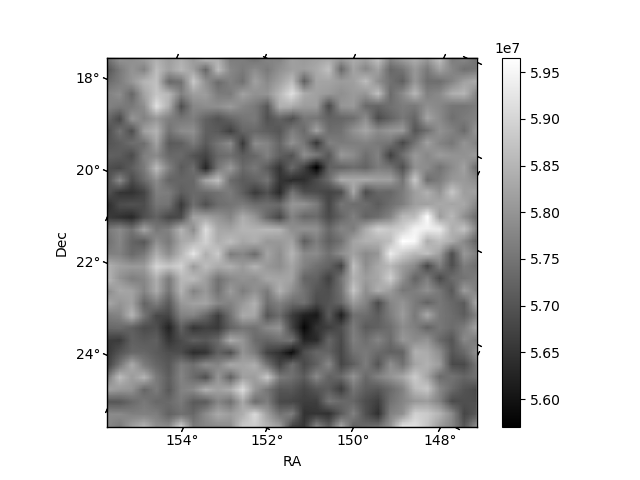
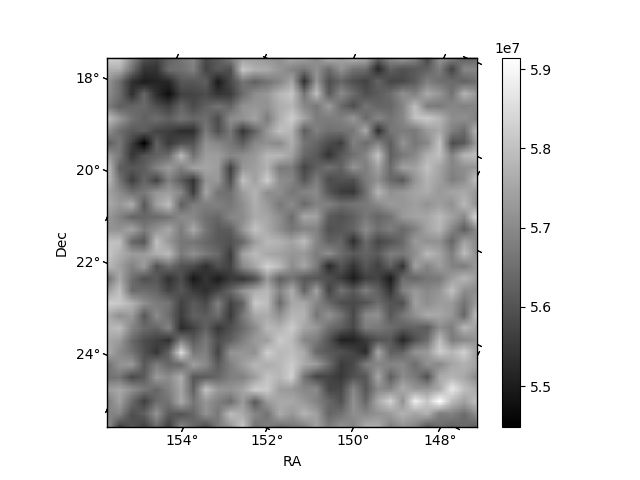
Histogram calculated using DETX and DETY for each event in the final _common_clean file
| Quadrant A | 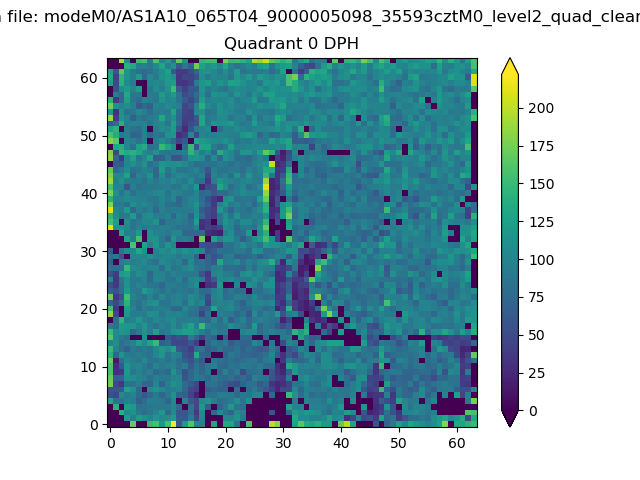 |
 |
Quadrant B |
|---|---|---|---|
| Quadrant D | 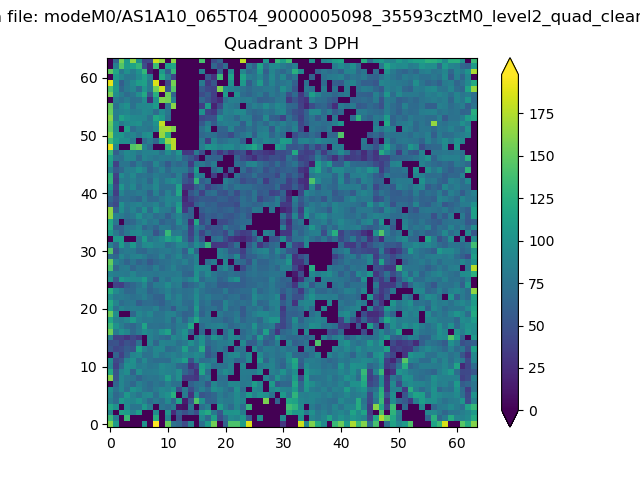 |
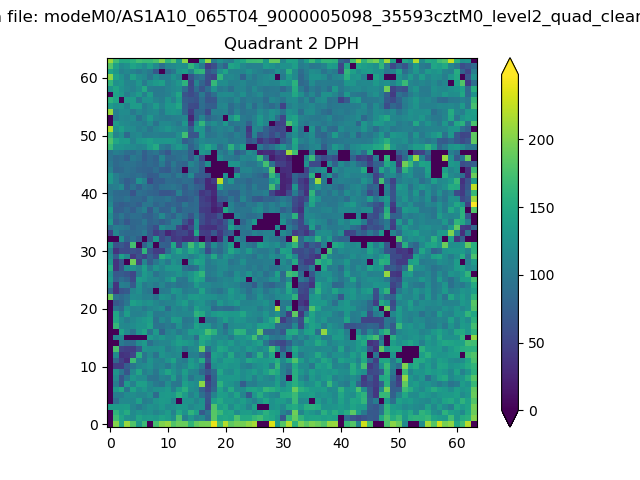 |
Quadrant C |
| Plot type | Count rate plots | Images |
|---|---|---|
| Comparison with Poisson distribution Blue bars denote a histogram of data divided into 1 sec bins. Red curve is a Poisson curve with rate = median count rate of data. |
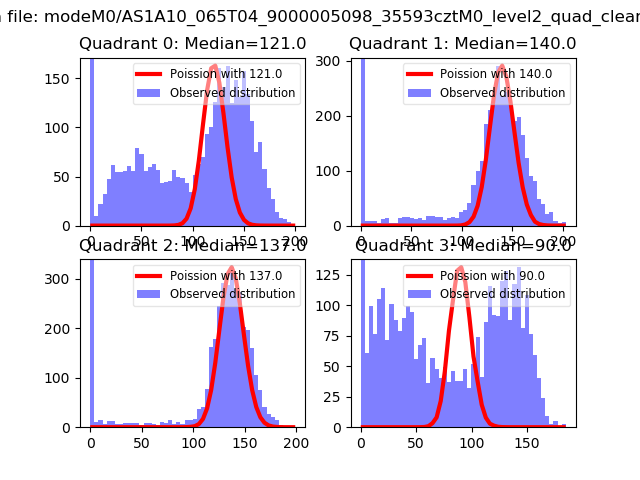 |
 |
| Quadrant-wise count rates Data is divided into 100 sec bins |
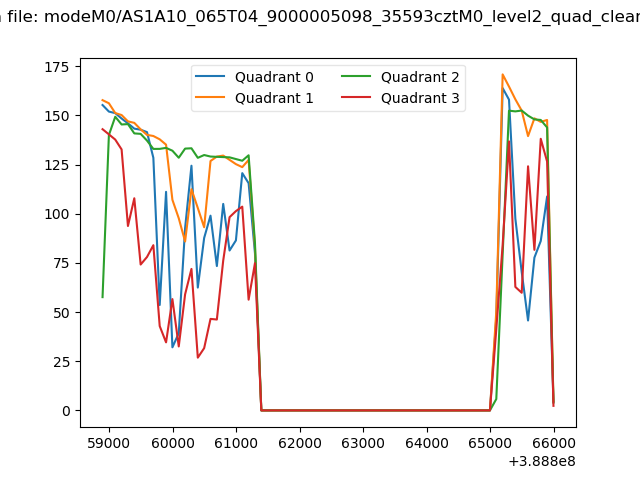 |
|
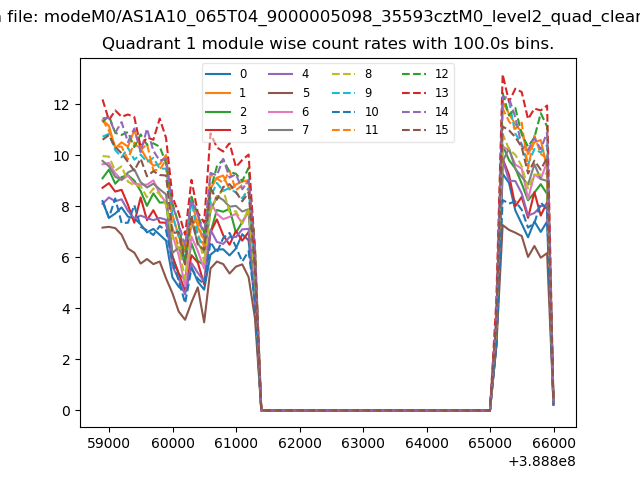
| Module-wise count rates for Quadrant A Data is divided into 100 sec bins |
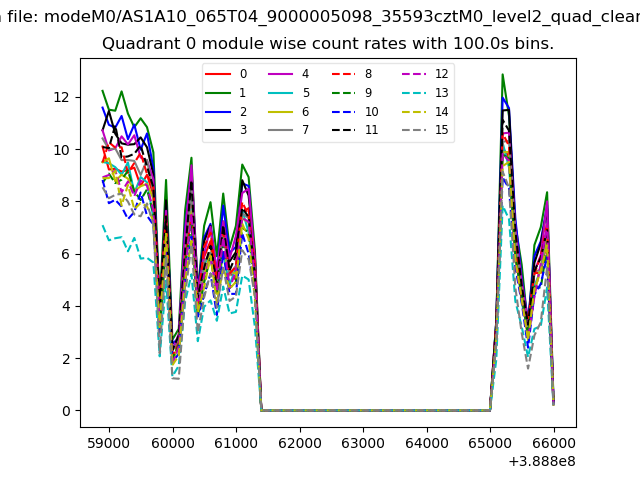 |
 |
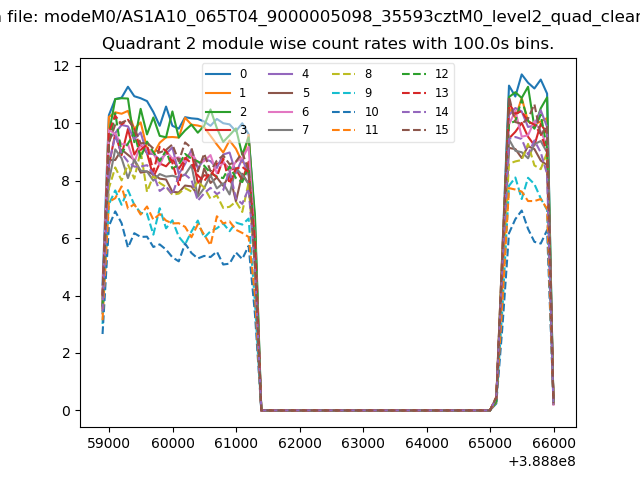
| Module-wise count rates for Quadrant B Data is divided into 100 sec bins |
 |
 |
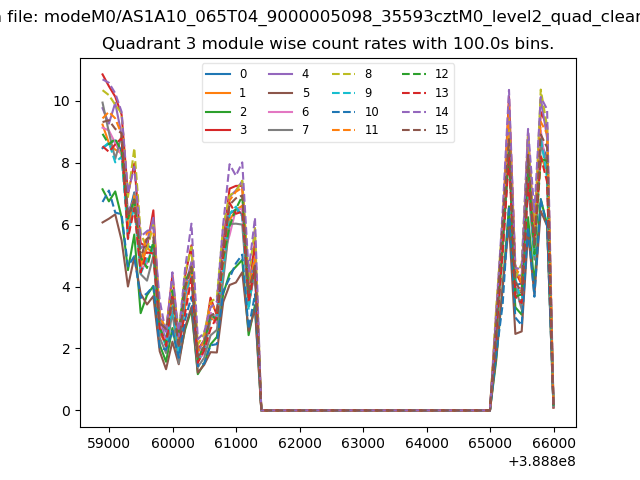
| Module-wise count rates for Quadrant C Data is divided into 100 sec bins |
 |
 |
| Module-wise count rates for Quadrant D Data is divided into 100 sec bins |
 |
 |
| Parameter | Plot |
|---|---|
| CZT HV Monitor | 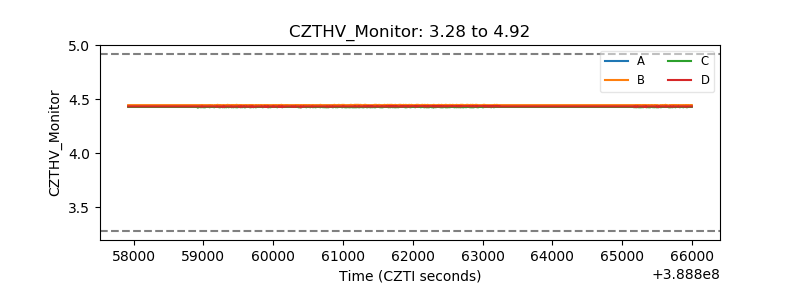 |
| D_VDD | 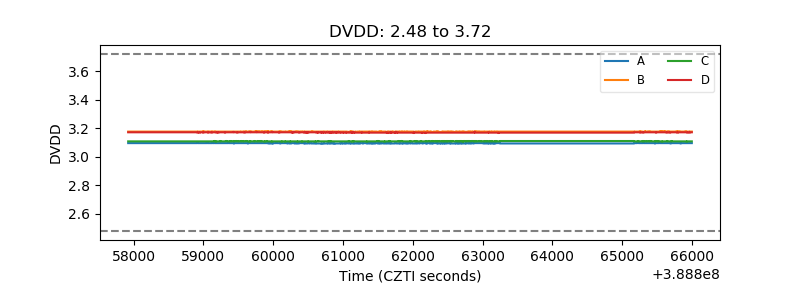 |
| Temperature 1 | 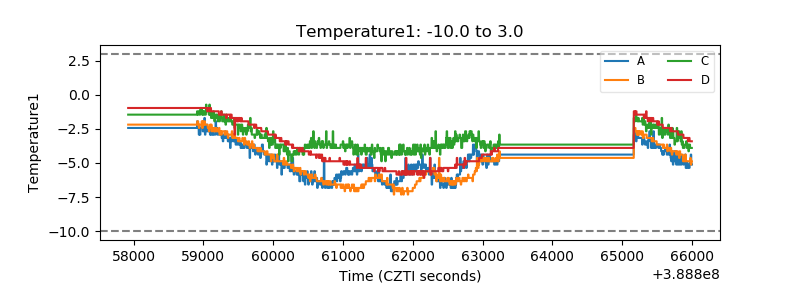 |
| Veto HV Monitor | 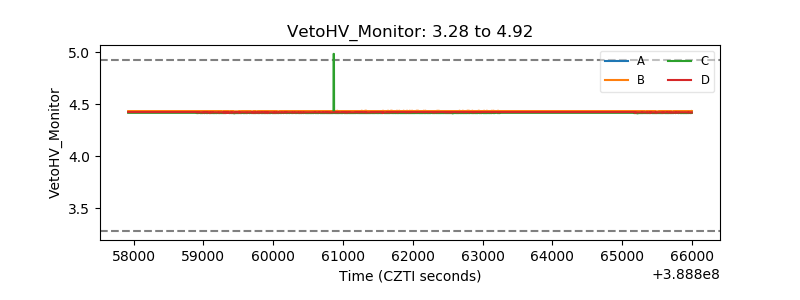 |
| Veto LLD | 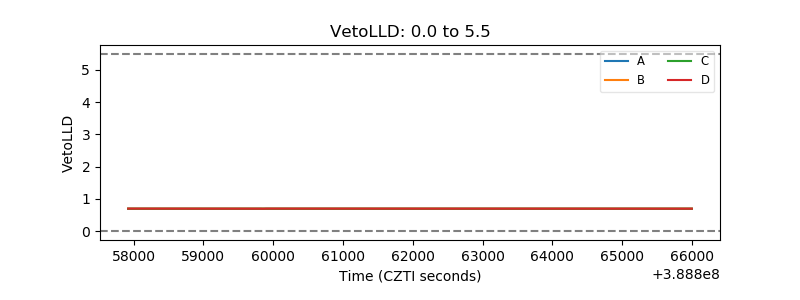 |
| Alpha Counter | 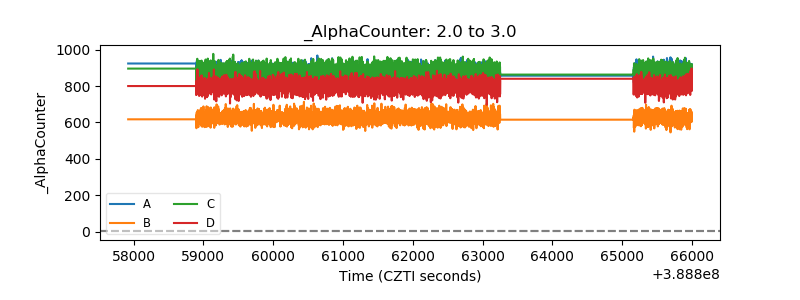 |
| _CPM_Rate | 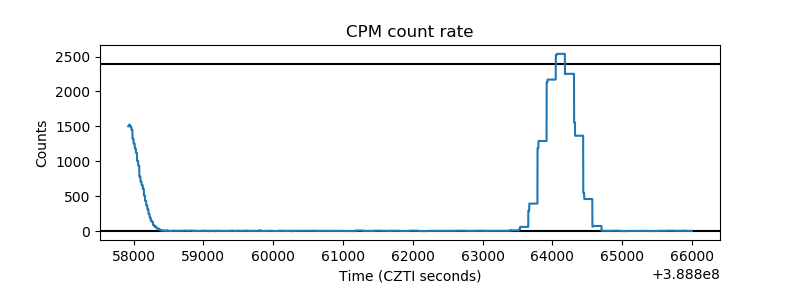 |
| CZT Counter | 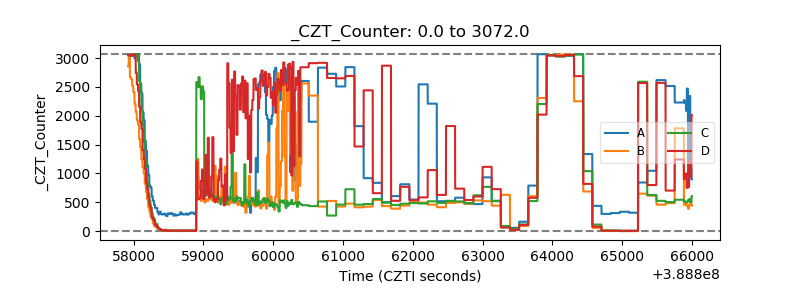 |
| +2.5 Volts monitor | 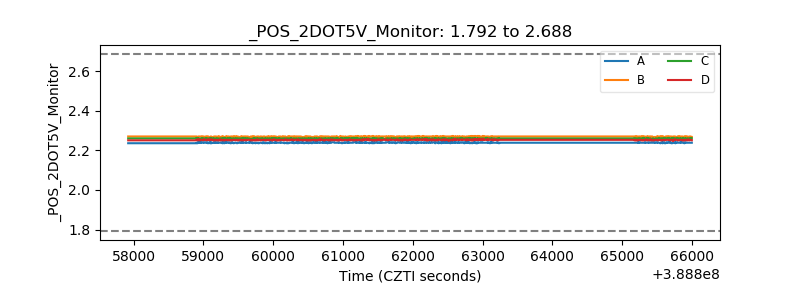 |
| +5 Volts monitor | 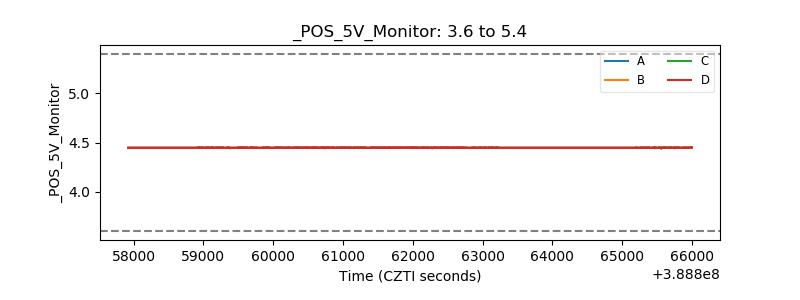 |
| _ROLL_ROT | 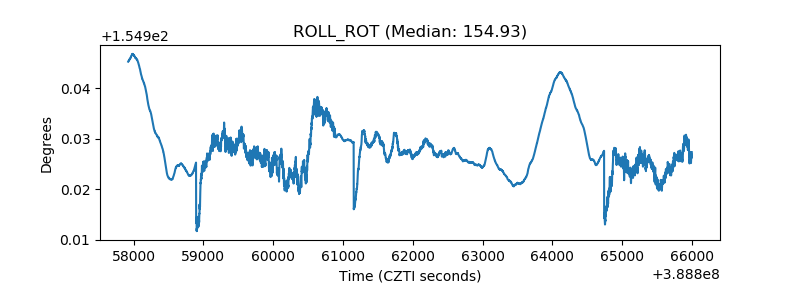 |
| _Roll_DEC | 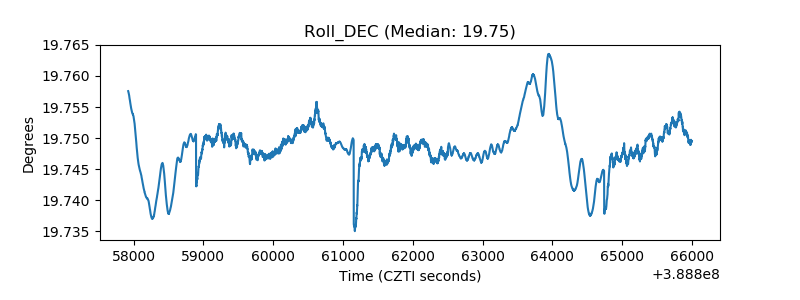 |
| _Roll_RA | 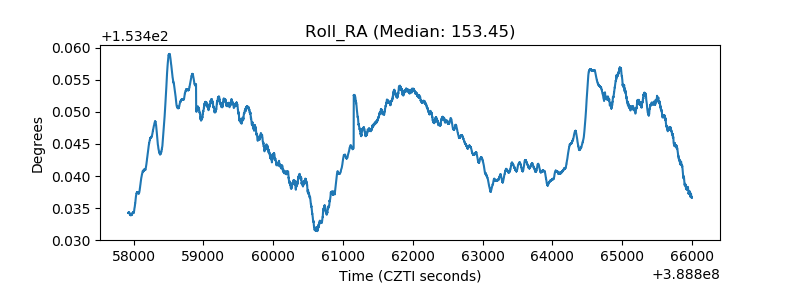 |
| Veto Counter | 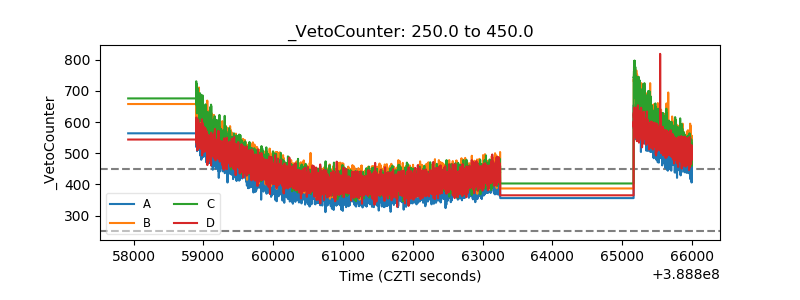 |