| Param | Original file | Final file |
|---|---|---|
| Filename | modeM0/AS1A10_065T04_9000005098_35592cztM0_level2.evt | modeM0/AS1A10_065T04_9000005098_35592cztM0_level2_quad_clean.evt |
| Size (bytes) | 476,190,720 | 75,850,560 |
| Size | 454.1 MB | 72.3 MB |
| Events in quadrant A | 2,734,044 | 500,749 |
| Events in quadrant B | 3,397,873 | 492,061 |
| Events in quadrant C | 3,557,982 | 475,490 |
| Events in quadrant D | 4,365,422 | 450,476 |
| Mode M9 | |||
|---|---|---|---|
| Quadrant | BADHDUFLAG | Total packets | Discarded packets |
| A | 0 | 19 | 0 |
| B | 0 | 19 | 0 |
| C | 0 | 19 | 0 |
| D | 0 | 20 | 0 |
| Mode M0 | |||
|---|---|---|---|
| Quadrant | BADHDUFLAG | Total packets | Discarded packets |
| A | 0 | 11683 | 3 |
| B | 0 | 13660 | 2 |
| C | 0 | 13882 | 2 |
| D | 0 | 16562 | 2 |
| Mode SS | |||
|---|---|---|---|
| Quadrant | BADHDUFLAG | Total packets | Discarded packets |
| A | 0 | 108 | 0 |
| B | 0 | 108 | 0 |
| C | 0 | 108 | 0 |
| D | 0 | 108 | 0 |
| Quadrant | Total seconds | Saturated seconds | Saturation percentage |
|---|---|---|---|
| A | 5403 | 40 | 0.740329% |
| B | 5403 | 254 | 4.701092% |
| C | 5403 | 260 | 4.812141% |
| D | 5403 | 429 | 7.940033% |
Noise dominated data is calculated using 1-second bins in cleaned event files. If a bin has >2000 counts, and if more than 50% of those come from <1% of pixels, then it is considered to be noise-dominated and hence unusable.
| Quadrant | # 1 sec bins | Bins with >0 counts | Bins with >2000 counts | High rate bins dominated by noise | Noise dominated (total time) | Noise dominated (detector-on time) | Marked lightcurve |
|---|---|---|---|---|---|---|---|
| A | 7195 | 5403 | 32 | 32 | 0.44% | 0.59% | 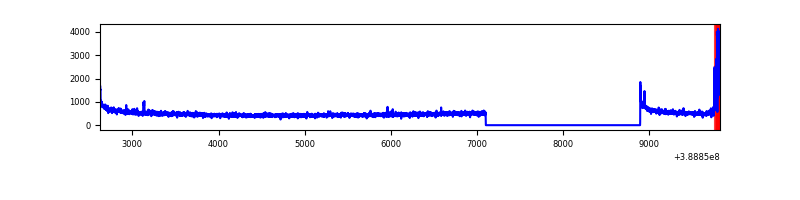 |
| B | 7196 | 5404 | 177 | 177 | 2.46% | 3.28% | 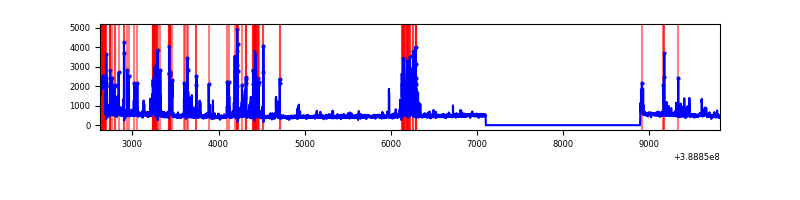 |
| C | 7196 | 5404 | 207 | 207 | 2.88% | 3.83% | 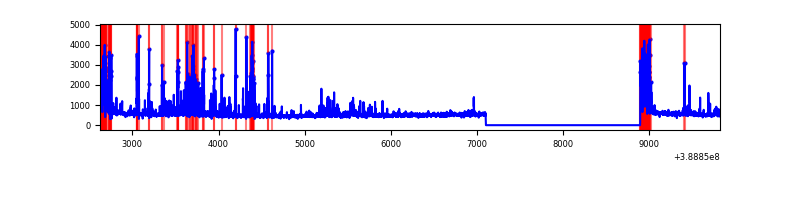 |
| D | 7195 | 5403 | 354 | 354 | 4.92% | 6.55% | 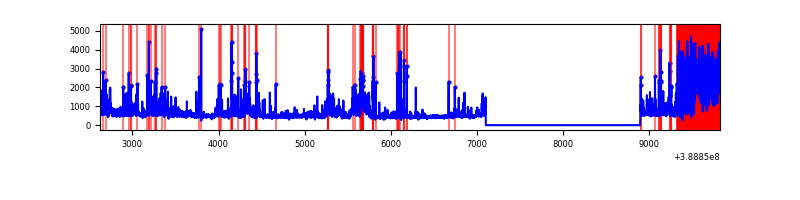 |
Top three noisy pixels from each quadrant. If the there are fewer than three noisy pixels in the level2.evt file, extra rows are filled as -1
| Pixel properties | Quadrant properties | ||||||
|---|---|---|---|---|---|---|---|
| Quadrant | DetID | PixID | Counts | Sigma | Mean | Median | Sigma |
| A | 10 | 83 | 145281 | 1135.31 | 630 | 616 | 127.4 |
| A | 15 | 169 | 132997 | 1038.9 | 630 | 616 | 127.4 |
| A | 13 | 6 | 14124 | 106.01 | 630 | 616 | 127.4 |
| B | 5 | 172 | 674037 | 5708.18 | 613 | 597 | 118.0 |
| B | 4 | 81 | 179227 | 1514.1 | 613 | 597 | 118.0 |
| B | 15 | 85 | 77043 | 647.97 | 613 | 597 | 118.0 |
| C | 0 | 10 | 659146 | 4750.43 | 599 | 606 | 138.6 |
| C | 1 | 23 | 273287 | 1967.01 | 599 | 606 | 138.6 |
| C | 15 | 214 | 217413 | 1563.96 | 599 | 606 | 138.6 |
| D | 7 | 80 | 1472079 | 10103.45 | 598 | 582 | 145.6 |
| D | 1 | 52 | 173991 | 1190.64 | 598 | 582 | 145.6 |
| D | 13 | 249 | 90676 | 618.59 | 598 | 582 | 145.6 |
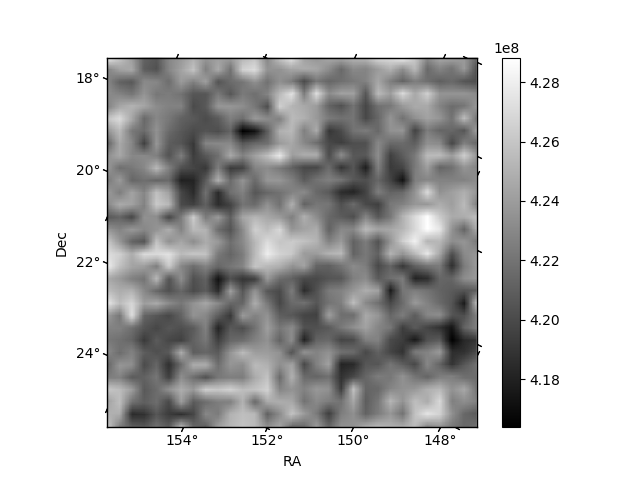
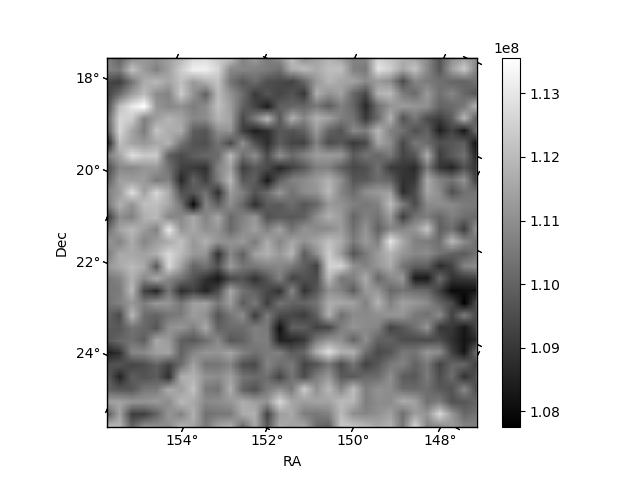
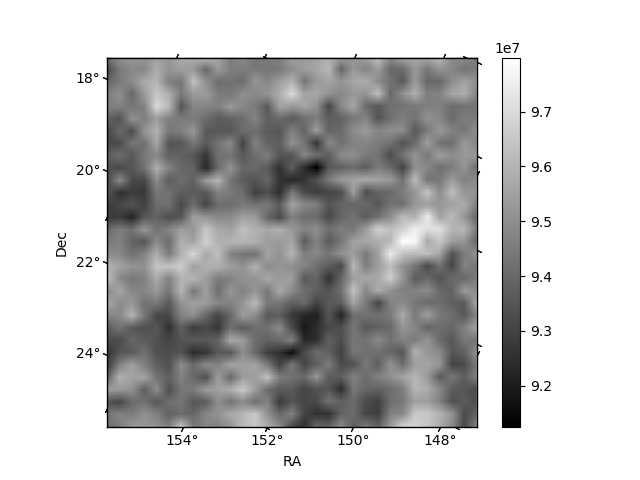
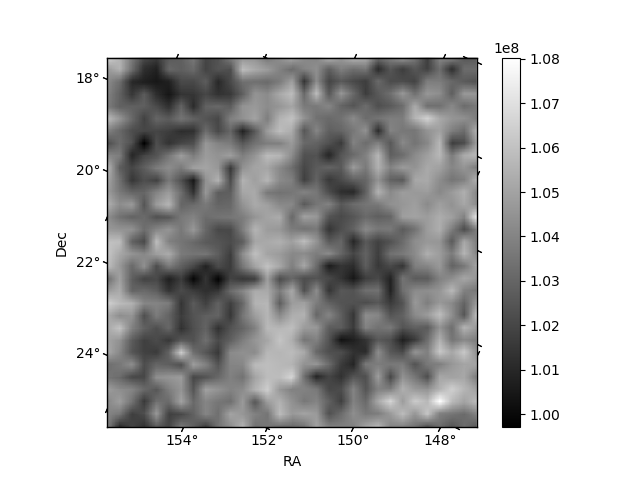
Histogram calculated using DETX and DETY for each event in the final _common_clean file
| Quadrant A | 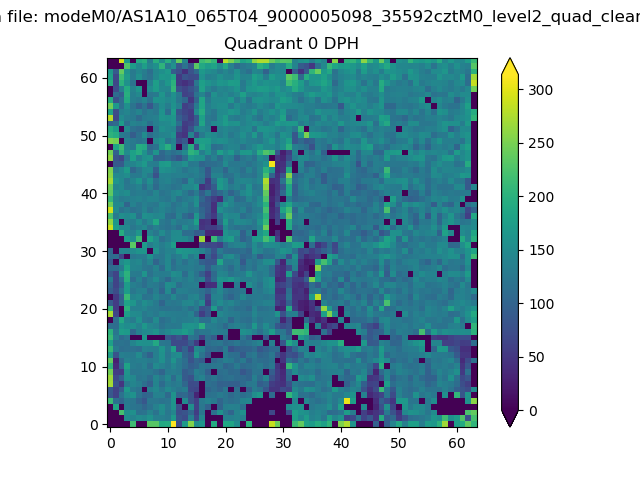 |
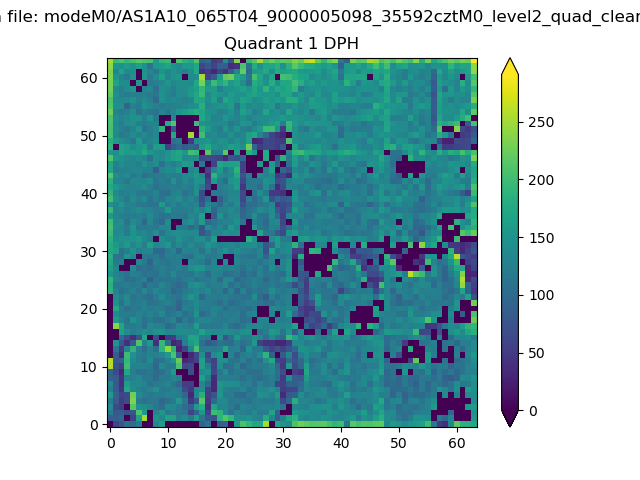 |
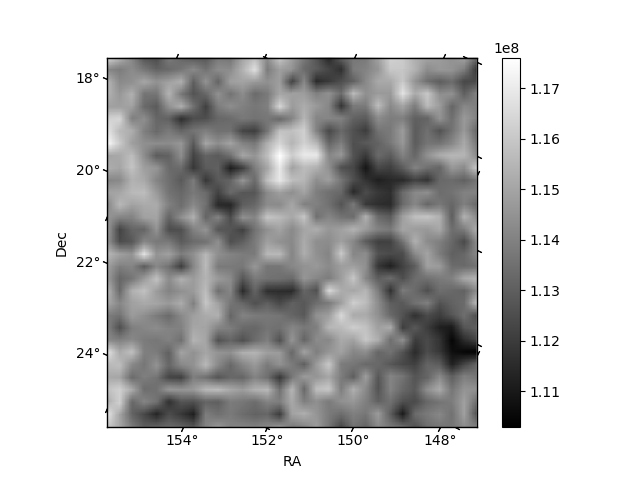
Quadrant B |
|---|---|---|---|
| Quadrant D | 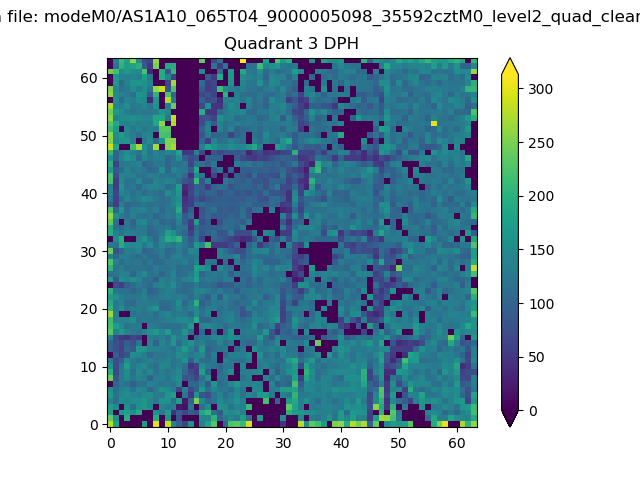 |
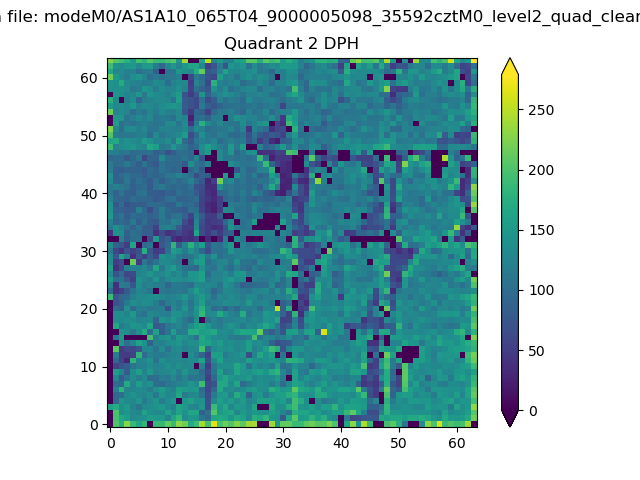 |
Quadrant C |
| Plot type | Count rate plots | Images |
|---|---|---|
| Comparison with Poisson distribution Blue bars denote a histogram of data divided into 1 sec bins. Red curve is a Poisson curve with rate = median count rate of data. |
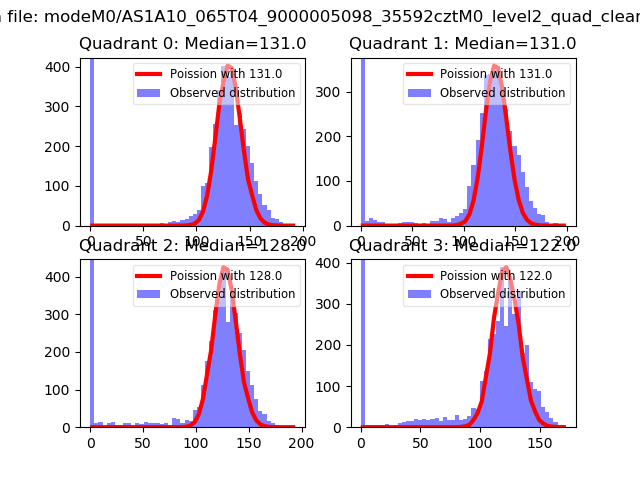 |
 |
| Quadrant-wise count rates Data is divided into 100 sec bins |
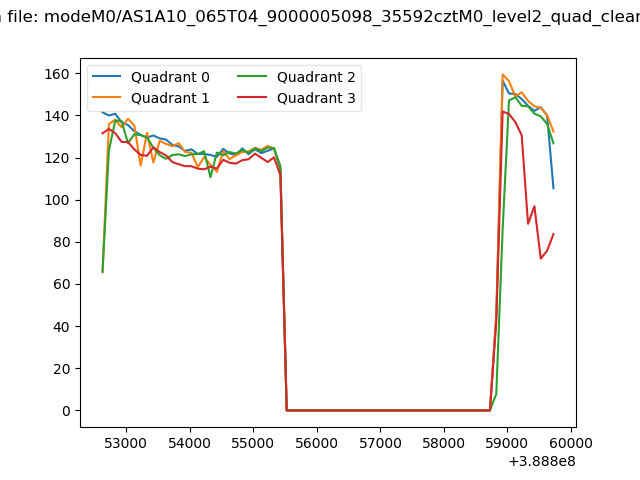 |
|
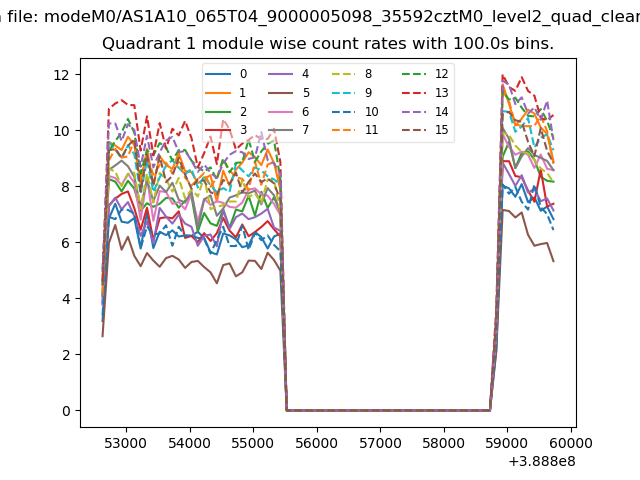
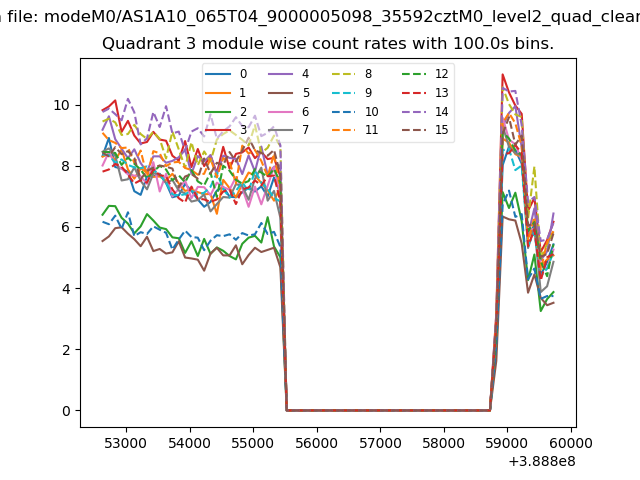
| Module-wise count rates for Quadrant A Data is divided into 100 sec bins |
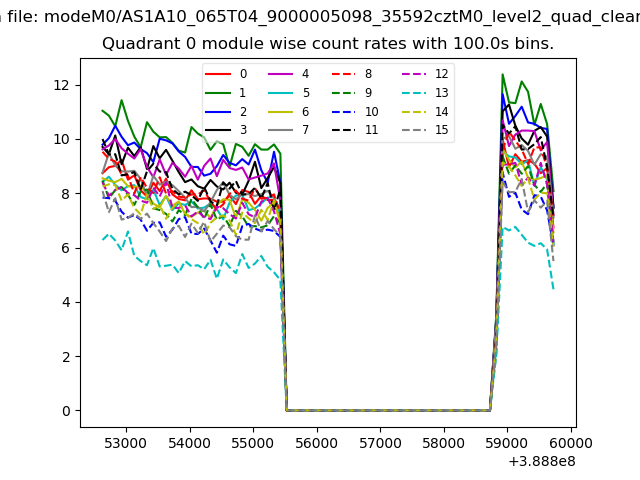 |
 |
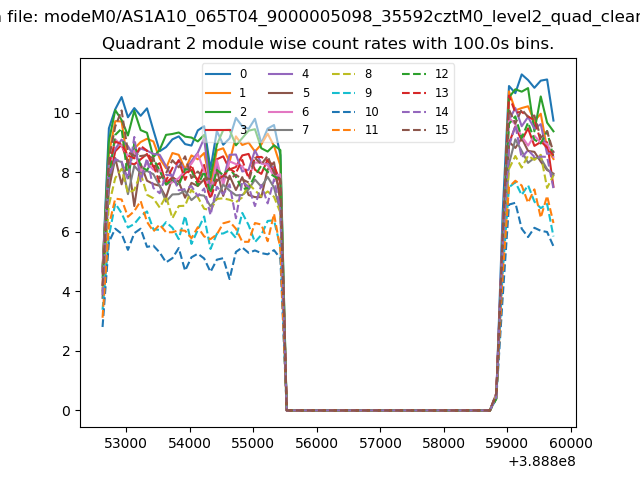
| Module-wise count rates for Quadrant B Data is divided into 100 sec bins |
 |
 |
| Module-wise count rates for Quadrant C Data is divided into 100 sec bins |
 |
 |
| Module-wise count rates for Quadrant D Data is divided into 100 sec bins |
 |
 |
| Parameter | Plot |
|---|---|
| CZT HV Monitor | 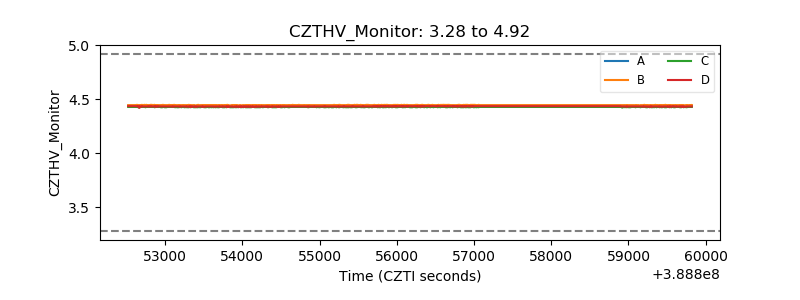 |
| D_VDD | 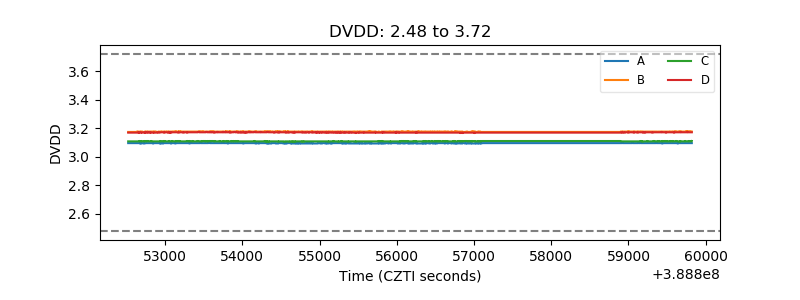 |
| Temperature 1 | 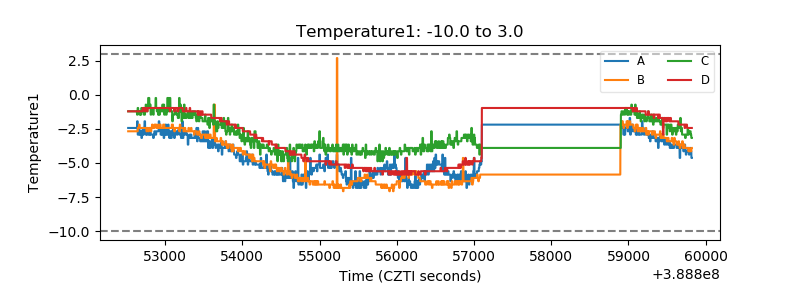 |
| Veto HV Monitor | 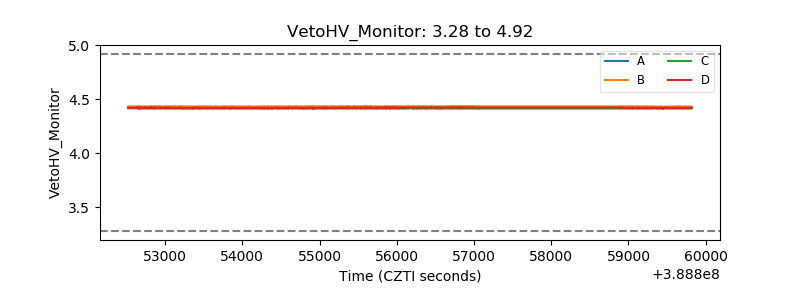 |
| Veto LLD | 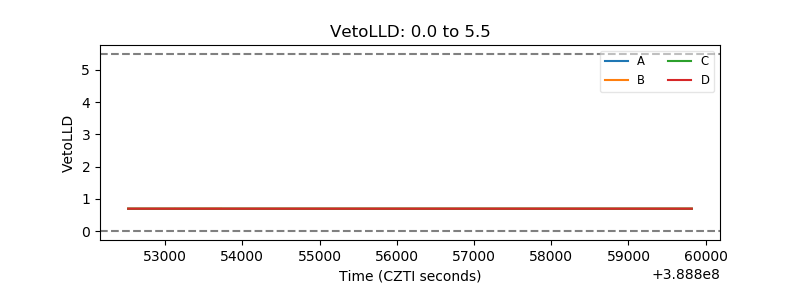 |
| Alpha Counter | 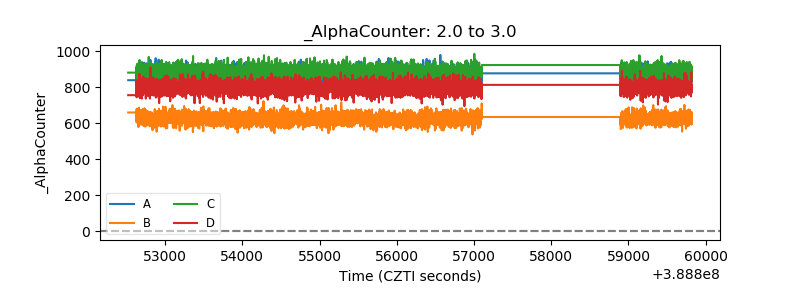 |
| _CPM_Rate | 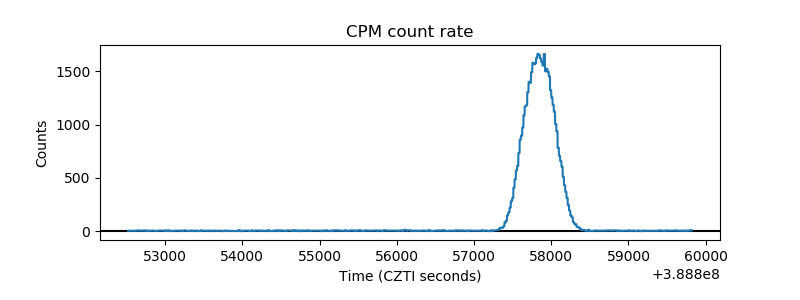 |
| CZT Counter | 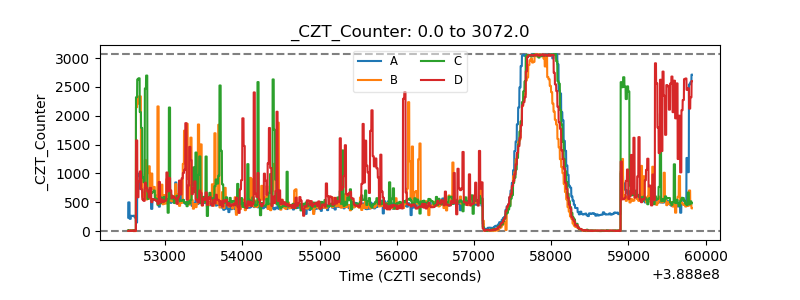 |
| +2.5 Volts monitor | 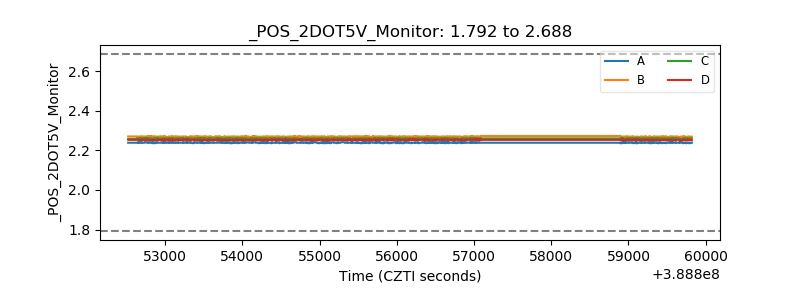 |
| +5 Volts monitor | 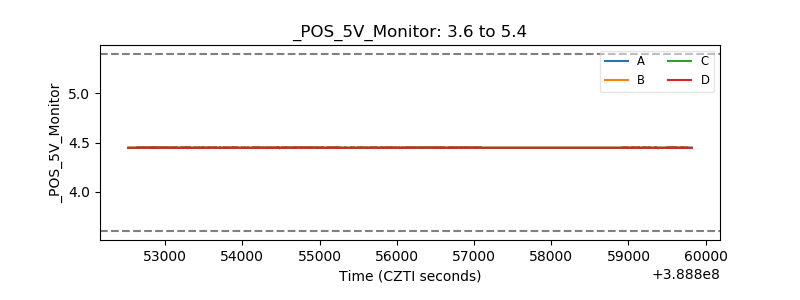 |
| _ROLL_ROT | 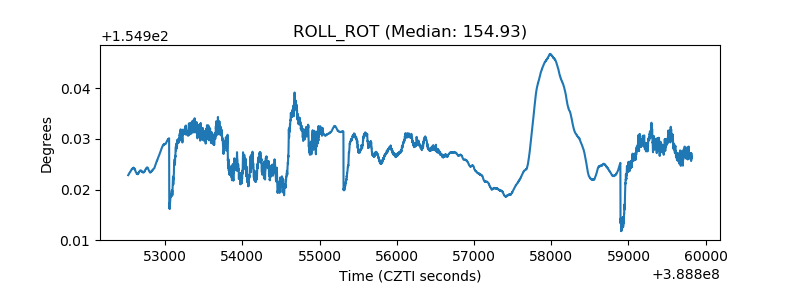 |
| _Roll_DEC | 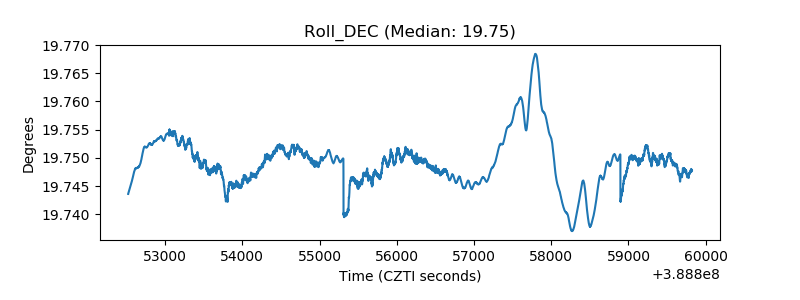 |
| _Roll_RA | 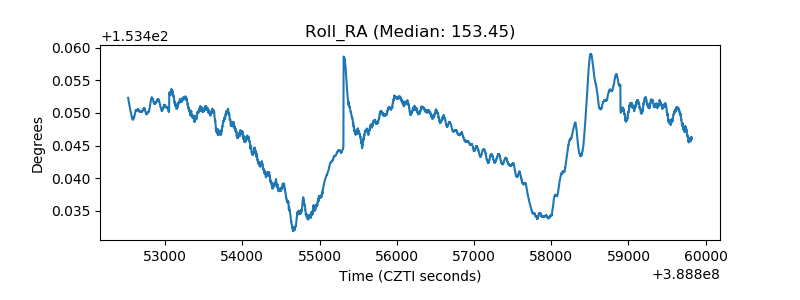 |
| Veto Counter | 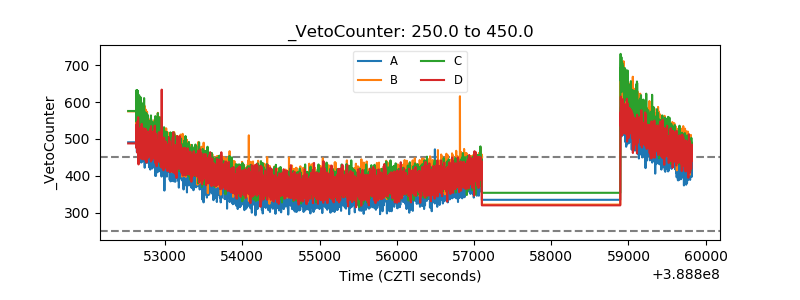 |