| Param | Original file | Final file |
|---|---|---|
| Filename | modeM0/AS1A10_065T04_9000005098_35590cztM0_level2.evt | modeM0/AS1A10_065T04_9000005098_35590cztM0_level2_quad_clean.evt |
| Size (bytes) | 468,423,360 | 79,398,720 |
| Size | 446.7 MB | 75.7 MB |
| Events in quadrant A | 2,664,079 | 524,538 |
| Events in quadrant B | 4,034,581 | 497,136 |
| Events in quadrant C | 3,274,319 | 503,958 |
| Events in quadrant D | 3,840,944 | 494,565 |
| Mode M9 | |||
|---|---|---|---|
| Quadrant | BADHDUFLAG | Total packets | Discarded packets |
| A | 0 | 19 | 0 |
| B | 0 | 19 | 0 |
| C | 0 | 19 | 0 |
| D | 0 | 20 | 0 |
| Mode M0 | |||
|---|---|---|---|
| Quadrant | BADHDUFLAG | Total packets | Discarded packets |
| A | 0 | 11520 | 3 |
| B | 0 | 15587 | 2 |
| C | 0 | 13035 | 2 |
| D | 0 | 15007 | 2 |
| Mode SS | |||
|---|---|---|---|
| Quadrant | BADHDUFLAG | Total packets | Discarded packets |
| A | 0 | 110 | 0 |
| B | 0 | 110 | 0 |
| C | 0 | 110 | 0 |
| D | 0 | 110 | 0 |
| Quadrant | Total seconds | Saturated seconds | Saturation percentage |
|---|---|---|---|
| A | 5491 | 12 | 0.218539% |
| B | 5491 | 436 | 7.940266% |
| C | 5491 | 194 | 3.533054% |
| D | 5491 | 181 | 3.296303% |
Noise dominated data is calculated using 1-second bins in cleaned event files. If a bin has >2000 counts, and if more than 50% of those come from <1% of pixels, then it is considered to be noise-dominated and hence unusable.
| Quadrant | # 1 sec bins | Bins with >0 counts | Bins with >2000 counts | High rate bins dominated by noise | Noise dominated (total time) | Noise dominated (detector-on time) | Marked lightcurve |
|---|---|---|---|---|---|---|---|
| A | 7135 | 5492 | 0 | 0 | 0.00% | 0.00% | 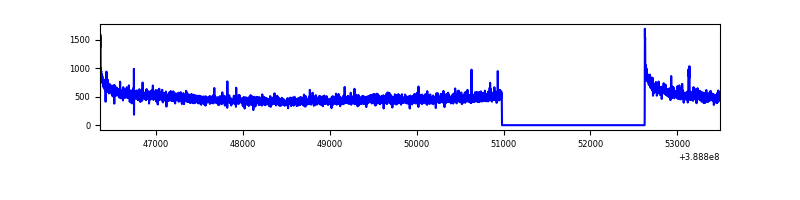 |
| B | 7135 | 5492 | 318 | 318 | 4.46% | 5.79% | 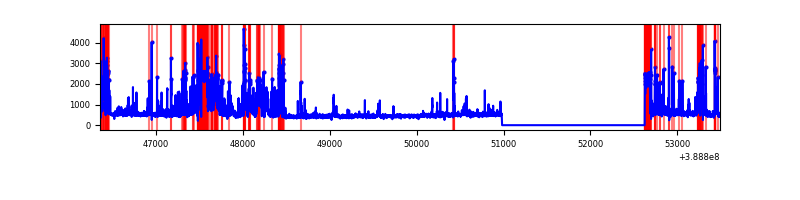 |
| C | 7135 | 5492 | 128 | 128 | 1.79% | 2.33% | 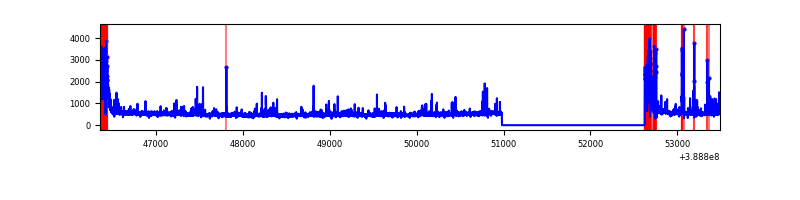 |
| D | 7135 | 5492 | 158 | 158 | 2.21% | 2.88% | 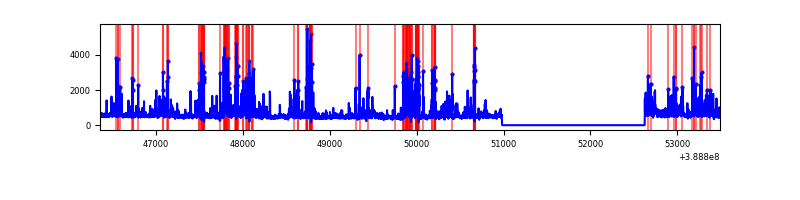 |
Top three noisy pixels from each quadrant. If the there are fewer than three noisy pixels in the level2.evt file, extra rows are filled as -1
| Pixel properties | Quadrant properties | ||||||
|---|---|---|---|---|---|---|---|
| Quadrant | DetID | PixID | Counts | Sigma | Mean | Median | Sigma |
| A | 10 | 83 | 143172 | 1094.26 | 638 | 625 | 130.3 |
| A | 15 | 169 | 27032 | 202.71 | 638 | 625 | 130.3 |
| A | 13 | 6 | 19641 | 145.98 | 638 | 625 | 130.3 |
| B | 5 | 172 | 1265447 | 10911.0 | 605 | 590 | 115.9 |
| B | 4 | 81 | 148202 | 1273.34 | 605 | 590 | 115.9 |
| B | 4 | 232 | 86477 | 740.88 | 605 | 590 | 115.9 |
| C | 0 | 10 | 588969 | 4140.81 | 607 | 613 | 142.1 |
| C | 15 | 214 | 224105 | 1572.92 | 607 | 613 | 142.1 |
| C | 1 | 23 | 75748 | 528.8 | 607 | 613 | 142.1 |
| D | 7 | 80 | 859472 | 5645.02 | 617 | 600 | 152.1 |
| D | 10 | 118 | 106375 | 695.22 | 617 | 600 | 152.1 |
| D | 2 | 153 | 97848 | 639.17 | 617 | 600 | 152.1 |
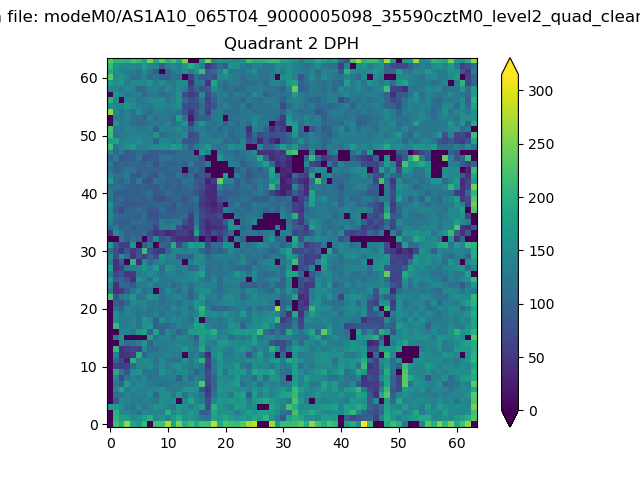
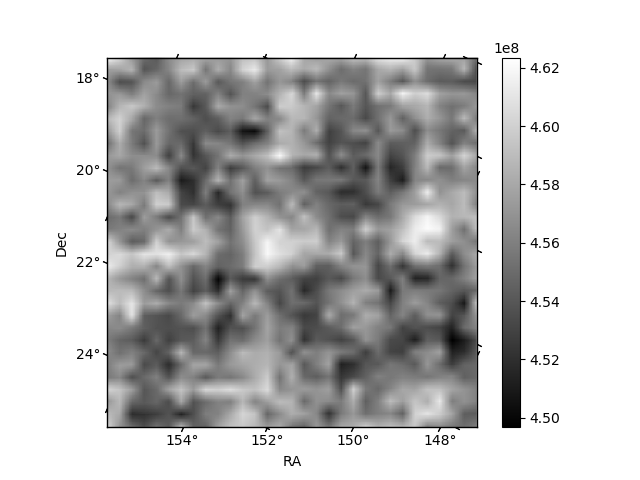
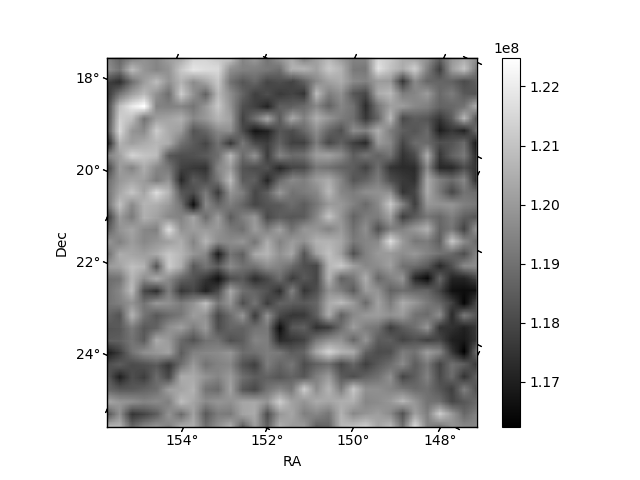
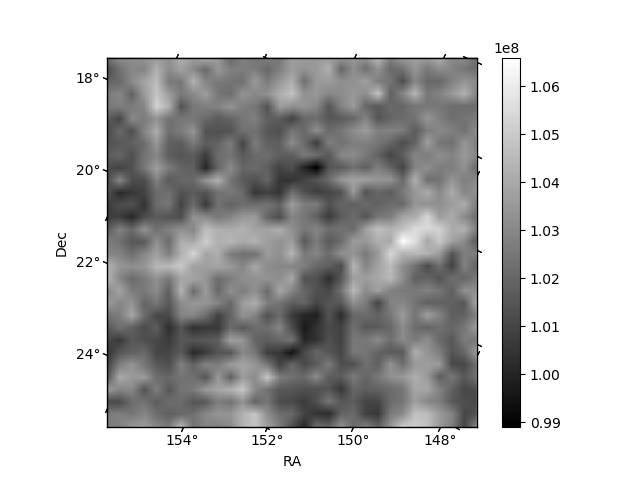
Histogram calculated using DETX and DETY for each event in the final _common_clean file
| Quadrant A | 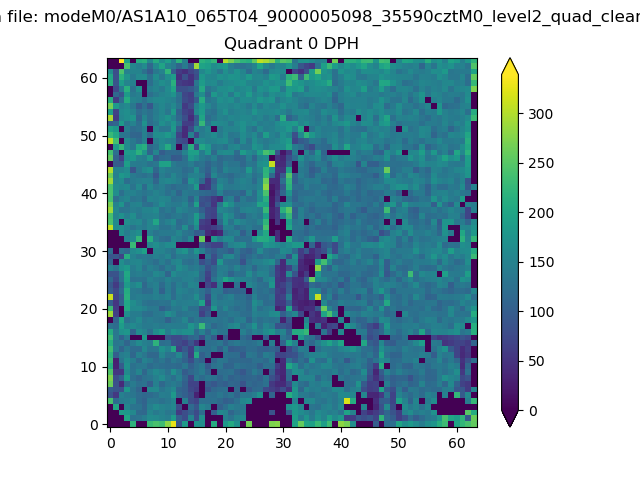 |
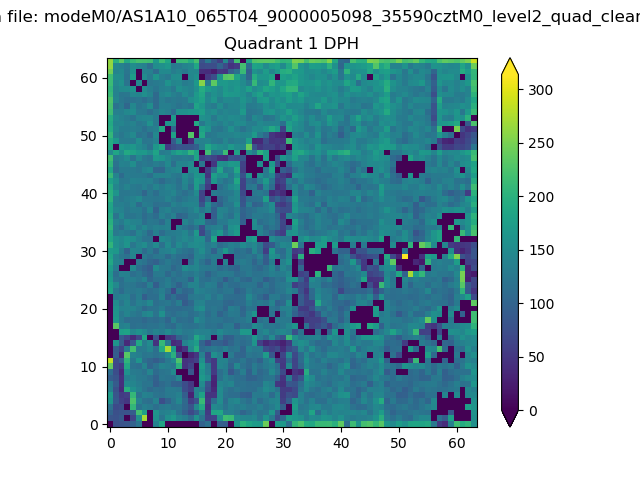 |
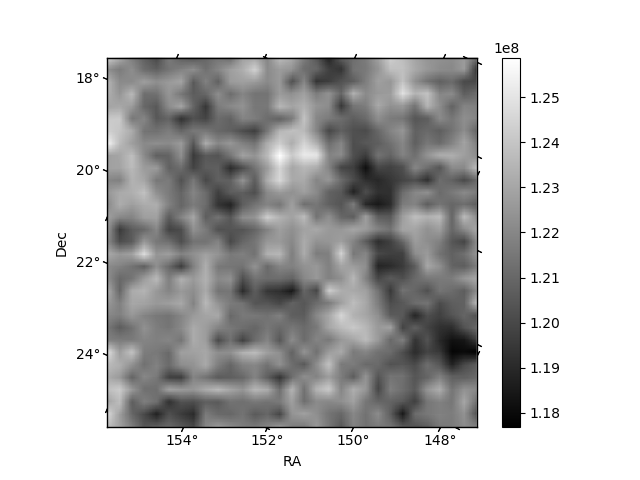
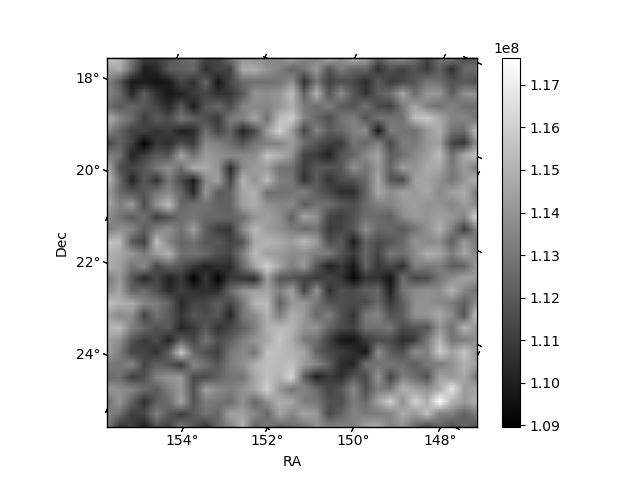
Quadrant B |
|---|---|---|---|
| Quadrant D | 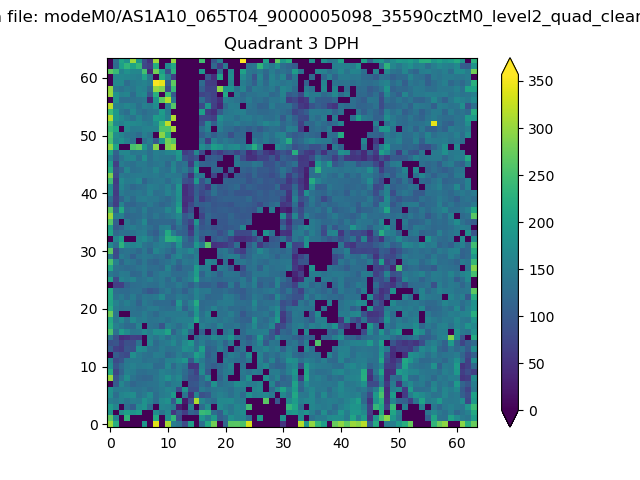 |
 |
Quadrant C |
| Plot type | Count rate plots | Images |
|---|---|---|
| Comparison with Poisson distribution Blue bars denote a histogram of data divided into 1 sec bins. Red curve is a Poisson curve with rate = median count rate of data. |
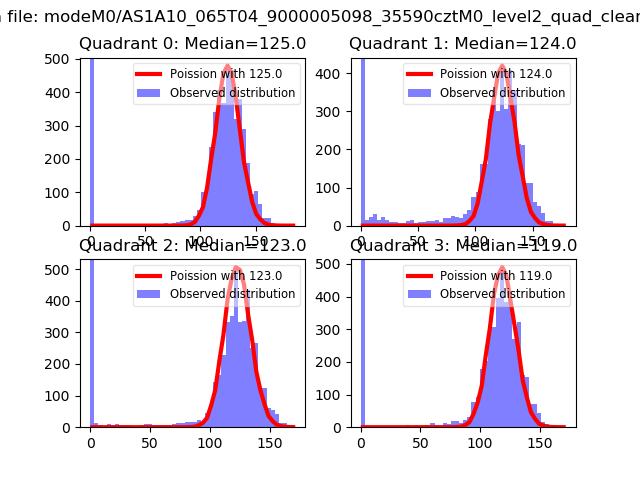 |
 |
| Quadrant-wise count rates Data is divided into 100 sec bins |
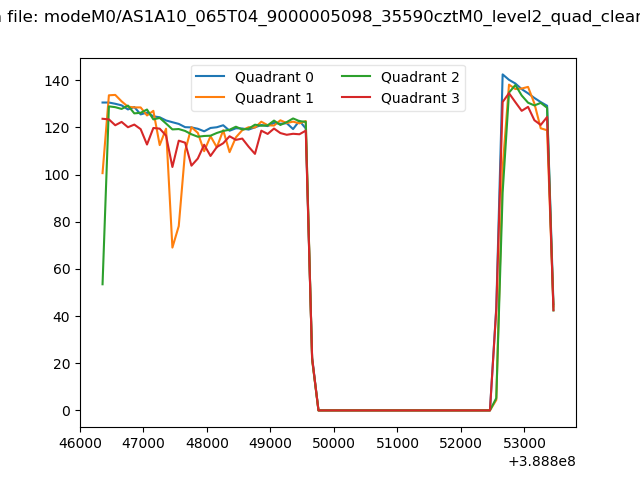 |
|
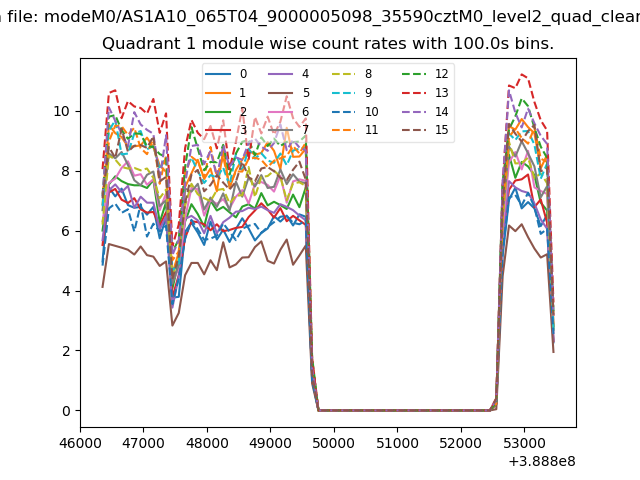
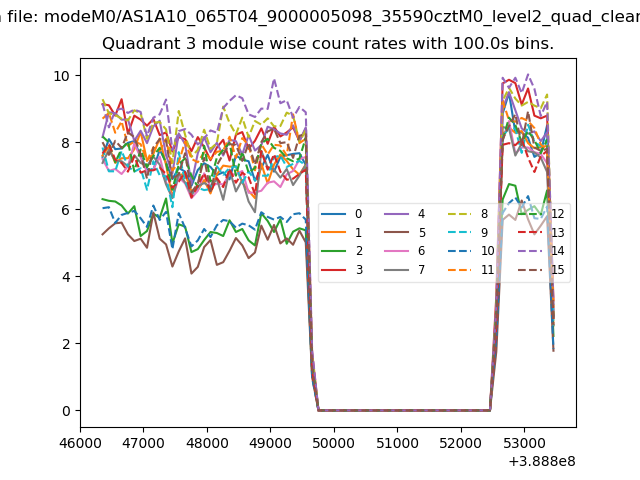
| Module-wise count rates for Quadrant A Data is divided into 100 sec bins |
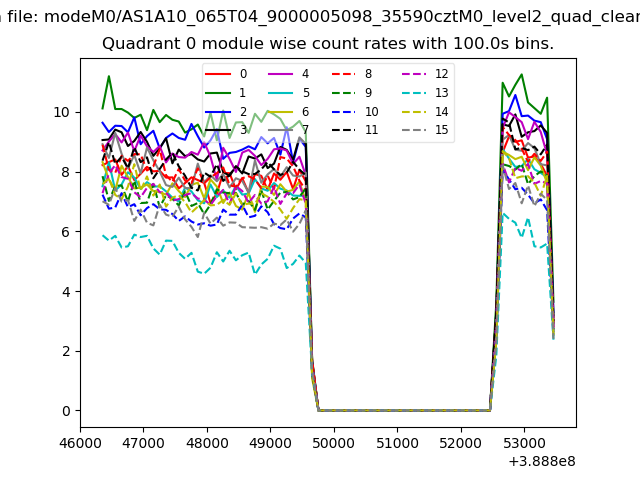 |
 |
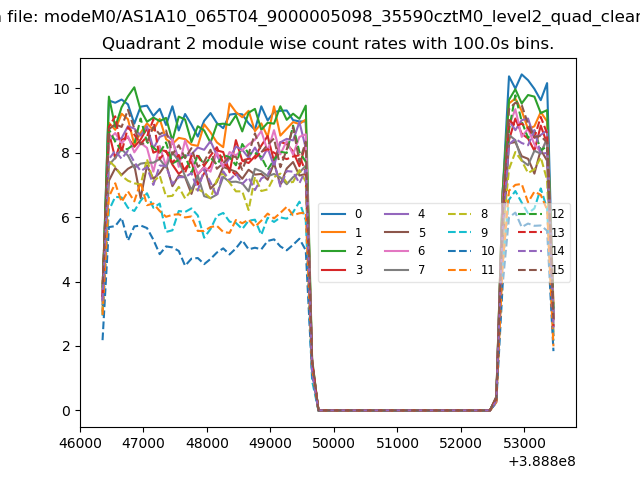
| Module-wise count rates for Quadrant B Data is divided into 100 sec bins |
 |
 |
| Module-wise count rates for Quadrant C Data is divided into 100 sec bins |
 |
 |
| Module-wise count rates for Quadrant D Data is divided into 100 sec bins |
 |
 |
| Parameter | Plot |
|---|---|
| CZT HV Monitor | 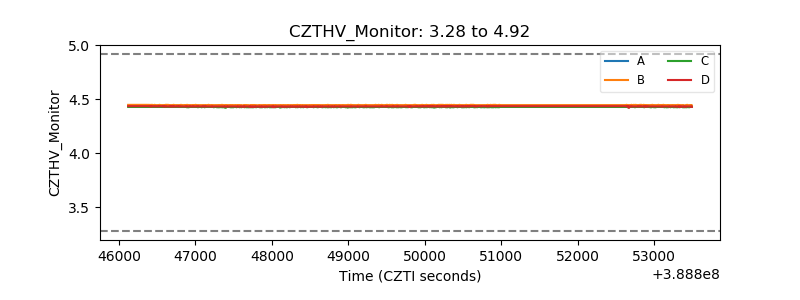 |
| D_VDD | 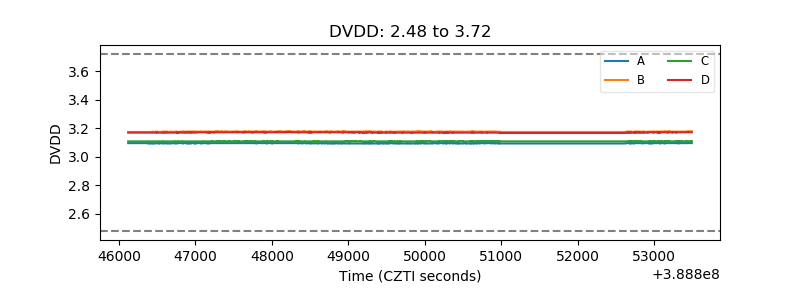 |
| Temperature 1 | 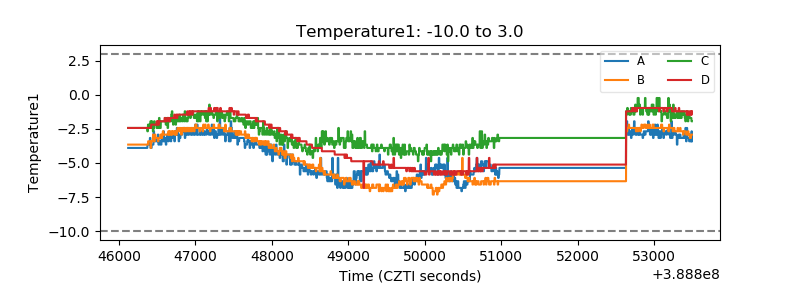 |
| Veto HV Monitor |  |
| Veto LLD | 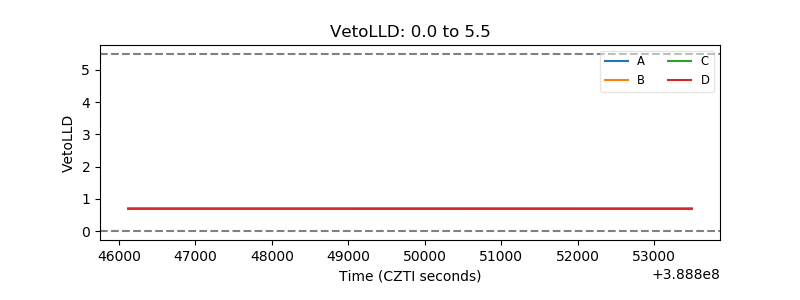 |
| Alpha Counter | 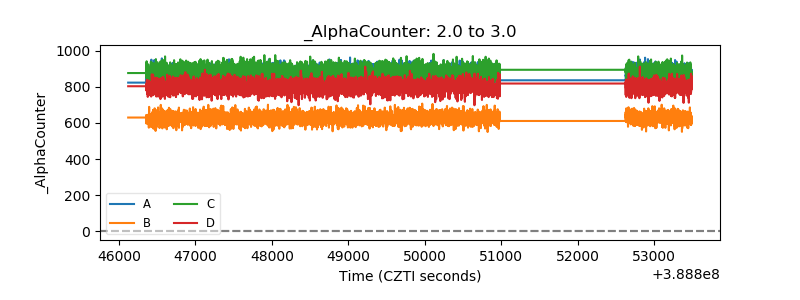 |
| _CPM_Rate | 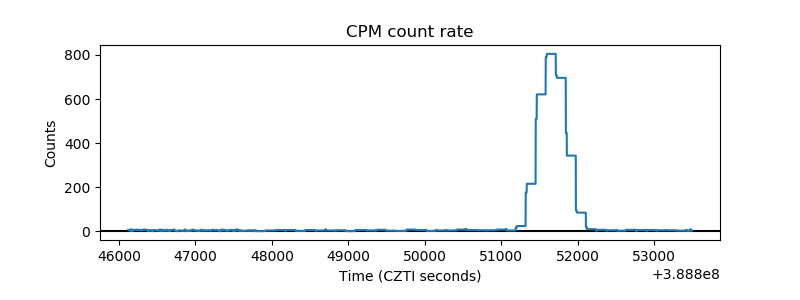 |
| CZT Counter | 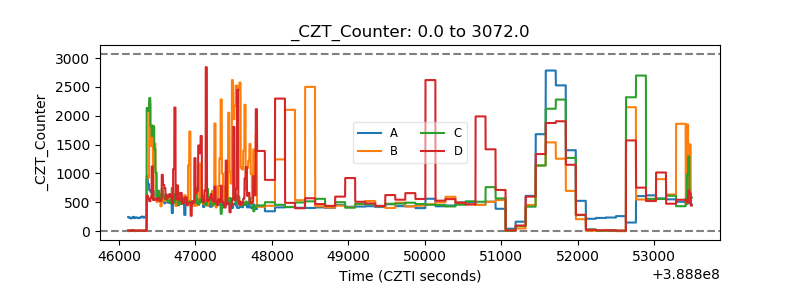 |
| +2.5 Volts monitor | 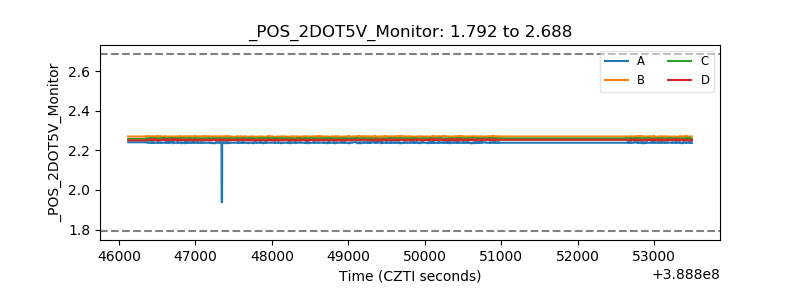 |
| +5 Volts monitor | 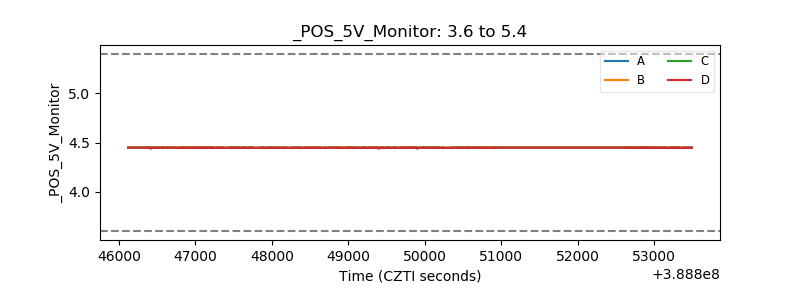 |
| _ROLL_ROT | 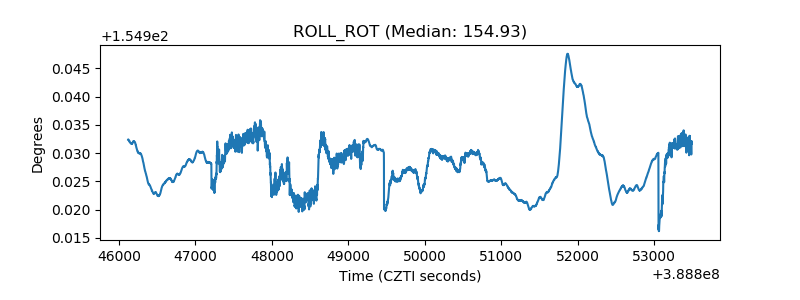 |
| _Roll_DEC | 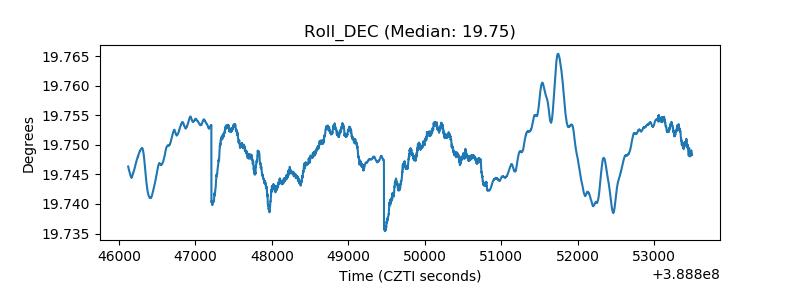 |
| _Roll_RA | 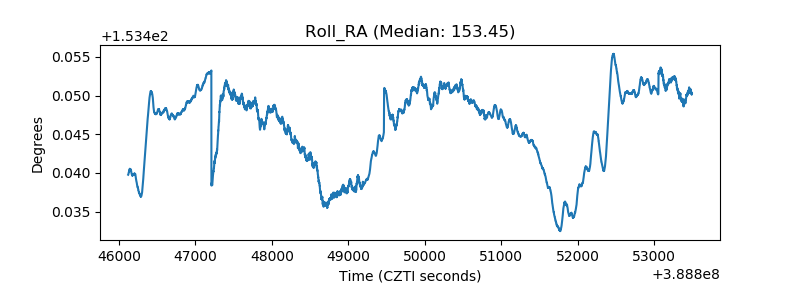 |
| Veto Counter | 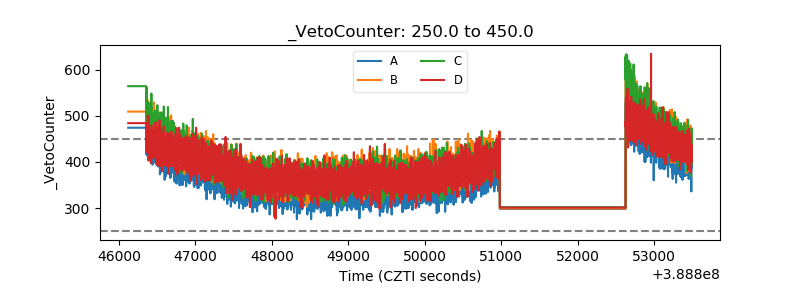 |