| Param | Original file | Final file |
|---|---|---|
| Filename | modeM0/AS1A10_065T04_9000005098_35588cztM0_level2.evt | modeM0/AS1A10_065T04_9000005098_35588cztM0_level2_quad_clean.evt |
| Size (bytes) | 332,573,760 | 61,064,640 |
| Size | 317.2 MB | 58.2 MB |
| Events in quadrant A | 1,916,910 | 410,036 |
| Events in quadrant B | 3,175,111 | 373,864 |
| Events in quadrant C | 2,198,427 | 404,225 |
| Events in quadrant D | 2,512,850 | 382,753 |
| Mode M9 | |||
|---|---|---|---|
| Quadrant | BADHDUFLAG | Total packets | Discarded packets |
| A | 0 | 10 | 0 |
| B | 0 | 10 | 0 |
| C | 0 | 10 | 0 |
| D | 0 | 10 | 0 |
| Mode M0 | |||
|---|---|---|---|
| Quadrant | BADHDUFLAG | Total packets | Discarded packets |
| A | 0 | 8057 | 2 |
| B | 0 | 12008 | 1 |
| C | 0 | 8833 | 1 |
| D | 0 | 10001 | 1 |
| Mode SS | |||
|---|---|---|---|
| Quadrant | BADHDUFLAG | Total packets | Discarded packets |
| A | 0 | 80 | 0 |
| B | 0 | 80 | 0 |
| C | 0 | 80 | 0 |
| D | 0 | 80 | 0 |
| Quadrant | Total seconds | Saturated seconds | Saturation percentage |
|---|---|---|---|
| A | 3933 | 7 | 0.177981% |
| B | 3933 | 534 | 13.577422% |
| C | 3933 | 73 | 1.856089% |
| D | 3933 | 146 | 3.712179% |
Noise dominated data is calculated using 1-second bins in cleaned event files. If a bin has >2000 counts, and if more than 50% of those come from <1% of pixels, then it is considered to be noise-dominated and hence unusable.
| Quadrant | # 1 sec bins | Bins with >0 counts | Bins with >2000 counts | High rate bins dominated by noise | Noise dominated (total time) | Noise dominated (detector-on time) | Marked lightcurve |
|---|---|---|---|---|---|---|---|
| A | 3933 | 3933 | 0 | 0 | 0.00% | 0.00% | 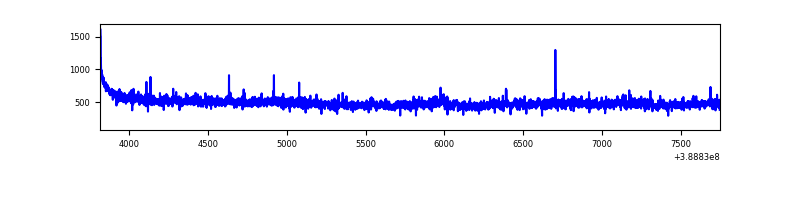 |
| B | 3933 | 3933 | 440 | 440 | 11.19% | 11.19% |  |
| C | 3933 | 3933 | 44 | 44 | 1.12% | 1.12% | 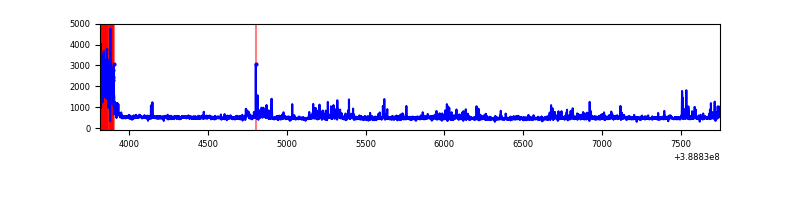 |
| D | 3933 | 3933 | 128 | 128 | 3.25% | 3.25% | 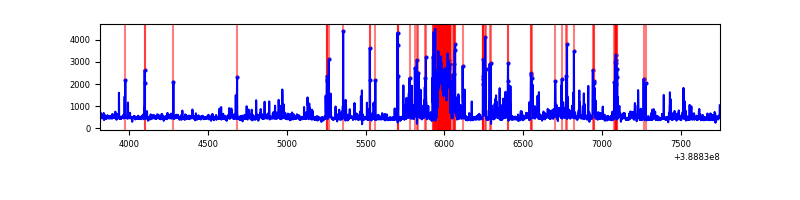 |
Top three noisy pixels from each quadrant. If the there are fewer than three noisy pixels in the level2.evt file, extra rows are filled as -1
| Pixel properties | Quadrant properties | ||||||
|---|---|---|---|---|---|---|---|
| Quadrant | DetID | PixID | Counts | Sigma | Mean | Median | Sigma |
| A | 10 | 83 | 88196 | 963.25 | 447 | 437 | 91.1 |
| A | 15 | 169 | 84741 | 925.32 | 447 | 437 | 91.1 |
| A | 13 | 6 | 8328 | 86.61 | 447 | 437 | 91.1 |
| B | 5 | 172 | 1345082 | 16450.77 | 411 | 400 | 81.7 |
| B | 4 | 81 | 139461 | 1701.27 | 411 | 400 | 81.7 |
| B | 15 | 85 | 42034 | 509.35 | 411 | 400 | 81.7 |
| C | 0 | 10 | 342045 | 3344.34 | 432 | 434 | 102.1 |
| C | 15 | 214 | 161607 | 1577.87 | 432 | 434 | 102.1 |
| C | 14 | 67 | 4435 | 39.17 | 432 | 434 | 102.1 |
| D | 7 | 80 | 207438 | 1905.48 | 432 | 418 | 108.6 |
| D | 10 | 118 | 172745 | 1586.15 | 432 | 418 | 108.6 |
| D | 10 | 234 | 143600 | 1317.89 | 432 | 418 | 108.6 |
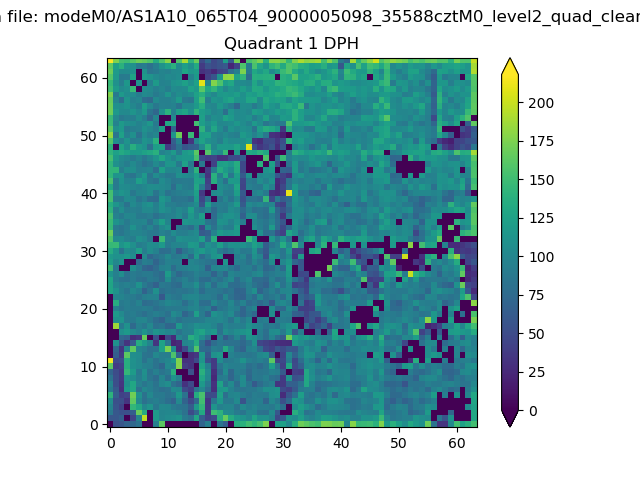
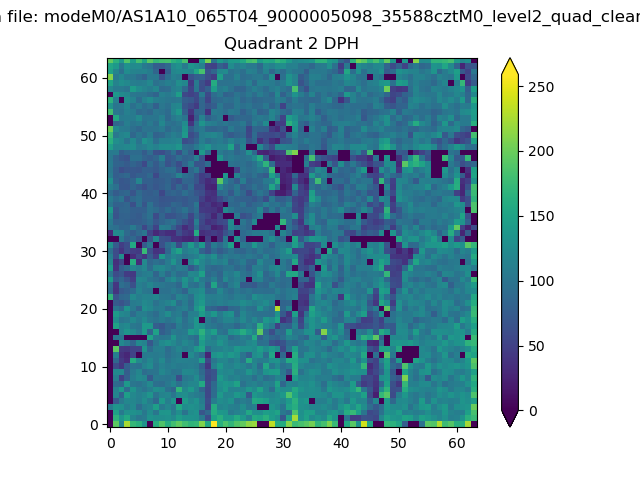
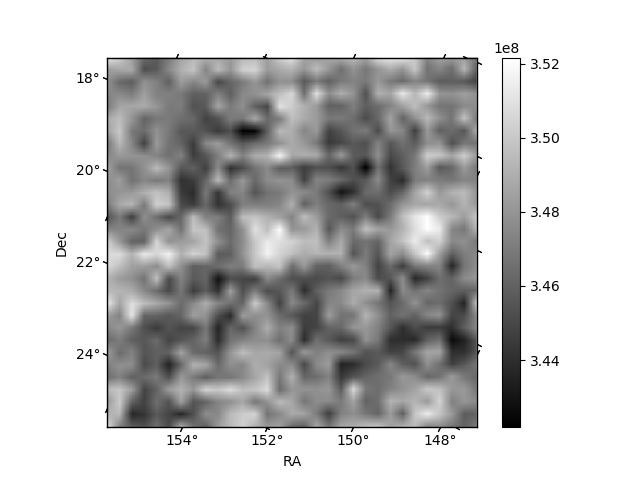
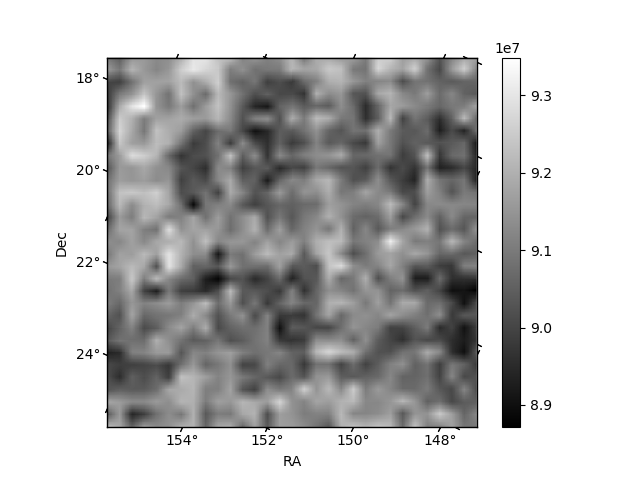
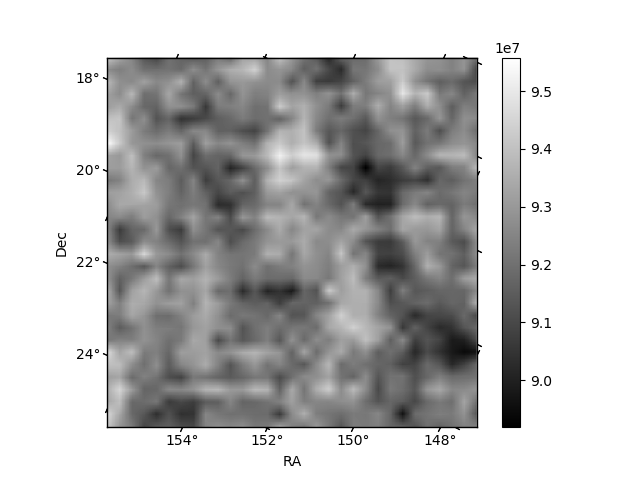
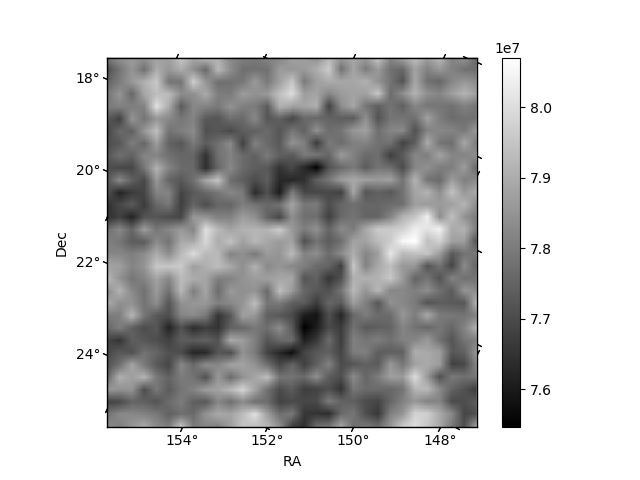
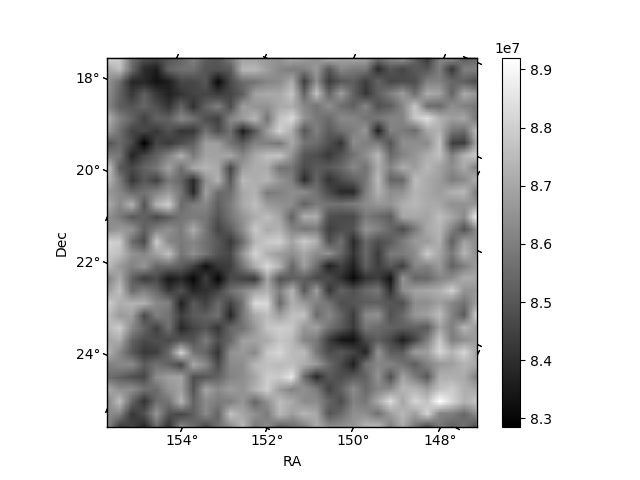
Histogram calculated using DETX and DETY for each event in the final _common_clean file
| Quadrant A | 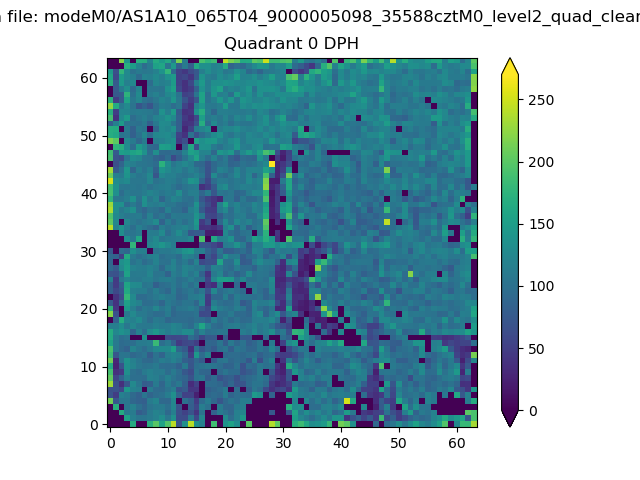 |
 |
Quadrant B |
|---|---|---|---|
| Quadrant D | 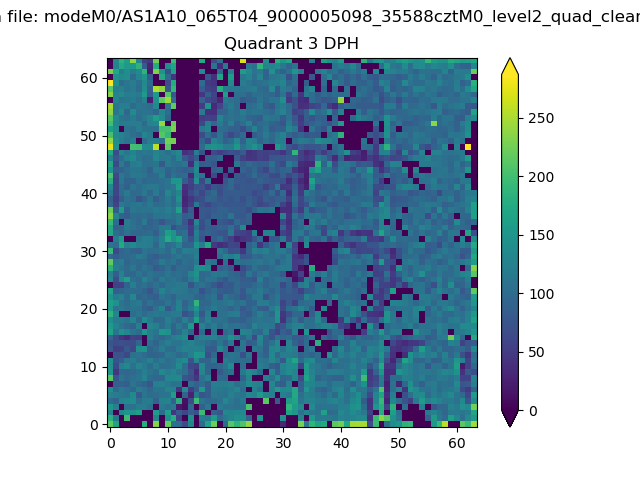 |
 |
Quadrant C |
| Plot type | Count rate plots | Images |
|---|---|---|
| Comparison with Poisson distribution Blue bars denote a histogram of data divided into 1 sec bins. Red curve is a Poisson curve with rate = median count rate of data. |
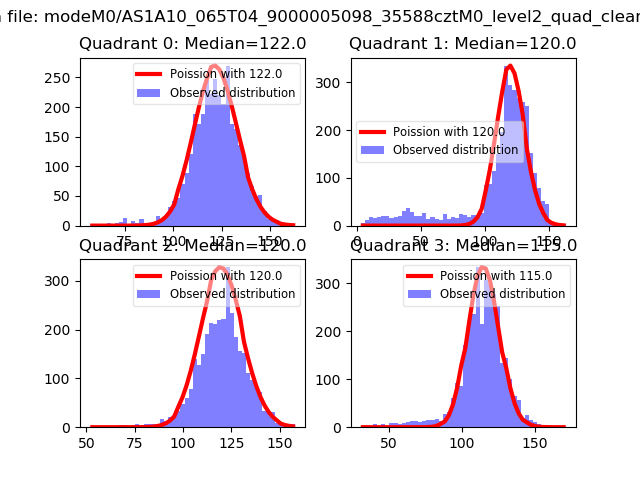 |
 |
| Quadrant-wise count rates Data is divided into 100 sec bins |
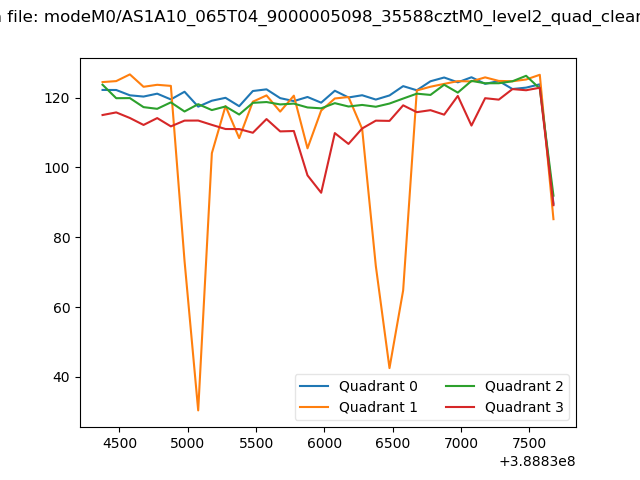 |
|
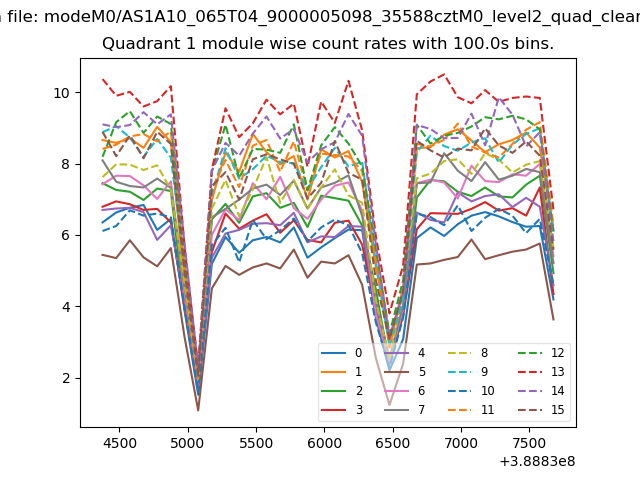
| Module-wise count rates for Quadrant A Data is divided into 100 sec bins |
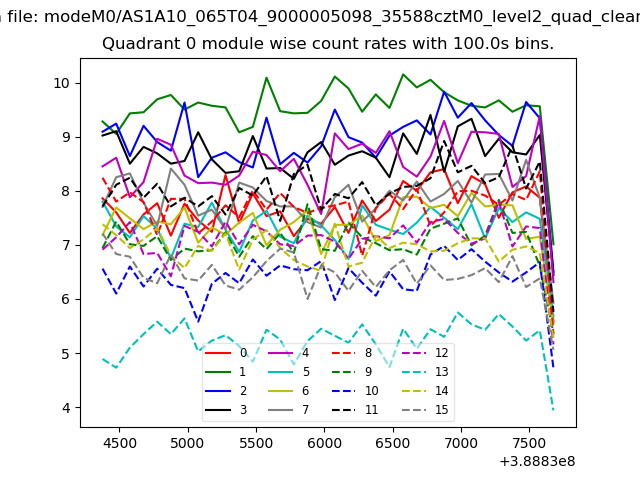 |
 |
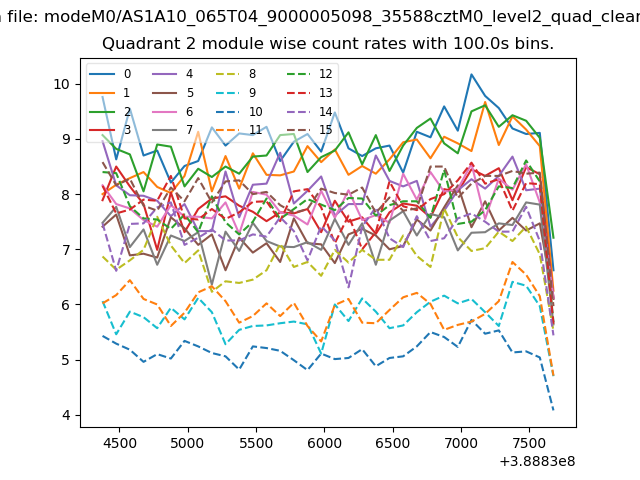
| Module-wise count rates for Quadrant B Data is divided into 100 sec bins |
 |
 |
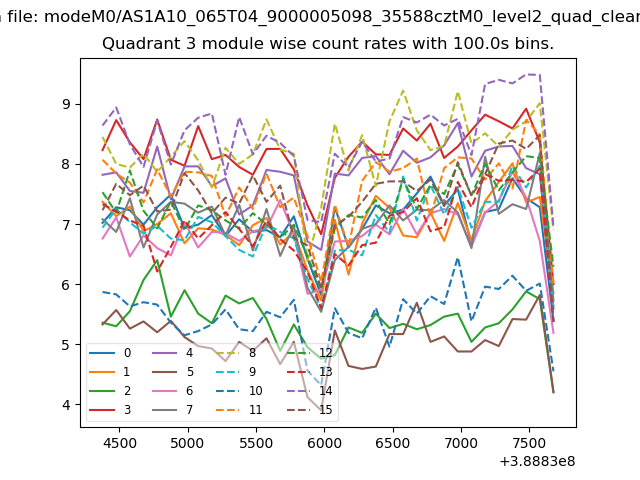
| Module-wise count rates for Quadrant C Data is divided into 100 sec bins |
 |
 |
| Module-wise count rates for Quadrant D Data is divided into 100 sec bins |
 |
 |
| Parameter | Plot |
|---|---|
| CZT HV Monitor | 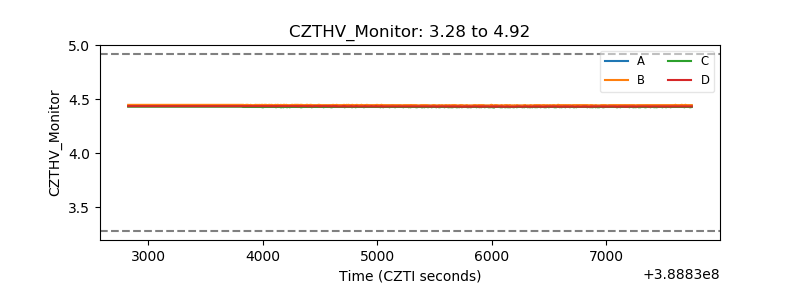 |
| D_VDD | 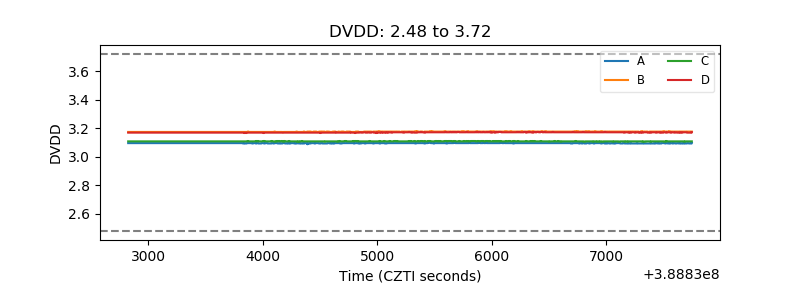 |
| Temperature 1 | 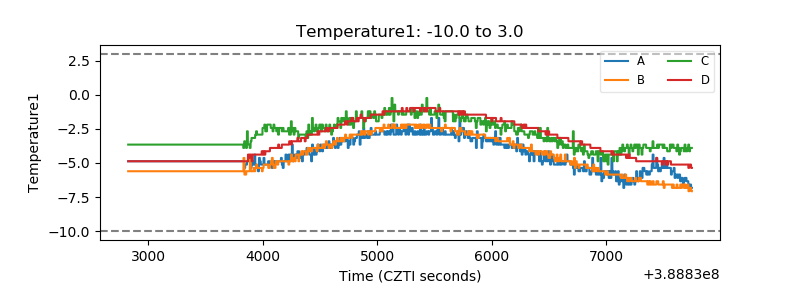 |
| Veto HV Monitor | 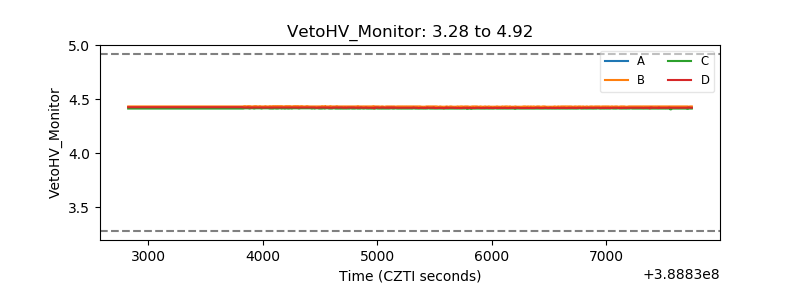 |
| Veto LLD | 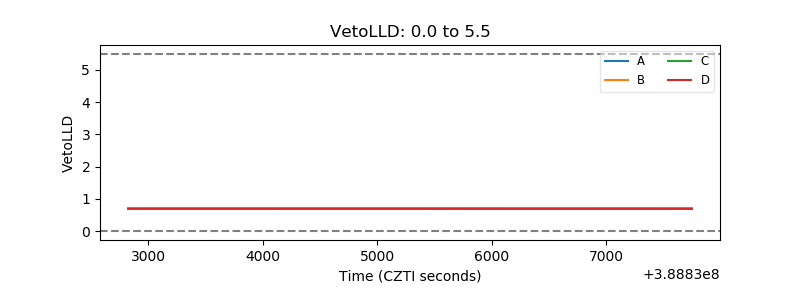 |
| Alpha Counter | 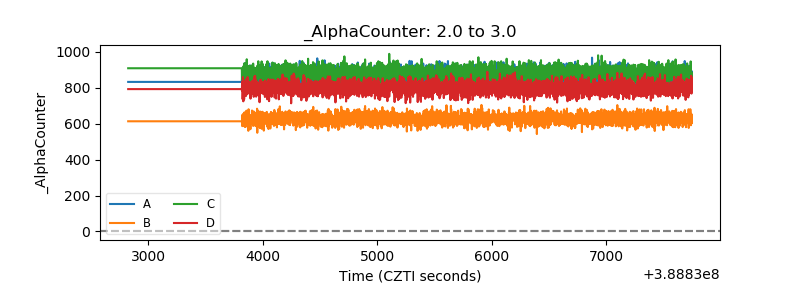 |
| _CPM_Rate | 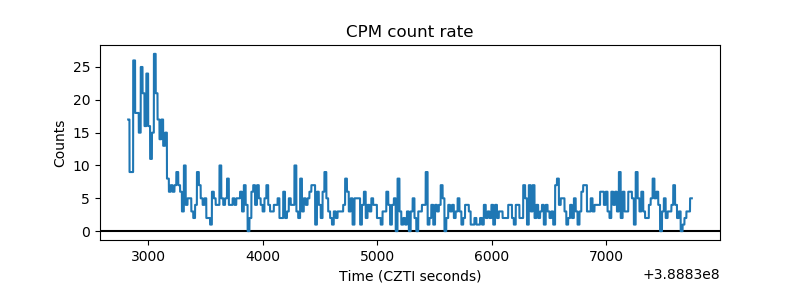 |
| CZT Counter | 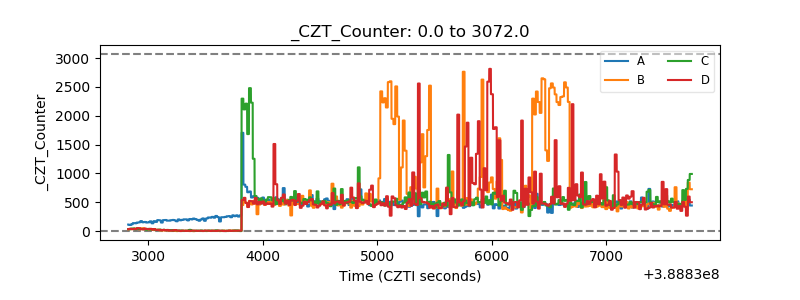 |
| +2.5 Volts monitor | 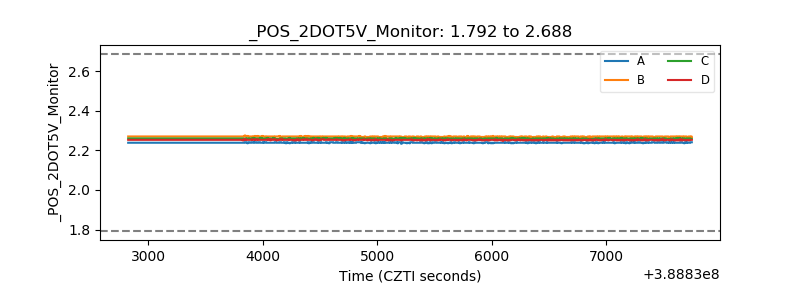 |
| +5 Volts monitor | 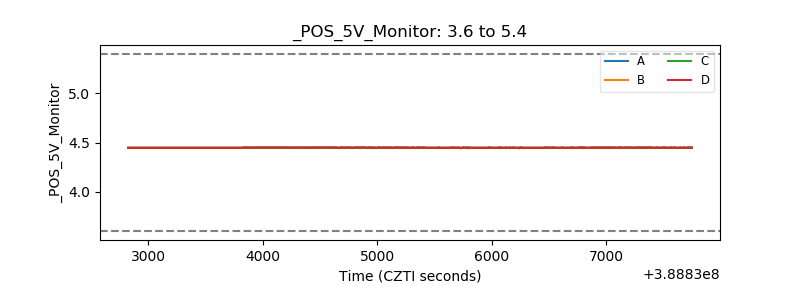 |
| _ROLL_ROT | 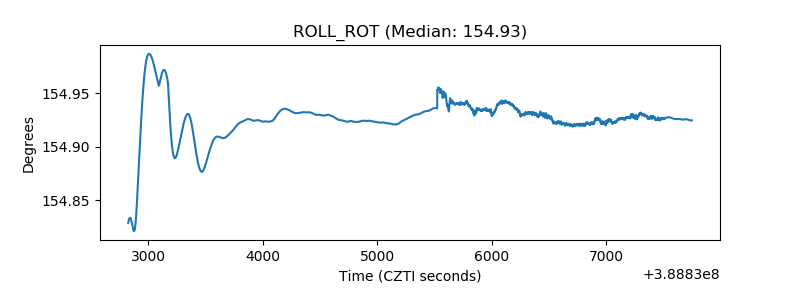 |
| _Roll_DEC | 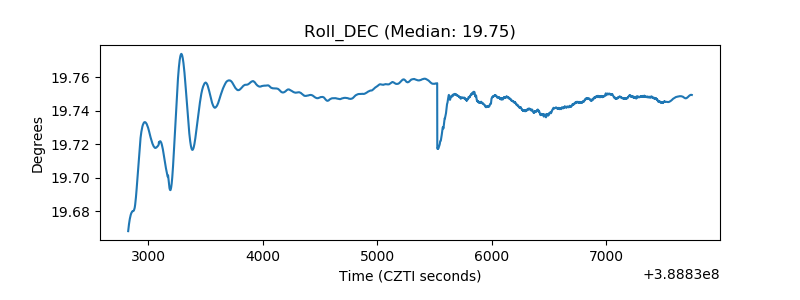 |
| _Roll_RA | 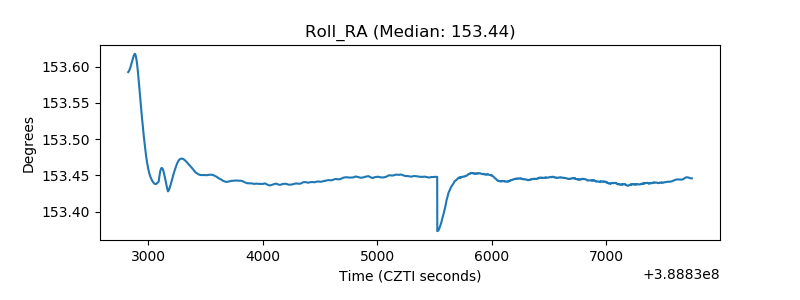 |
| Veto Counter | 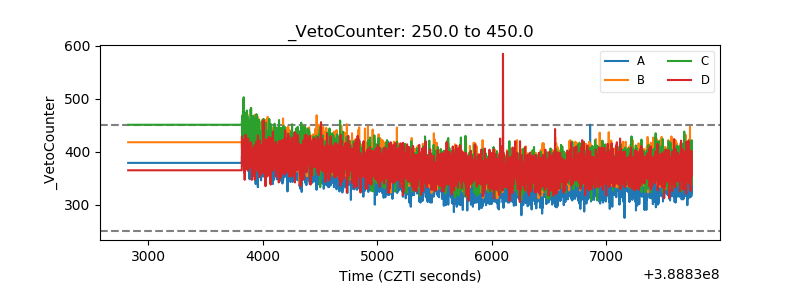 |