| Param | Original file | Final file |
|---|---|---|
| Filename | modeM0/AS1A10_065T04_9000005098cztM0_level2_bc.evt | modeM0/AS1A10_065T04_9000005098cztM0_level2_quad_clean.evt |
| Size (bytes) | 5,974,568,640 | 1,488,407,040 |
| Size | 5.6 GB | 1.4 GB |
| Events in quadrant A | 31,794,434 | 9,515,823 |
| Events in quadrant B | 40,462,757 | 9,465,996 |
| Events in quadrant C | 38,249,572 | 9,436,424 |
| Events in quadrant D | 62,154,718 | 8,314,408 |
| Mode M9 | |||
|---|---|---|---|
| Quadrant | BADHDUFLAG | Total packets | Discarded packets |
| A | 0 | 457 | 0 |
| B | 0 | 457 | 0 |
| C | 0 | 457 | 0 |
| D | 0 | 457 | 0 |
| Mode M0 | |||
|---|---|---|---|
| Quadrant | BADHDUFLAG | Total packets | Discarded packets |
| A | 0 | 269204 | 0 |
| B | 0 | 313003 | 0 |
| C | 0 | 282618 | 0 |
| D | 0 | 399911 | 0 |
| Mode SS | |||
|---|---|---|---|
| Quadrant | BADHDUFLAG | Total packets | Discarded packets |
| A | 0 | 2496 | 0 |
| B | 0 | 2500 | 0 |
| C | 0 | 2500 | 0 |
| D | 0 | 2497 | 0 |
| Quadrant | Total seconds | Saturated seconds | Saturation percentage |
|---|---|---|---|
| A | 121734 | 1961 | 1.610889% |
| B | 121759 | 6132 | 5.036178% |
| C | 121757 | 2655 | 2.180573% |
| D | 121618 | 15518 | 12.759624% |
Noise dominated data is calculated using 1-second bins in cleaned event files. If a bin has >2000 counts, and if more than 50% of those come from <1% of pixels, then it is considered to be noise-dominated and hence unusable.
| Quadrant | # 1 sec bins | Bins with >0 counts | Bins with >2000 counts | High rate bins dominated by noise | Noise dominated (total time) | Noise dominated (detector-on time) | Marked lightcurve |
|---|---|---|---|---|---|---|---|
| A | 167448 | 121913 | 240 | 240 | 0.14% | 0.20% | 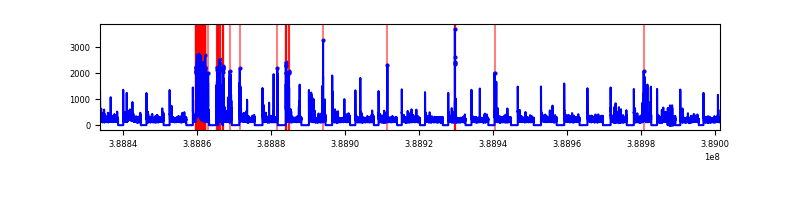 |
| B | 167448 | 121925 | 481 | 481 | 0.29% | 0.39% | 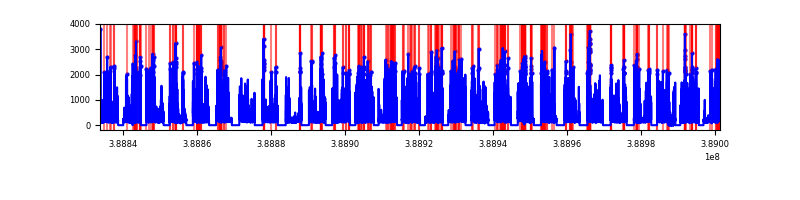 |
| C | 167448 | 121919 | 449 | 449 | 0.27% | 0.37% | 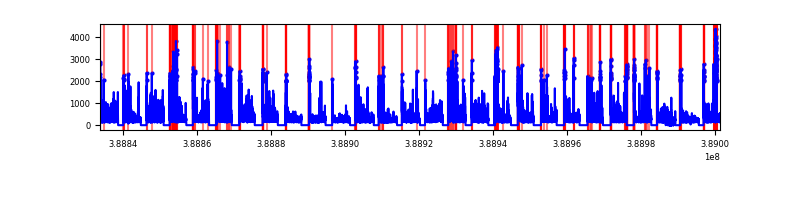 |
| D | 167448 | 121743 | 3018 | 3018 | 1.80% | 2.48% | 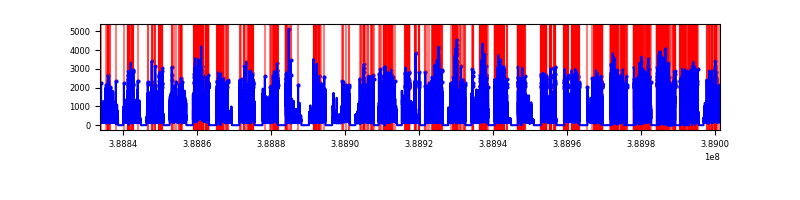 |
Top three noisy pixels from each quadrant. If the there are fewer than three noisy pixels in the level2.evt file, extra rows are filled as -1
| Pixel properties | Quadrant properties | ||||||
|---|---|---|---|---|---|---|---|
| Quadrant | DetID | PixID | Counts | Sigma | Mean | Median | Sigma |
| A | 15 | 169 | 5027914 | 3713.22 | 6146 | 6039 | 1352.4 |
| A | 10 | 83 | 2382140 | 1756.91 | 6146 | 6039 | 1352.4 |
| A | 13 | 6 | 227794 | 163.97 | 6146 | 6039 | 1352.4 |
| B | 5 | 172 | 14006093 | 11754.34 | 6120 | 5987 | 1191.1 |
| B | 4 | 81 | 713982 | 594.42 | 6120 | 5987 | 1191.1 |
| B | 15 | 85 | 447063 | 370.32 | 6120 | 5987 | 1191.1 |
| C | 0 | 10 | 6548837 | 4743.18 | 6038 | 5976 | 1379.4 |
| C | 15 | 214 | 4698661 | 3401.92 | 6038 | 5976 | 1379.4 |
| C | 1 | 23 | 1239121 | 893.96 | 6038 | 5976 | 1379.4 |
| D | 7 | 80 | 25215936 | 18272.28 | 5706 | 5517 | 1379.7 |
| D | 13 | 249 | 2415568 | 1746.78 | 5706 | 5517 | 1379.7 |
| D | 12 | 227 | 1885915 | 1362.89 | 5706 | 5517 | 1379.7 |
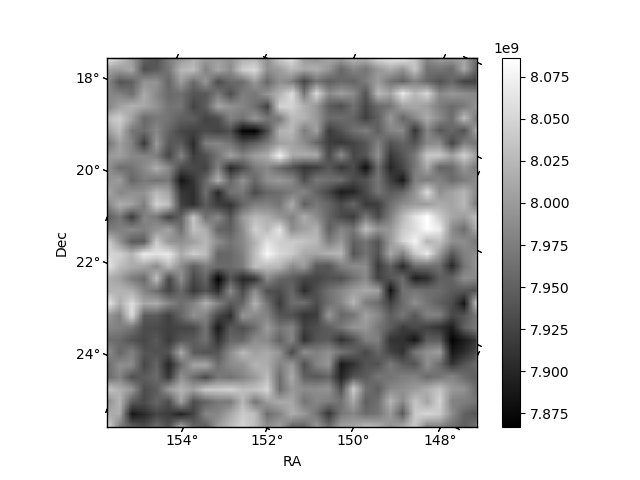
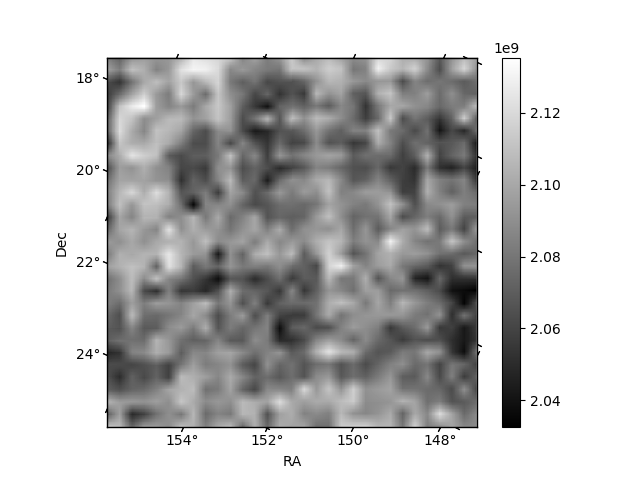
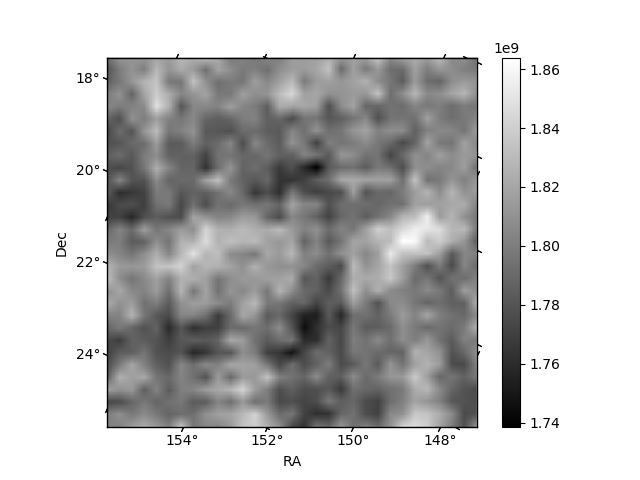
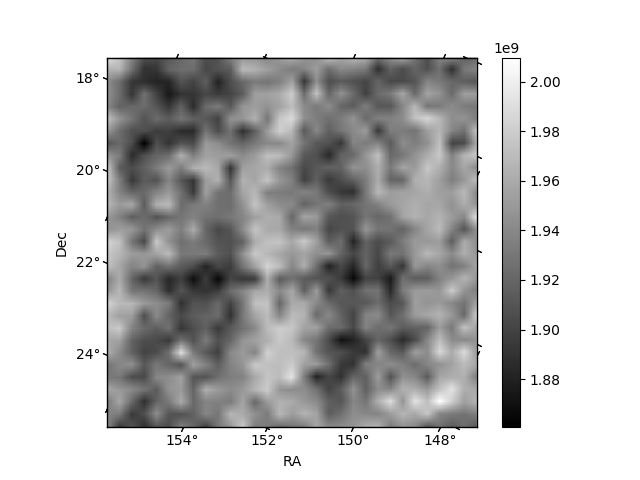
Histogram calculated using DETX and DETY for each event in the final _common_clean file
| Quadrant A | 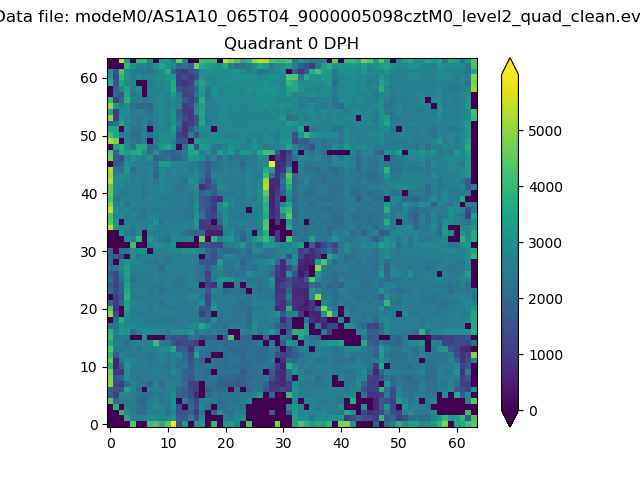 |
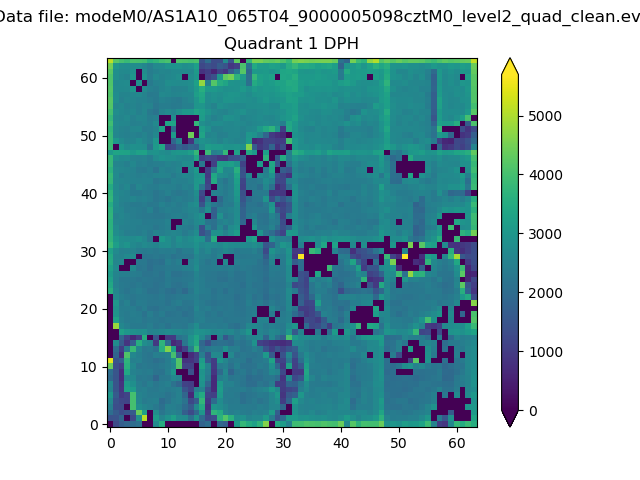 |
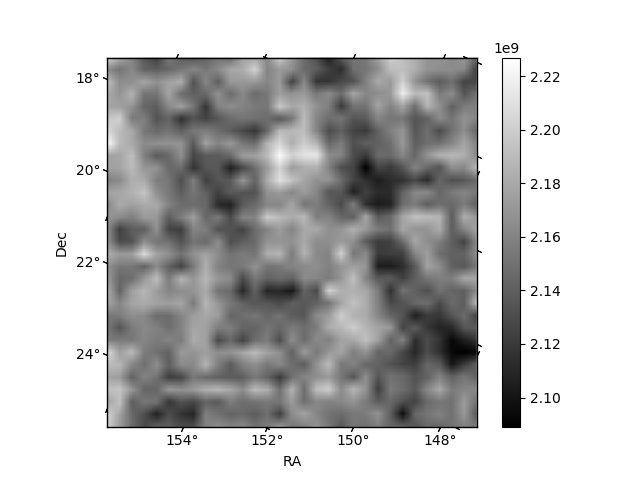
Quadrant B |
|---|---|---|---|
| Quadrant D | 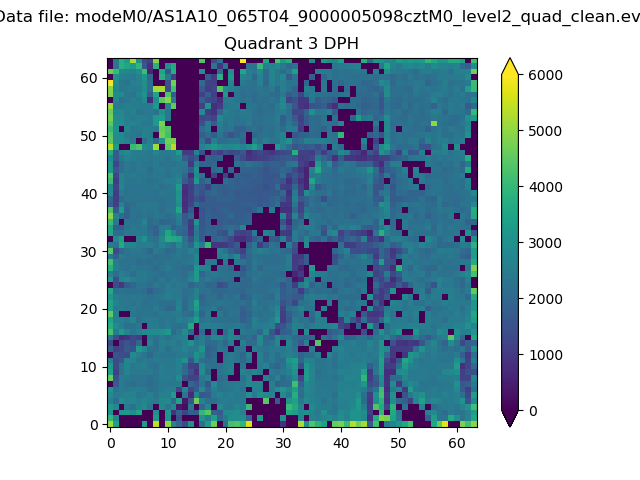 |
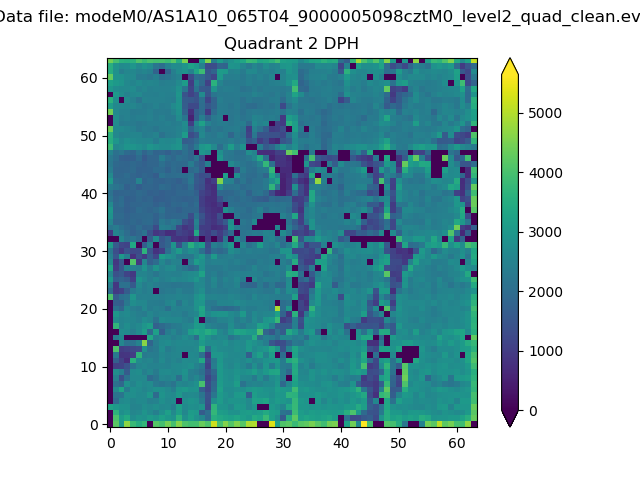 |
Quadrant C |
| Plot type | Count rate plots | Images |
|---|---|---|
| Comparison with Poisson distribution Blue bars denote a histogram of data divided into 1 sec bins. Red curve is a Poisson curve with rate = median count rate of data. |
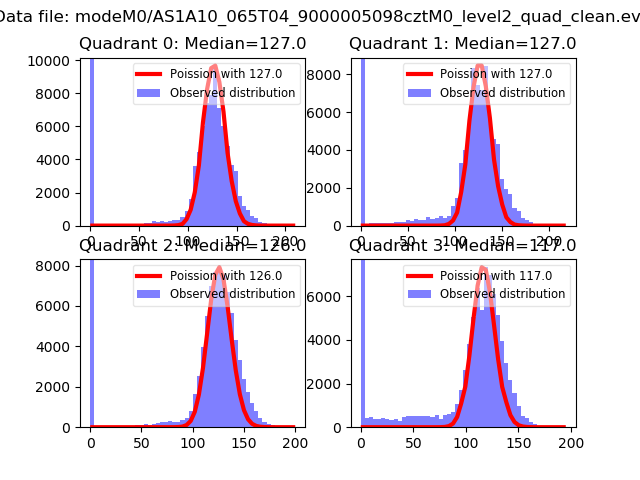 |
 |
| Quadrant-wise count rates Data is divided into 100 sec bins |
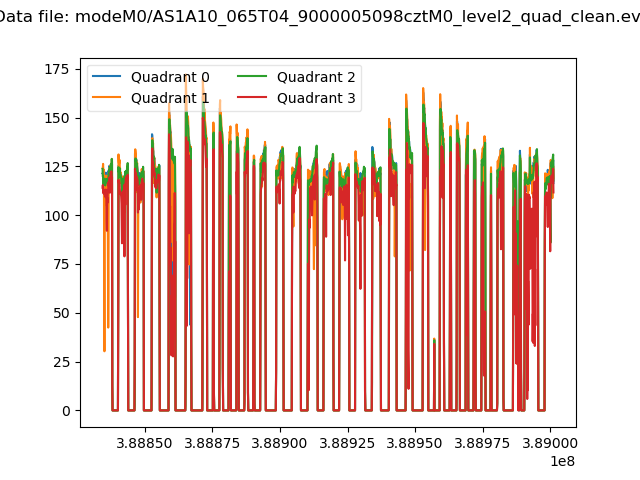 |
|
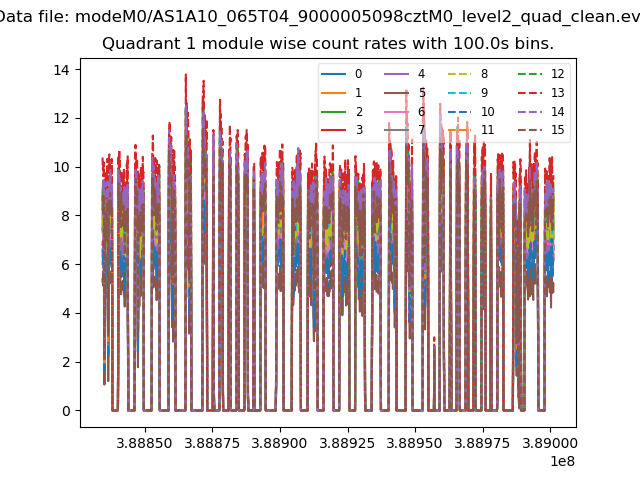
| Module-wise count rates for Quadrant A Data is divided into 100 sec bins |
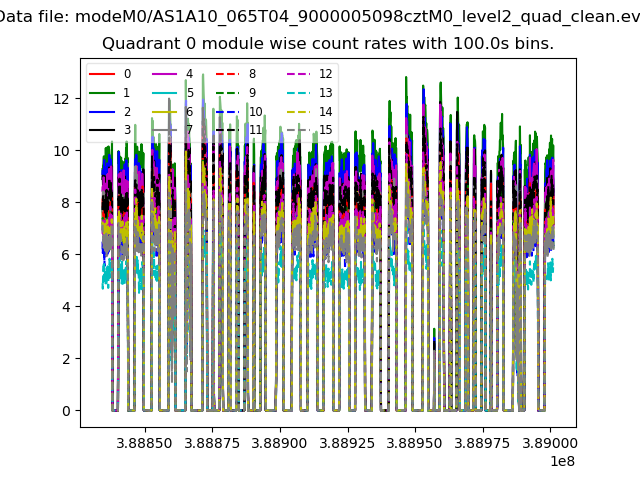 |
 |
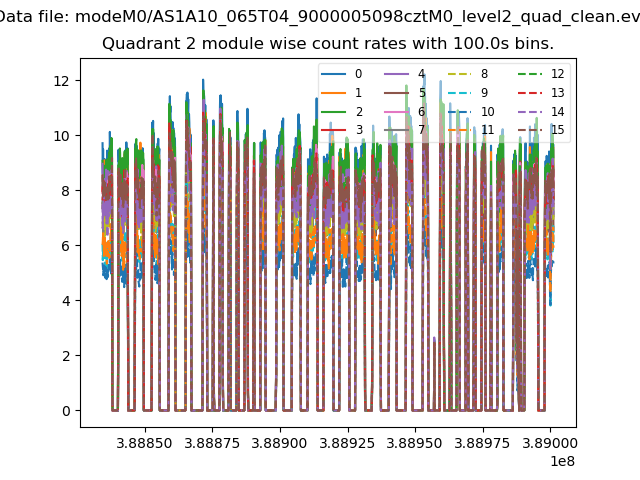
| Module-wise count rates for Quadrant B Data is divided into 100 sec bins |
 |
 |
| Module-wise count rates for Quadrant C Data is divided into 100 sec bins |
 |
 |
| Module-wise count rates for Quadrant D Data is divided into 100 sec bins |
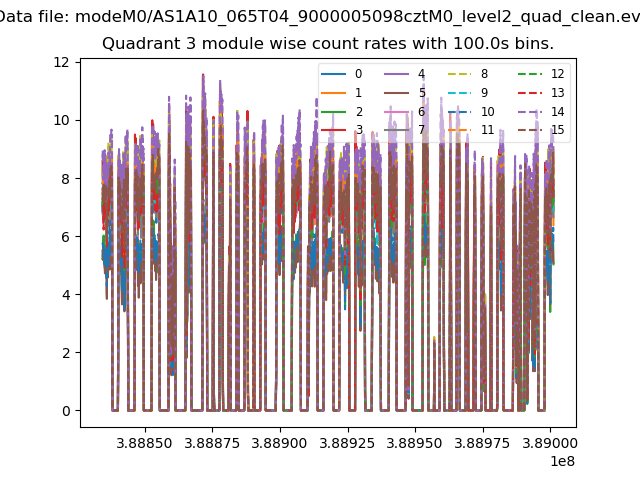 |
 |
| Parameter | Plot |
|---|---|
| CZT HV Monitor | 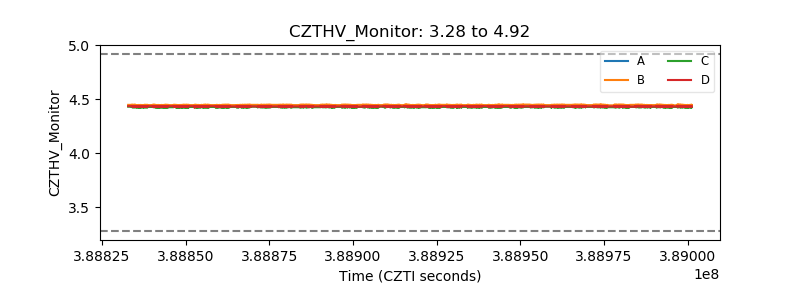 |
| D_VDD | 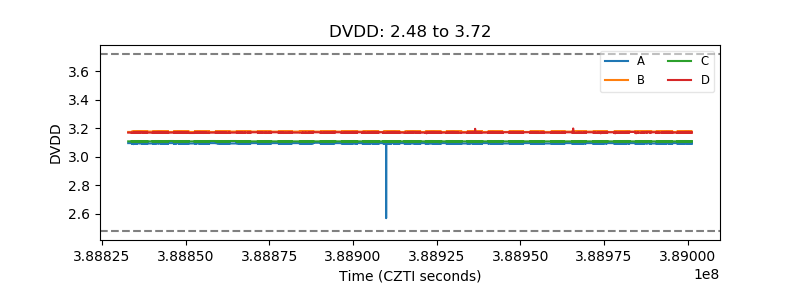 |
| Temperature 1 | 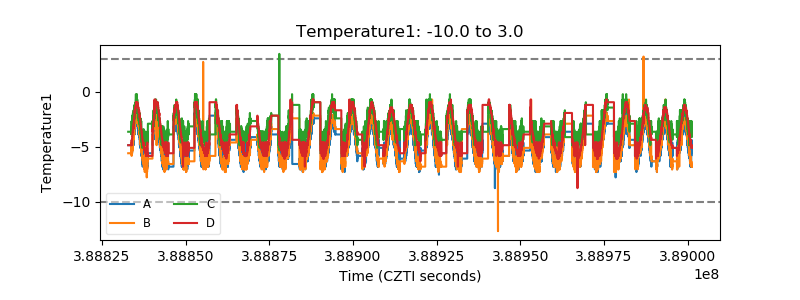 |
| Veto HV Monitor | 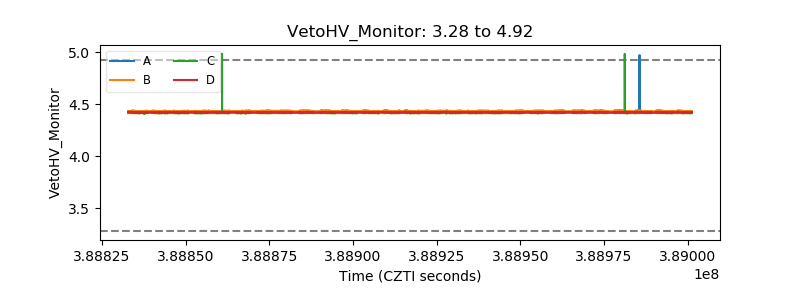 |
| Veto LLD | 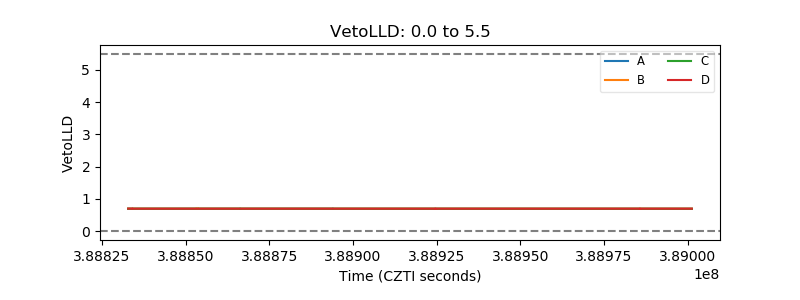 |
| Alpha Counter | 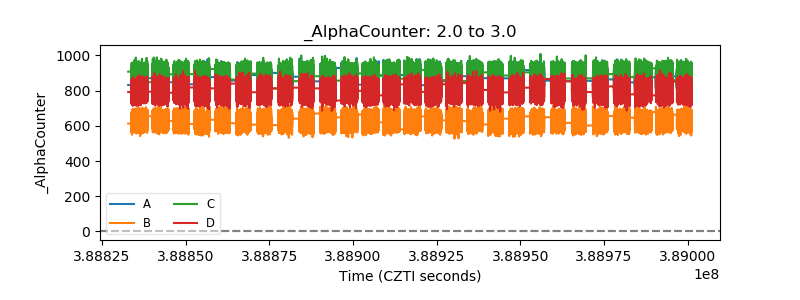 |
| _CPM_Rate | 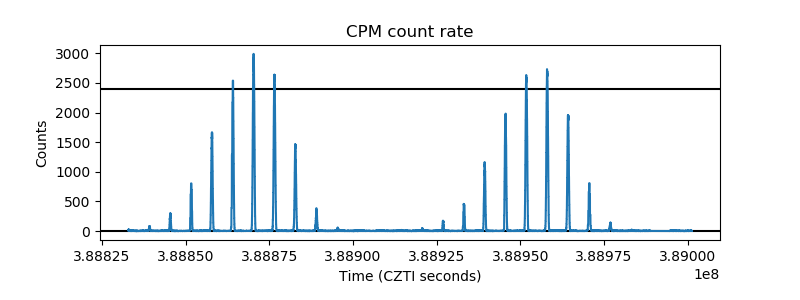 |
| CZT Counter | 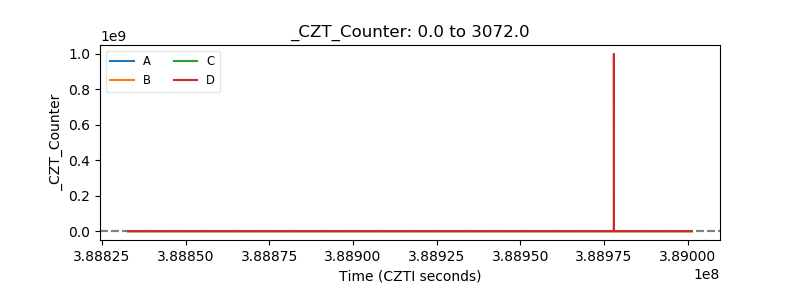 |
| +2.5 Volts monitor | 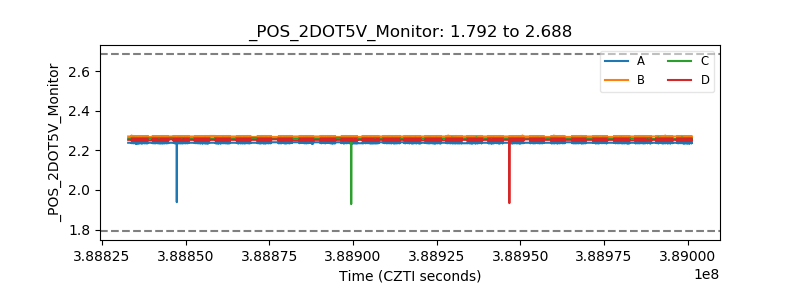 |
| +5 Volts monitor | 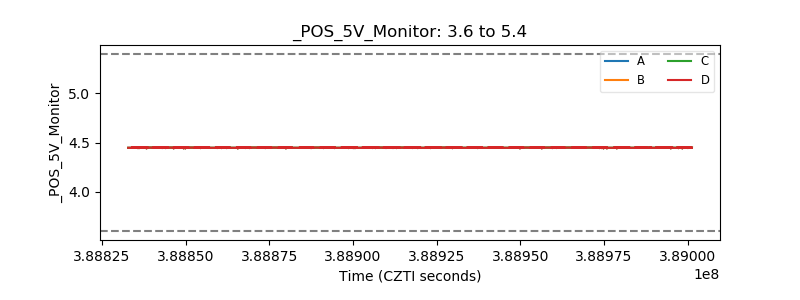 |
| _ROLL_ROT | 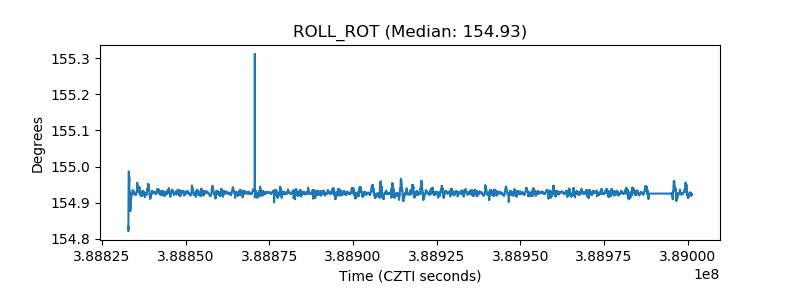 |
| _Roll_DEC | 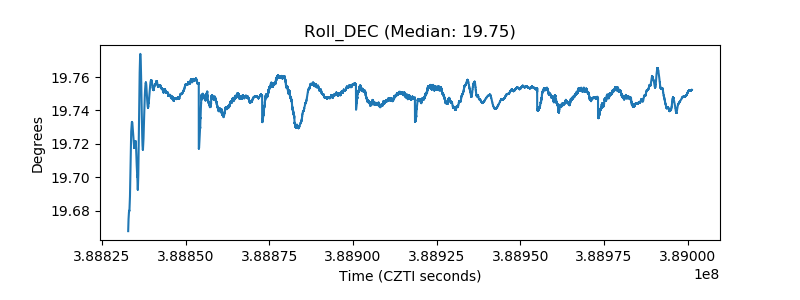 |
| _Roll_RA | 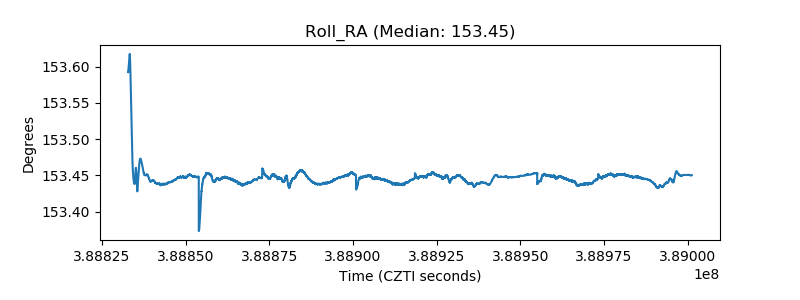 |
| Veto Counter | 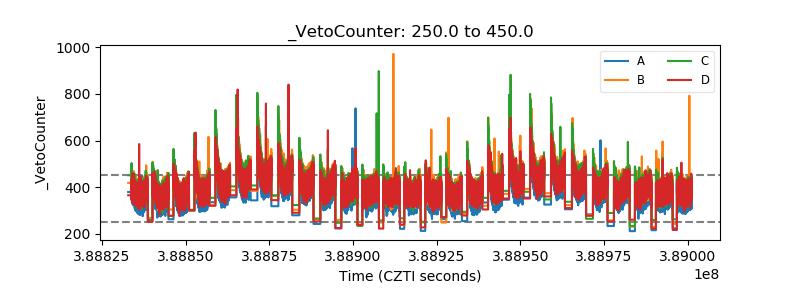 |