| Param | Original file | Final file |
|---|---|---|
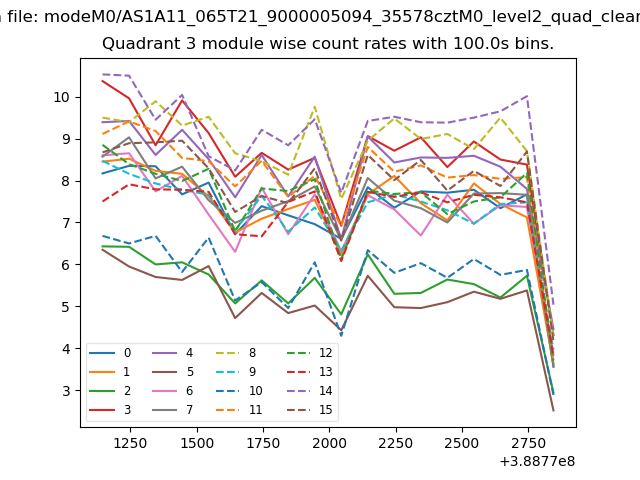
| Filename | modeM0/AS1A11_065T21_9000005094_35578cztM0_level2.evt | modeM0/AS1A11_065T21_9000005094_35578cztM0_level2_quad_clean.evt |
| Size (bytes) | 192,087,360 | 33,382,080 |
| Size | 183.2 MB | 31.8 MB |
| Events in quadrant A | 874,316 | 237,244 |
| Events in quadrant B | 1,957,373 | 204,779 |
| Events in quadrant C | 1,113,890 | 226,756 |
| Events in quadrant D | 1,750,779 | 213,251 |
| Mode M0 | |||
|---|---|---|---|
| Quadrant | BADHDUFLAG | Total packets | Discarded packets |
| A | 0 | 3762 | 1 |
| B | 0 | 7001 | 1 |
| C | 0 | 4352 | 1 |
| D | 0 | 6422 | 1 |
| Mode M9 | |||
|---|---|---|---|
| Quadrant | BADHDUFLAG | Total packets | Discarded packets |
| A | 1 | 140388587637544 | 46 |
| B | 1 | -1 | -1 |
| C | 1 | -1 | -1 |
| D | 1 | -1 | -1 |
| Mode SS | |||
|---|---|---|---|
| Quadrant | BADHDUFLAG | Total packets | Discarded packets |
| A | 0 | 34 | 0 |
| B | 0 | 34 | 0 |
| C | 0 | 34 | 0 |
| D | 0 | 34 | 0 |
| Quadrant | Total seconds | Saturated seconds | Saturation percentage |
|---|---|---|---|
| A | 1752 | 2 | 0.114155% |
| B | 1752 | 495 | 28.253425% |
| C | 1752 | 99 | 5.650685% |
| D | 1752 | 180 | 10.273973% |
Noise dominated data is calculated using 1-second bins in cleaned event files. If a bin has >2000 counts, and if more than 50% of those come from <1% of pixels, then it is considered to be noise-dominated and hence unusable.
| Quadrant | # 1 sec bins | Bins with >0 counts | Bins with >2000 counts | High rate bins dominated by noise | Noise dominated (total time) | Noise dominated (detector-on time) | Marked lightcurve |
|---|---|---|---|---|---|---|---|
| A | 1752 | 1752 | 0 | 0 | 0.00% | 0.00% | 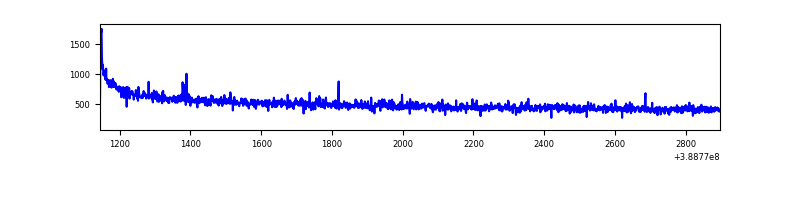 |
| B | 1752 | 1752 | 386 | 386 | 22.03% | 22.03% | 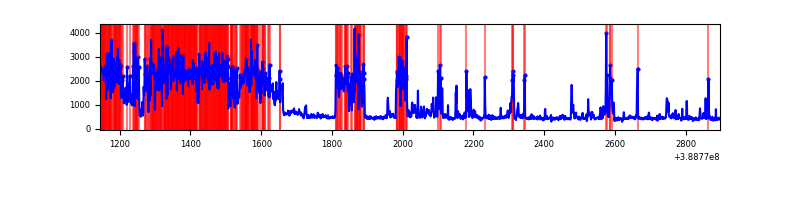 |
| C | 1752 | 1752 | 69 | 69 | 3.94% | 3.94% | 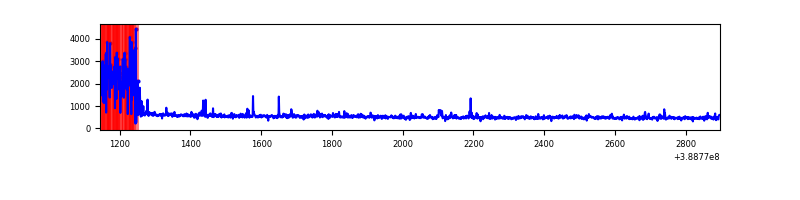 |
| D | 1752 | 1752 | 106 | 106 | 6.05% | 6.05% | 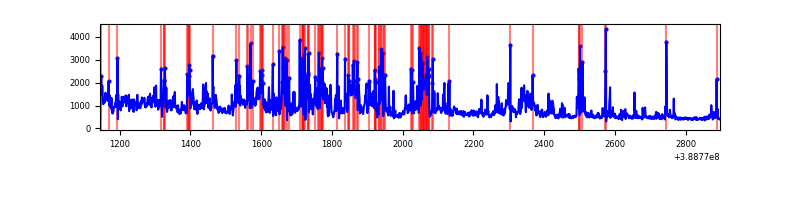 |
Top three noisy pixels from each quadrant. If the there are fewer than three noisy pixels in the level2.evt file, extra rows are filled as -1
| Pixel properties | Quadrant properties | ||||||
|---|---|---|---|---|---|---|---|
| Quadrant | DetID | PixID | Counts | Sigma | Mean | Median | Sigma |
| A | 10 | 83 | 62464 | 1425.4 | 206 | 202 | 43.7 |
| A | 13 | 6 | 7373 | 164.17 | 206 | 202 | 43.7 |
| A | 7 | 3 | 3374 | 72.62 | 206 | 202 | 43.7 |
| B | 5 | 172 | 1208987 | 34641.18 | 178 | 173 | 34.9 |
| B | 5 | 200 | 25775 | 733.68 | 178 | 173 | 34.9 |
| B | 0 | 190 | 12225 | 345.38 | 178 | 173 | 34.9 |
| C | 0 | 10 | 253477 | 5443.49 | 196 | 197 | 46.5 |
| C | 15 | 214 | 71761 | 1538.05 | 196 | 197 | 46.5 |
| C | 14 | 67 | 20162 | 429.09 | 196 | 197 | 46.5 |
| D | 10 | 118 | 362766 | 7325.5 | 197 | 192 | 49.5 |
| D | 1 | 52 | 224180 | 4525.49 | 197 | 192 | 49.5 |
| D | 8 | 195 | 148661 | 2999.69 | 197 | 192 | 49.5 |
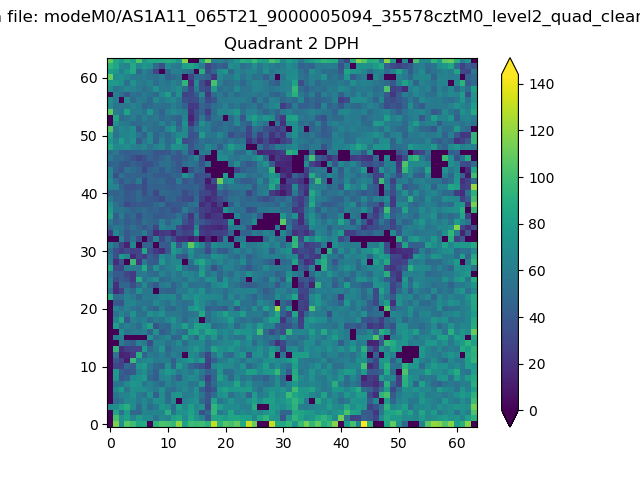
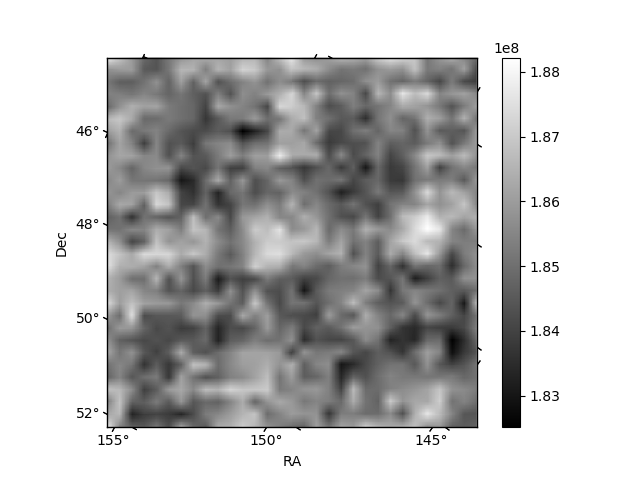
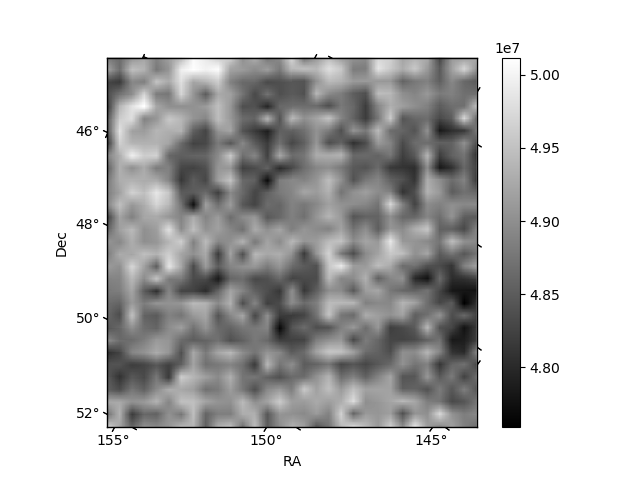
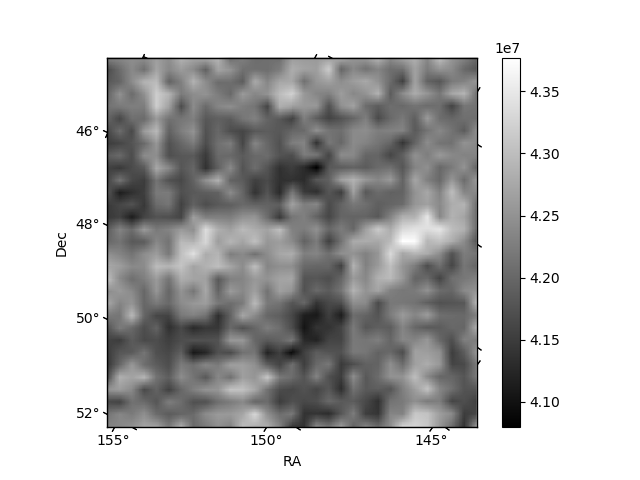
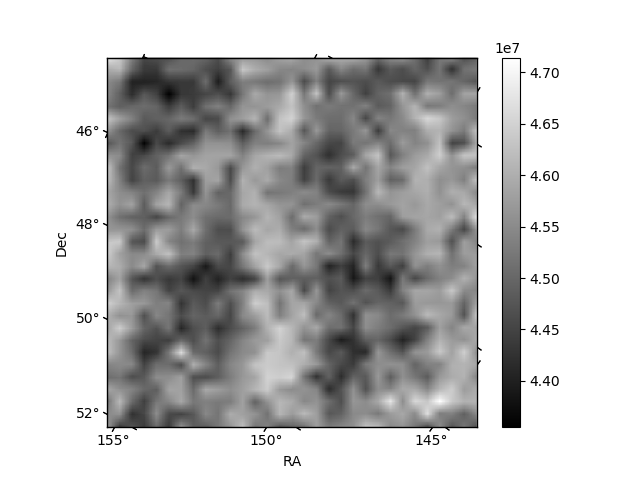
Histogram calculated using DETX and DETY for each event in the final _common_clean file
| Quadrant A | 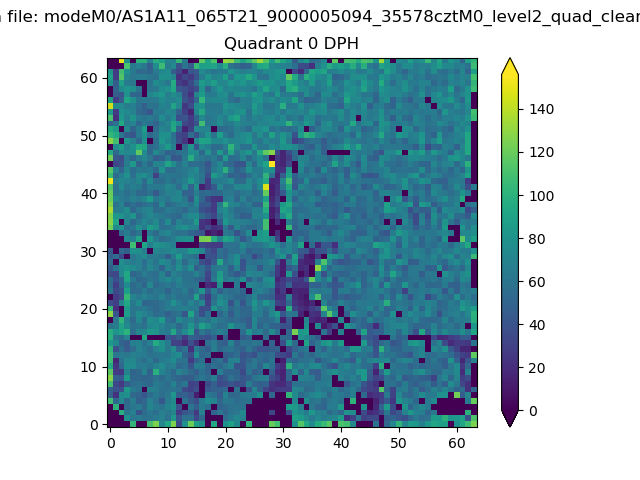 |
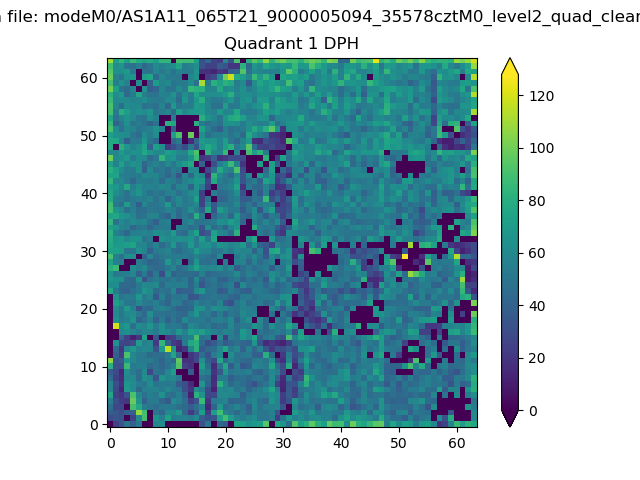 |
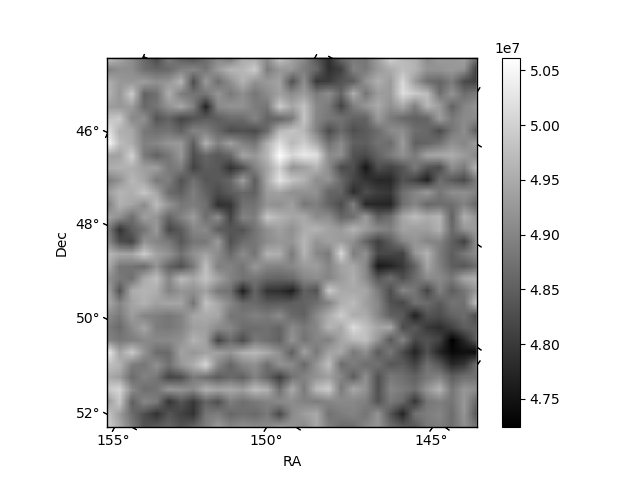
Quadrant B |
|---|---|---|---|
| Quadrant D | 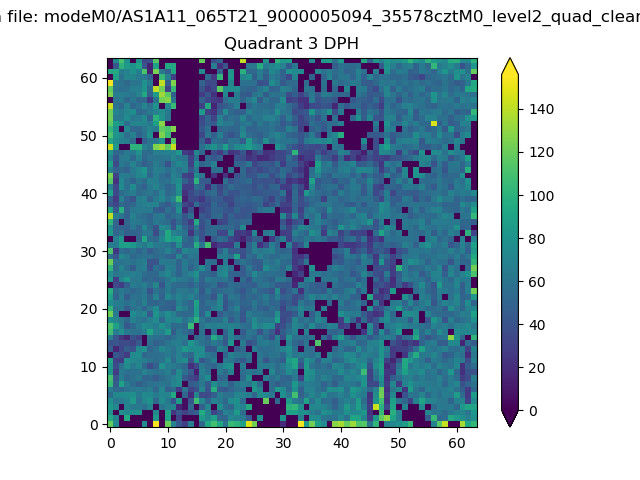 |
 |
Quadrant C |
| Plot type | Count rate plots | Images |
|---|---|---|
| Comparison with Poisson distribution Blue bars denote a histogram of data divided into 1 sec bins. Red curve is a Poisson curve with rate = median count rate of data. |
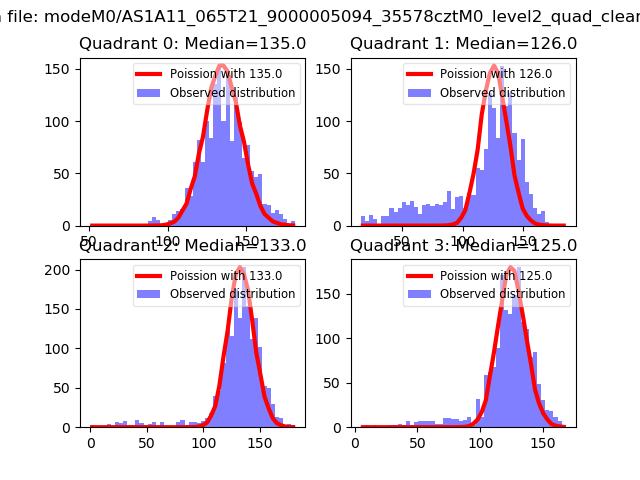 |
 |
| Quadrant-wise count rates Data is divided into 100 sec bins |
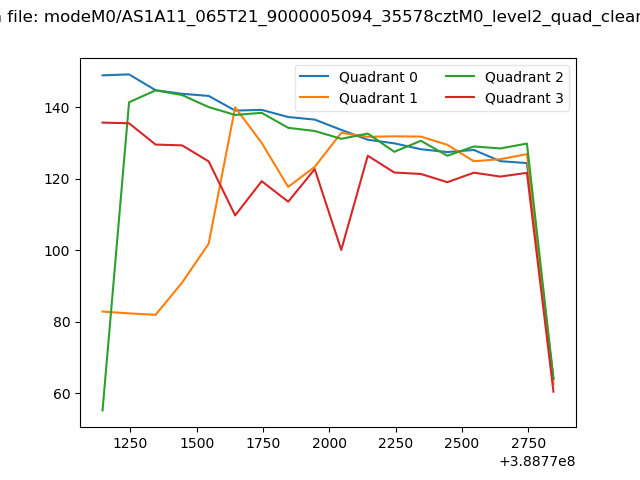 |
|
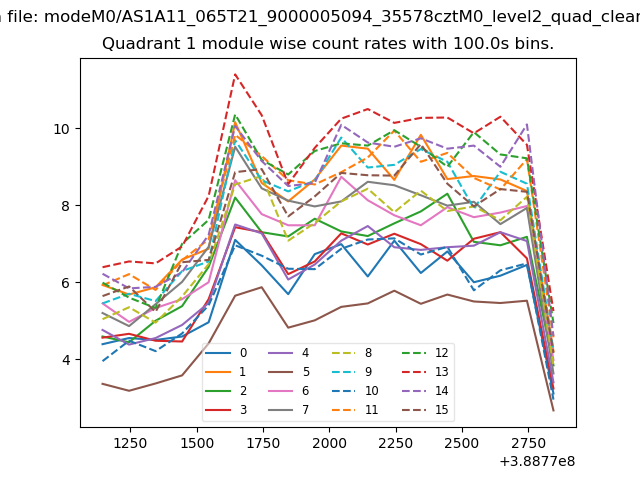
| Module-wise count rates for Quadrant A Data is divided into 100 sec bins |
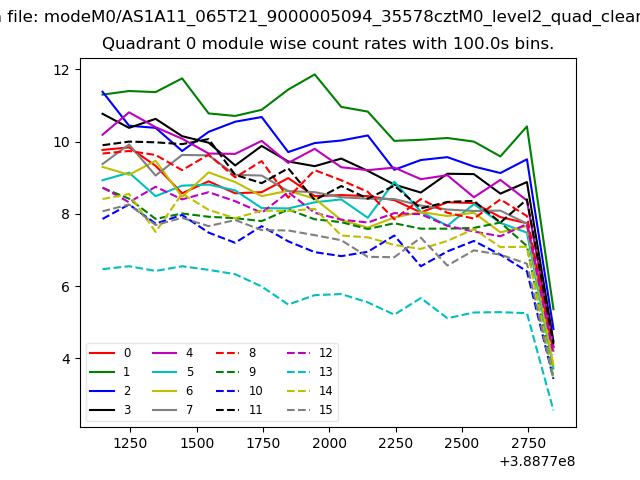 |
 |
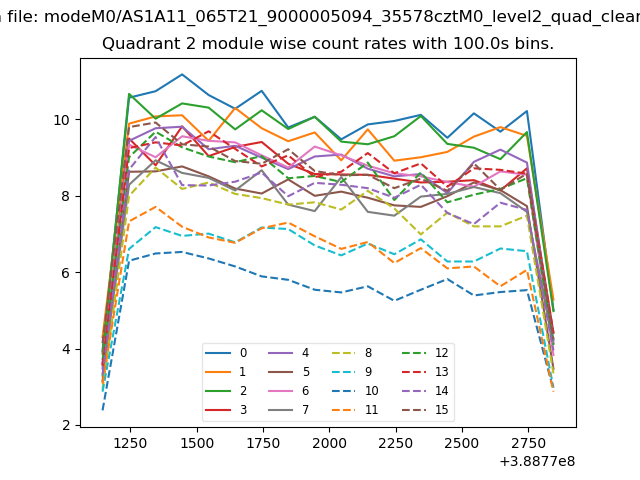
| Module-wise count rates for Quadrant B Data is divided into 100 sec bins |
 |
 |
| Module-wise count rates for Quadrant C Data is divided into 100 sec bins |
 |
 |
| Module-wise count rates for Quadrant D Data is divided into 100 sec bins |
 |
 |
| Parameter | Plot |
|---|---|
| CZT HV Monitor | 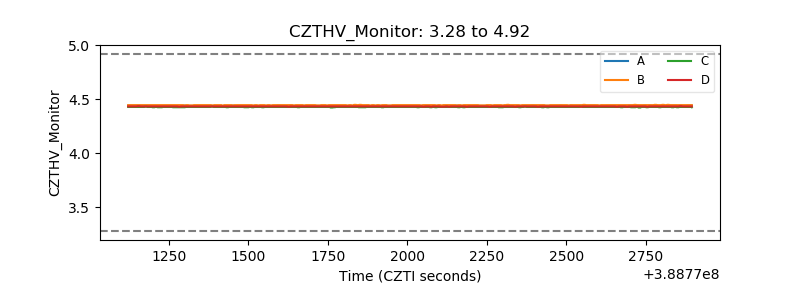 |
| D_VDD | 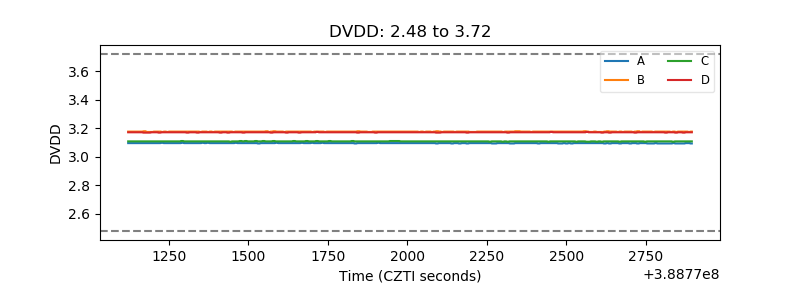 |
| Temperature 1 |  |
| Veto HV Monitor |  |
| Veto LLD | 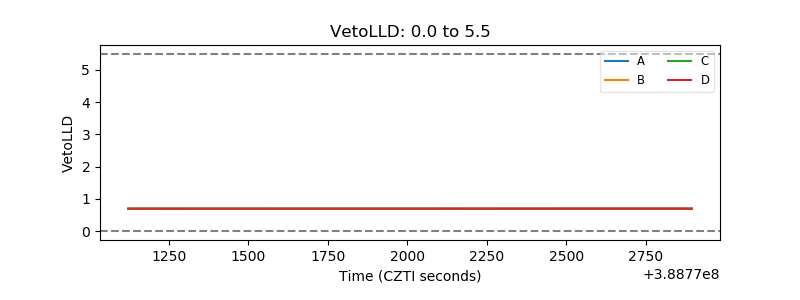 |
| Alpha Counter | 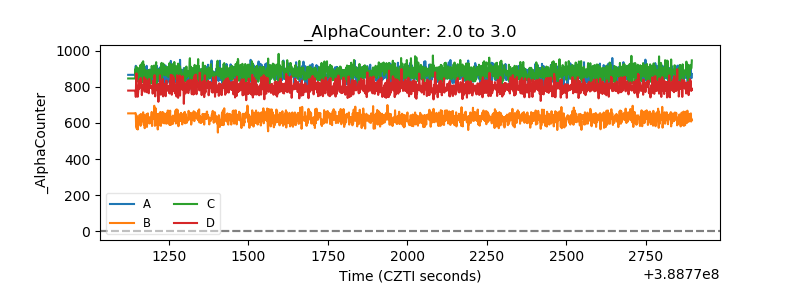 |
| _CPM_Rate | 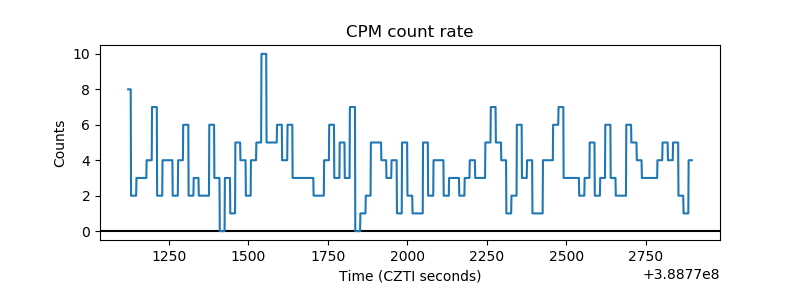 |
| CZT Counter | 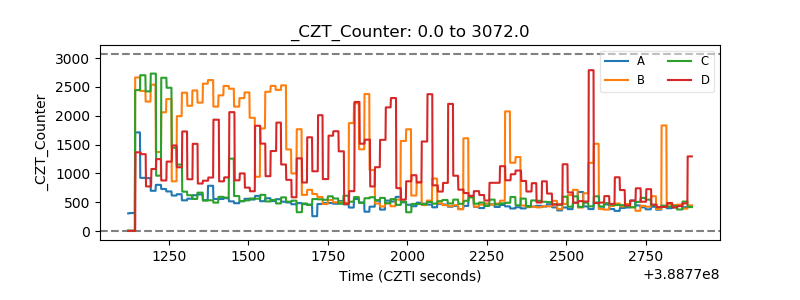 |
| +2.5 Volts monitor | 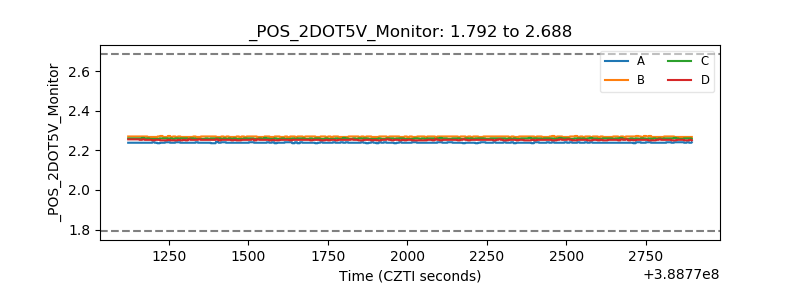 |
| +5 Volts monitor | 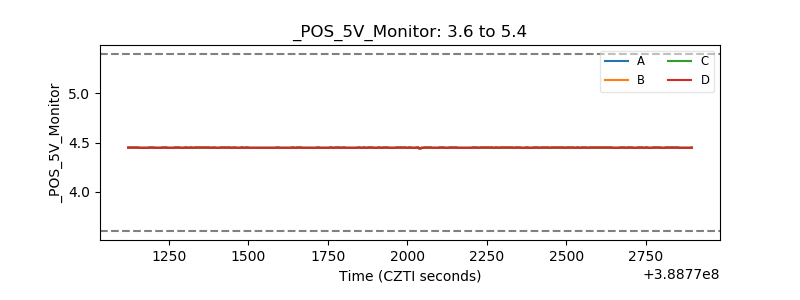 |
| _ROLL_ROT | 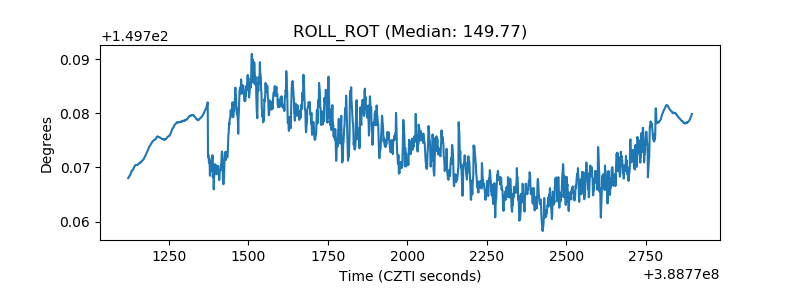 |
| _Roll_DEC | 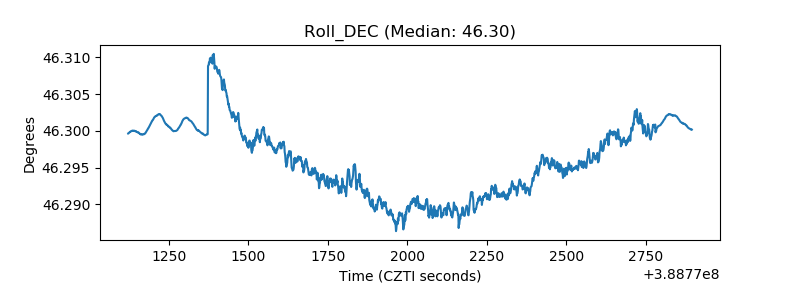 |
| _Roll_RA | 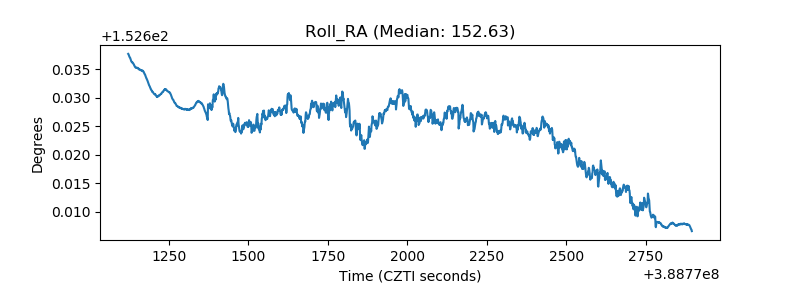 |
| Veto Counter | 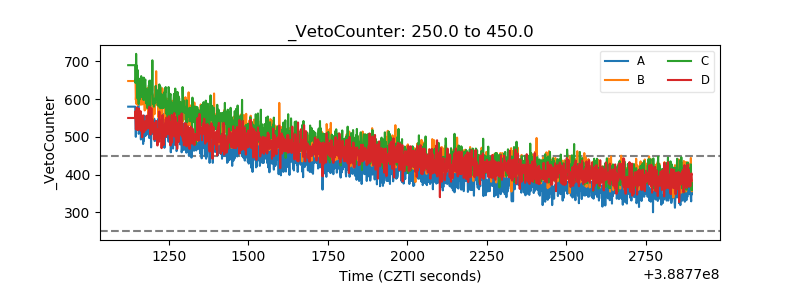 |