| Param | Original file | Final file |
|---|---|---|
| Filename | modeM0/AS1A11_065T21_9000005094_35576cztM0_level2.evt | modeM0/AS1A11_065T21_9000005094_35576cztM0_level2_quad_clean.evt |
| Size (bytes) | 491,840,640 | 77,584,320 |
| Size | 469.1 MB | 74.0 MB |
| Events in quadrant A | 2,596,883 | 521,801 |
| Events in quadrant B | 4,434,066 | 475,696 |
| Events in quadrant C | 3,082,896 | 506,726 |
| Events in quadrant D | 4,414,855 | 466,309 |
| Mode M0 | |||
|---|---|---|---|
| Quadrant | BADHDUFLAG | Total packets | Discarded packets |
| A | 0 | 11363 | 3 |
| B | 0 | 16849 | 2 |
| C | 0 | 12410 | 2 |
| D | 0 | 16832 | 2 |
| Mode M9 | |||
|---|---|---|---|
| Quadrant | BADHDUFLAG | Total packets | Discarded packets |
| A | 0 | 18 | 0 |
| B | 0 | 18 | 0 |
| C | 0 | 18 | 0 |
| D | 0 | 18 | 0 |
| Mode SS | |||
|---|---|---|---|
| Quadrant | BADHDUFLAG | Total packets | Discarded packets |
| A | 0 | 110 | 0 |
| B | 0 | 110 | 0 |
| C | 0 | 110 | 0 |
| D | 0 | 110 | 0 |
| Quadrant | Total seconds | Saturated seconds | Saturation percentage |
|---|---|---|---|
| A | 5404 | 6 | 0.111029% |
| B | 5404 | 775 | 14.341229% |
| C | 5404 | 125 | 2.313101% |
| D | 5404 | 431 | 7.975574% |
Noise dominated data is calculated using 1-second bins in cleaned event files. If a bin has >2000 counts, and if more than 50% of those come from <1% of pixels, then it is considered to be noise-dominated and hence unusable.
| Quadrant | # 1 sec bins | Bins with >0 counts | Bins with >2000 counts | High rate bins dominated by noise | Noise dominated (total time) | Noise dominated (detector-on time) | Marked lightcurve |
|---|---|---|---|---|---|---|---|
| A | 7137 | 5405 | 0 | 0 | 0.00% | 0.00% | 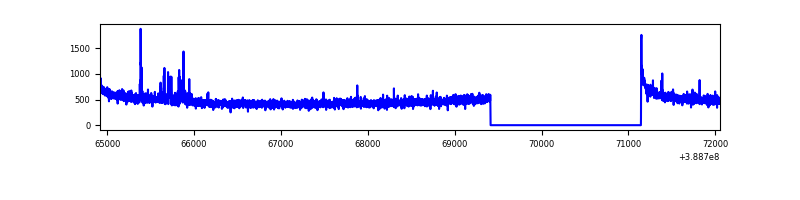 |
| B | 7137 | 5405 | 552 | 552 | 7.73% | 10.21% | 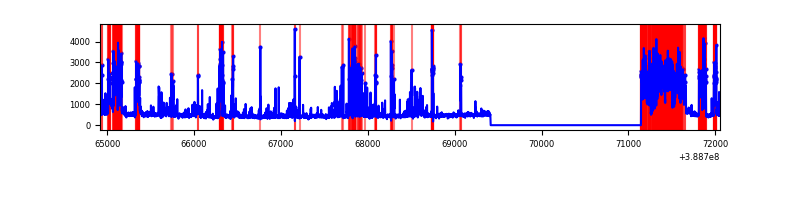 |
| C | 7137 | 5405 | 86 | 86 | 1.20% | 1.59% | 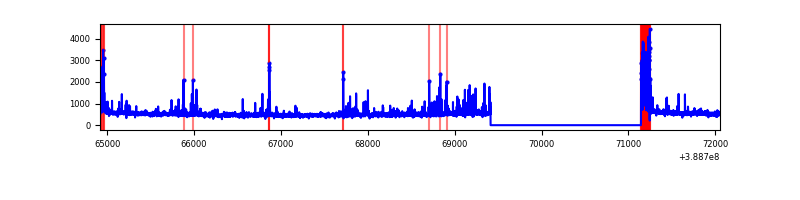 |
| D | 7137 | 5405 | 342 | 342 | 4.79% | 6.33% | 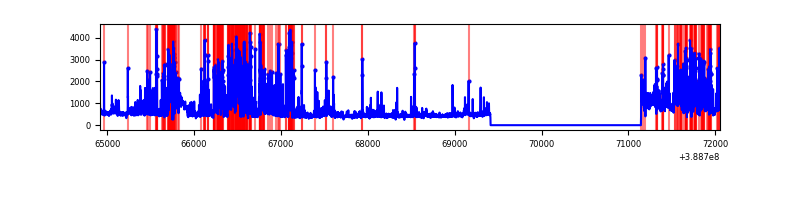 |
Top three noisy pixels from each quadrant. If the there are fewer than three noisy pixels in the level2.evt file, extra rows are filled as -1
| Pixel properties | Quadrant properties | ||||||
|---|---|---|---|---|---|---|---|
| Quadrant | DetID | PixID | Counts | Sigma | Mean | Median | Sigma |
| A | 10 | 83 | 130662 | 1032.53 | 621 | 607 | 126.0 |
| A | 7 | 3 | 48175 | 377.65 | 621 | 607 | 126.0 |
| A | 13 | 6 | 18870 | 144.99 | 621 | 607 | 126.0 |
| B | 5 | 172 | 1992198 | 18222.7 | 575 | 560 | 109.3 |
| B | 0 | 189 | 47577 | 430.19 | 575 | 560 | 109.3 |
| B | 15 | 85 | 46620 | 421.43 | 575 | 560 | 109.3 |
| C | 0 | 10 | 404822 | 2908.21 | 600 | 606 | 139.0 |
| C | 15 | 214 | 223243 | 1601.8 | 600 | 606 | 139.0 |
| C | 9 | 187 | 66846 | 476.58 | 600 | 606 | 139.0 |
| D | 7 | 80 | 625571 | 4340.98 | 589 | 572 | 144.0 |
| D | 10 | 118 | 460225 | 3192.56 | 589 | 572 | 144.0 |
| D | 12 | 6 | 230946 | 1600.08 | 589 | 572 | 144.0 |
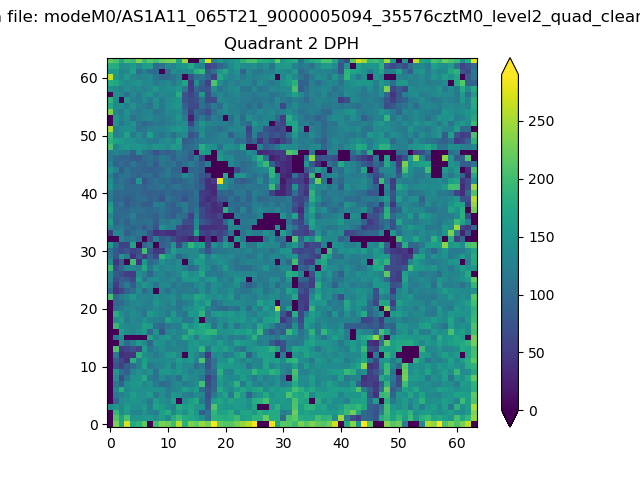
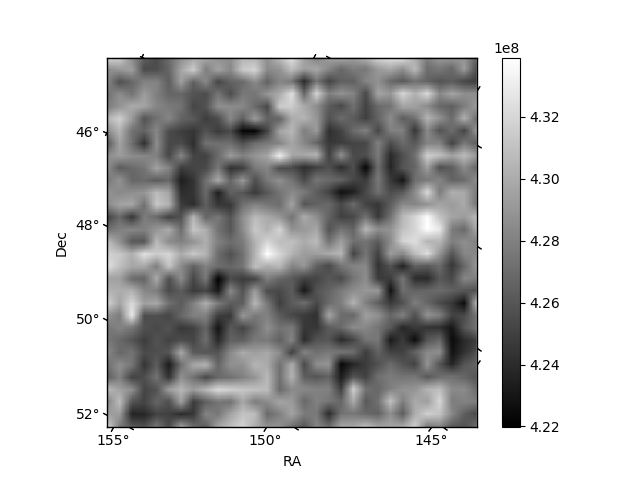
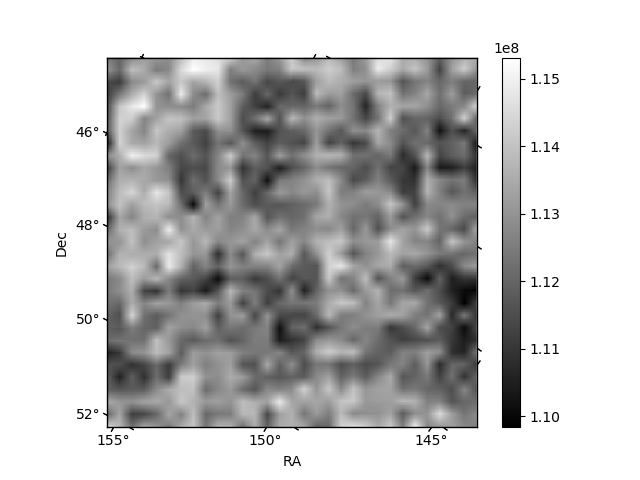
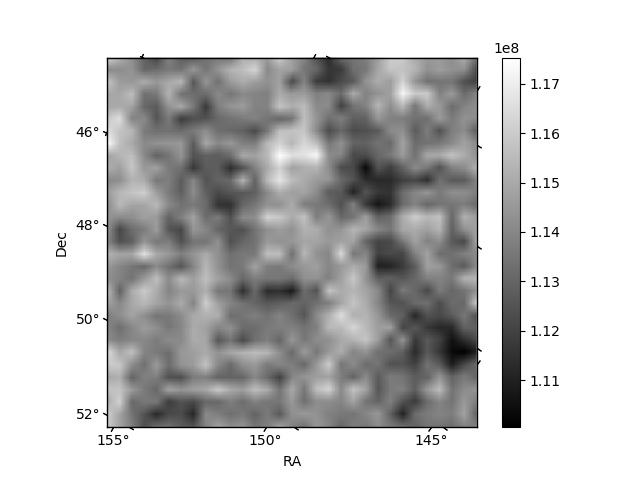
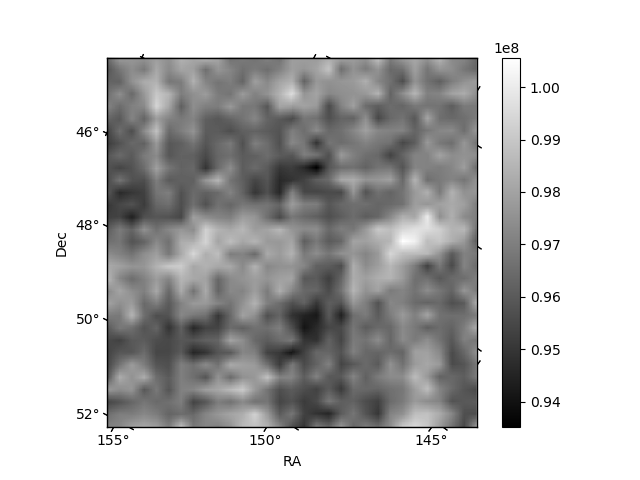
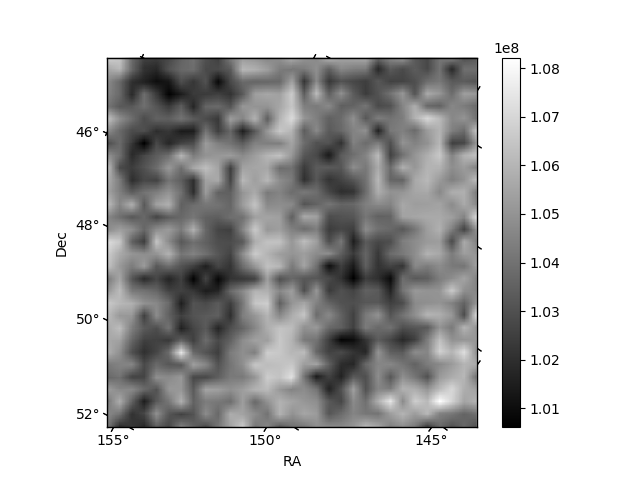
Histogram calculated using DETX and DETY for each event in the final _common_clean file
| Quadrant A | 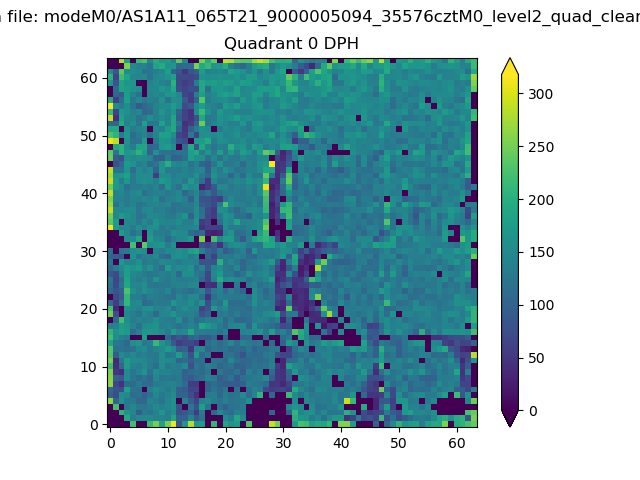 |
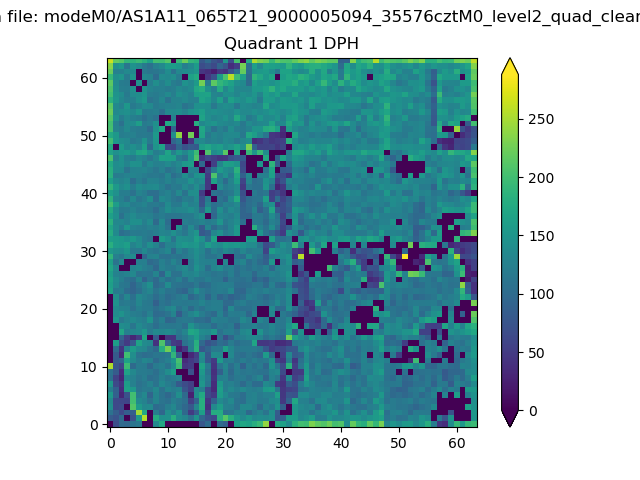 |
Quadrant B |
|---|---|---|---|
| Quadrant D | 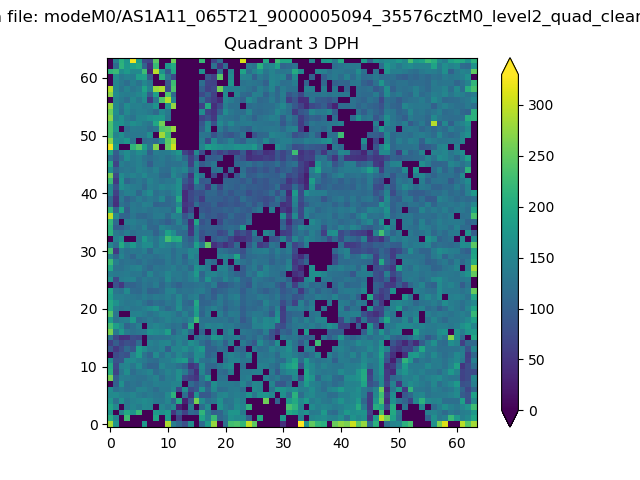 |
 |
Quadrant C |
| Plot type | Count rate plots | Images |
|---|---|---|
| Comparison with Poisson distribution Blue bars denote a histogram of data divided into 1 sec bins. Red curve is a Poisson curve with rate = median count rate of data. |
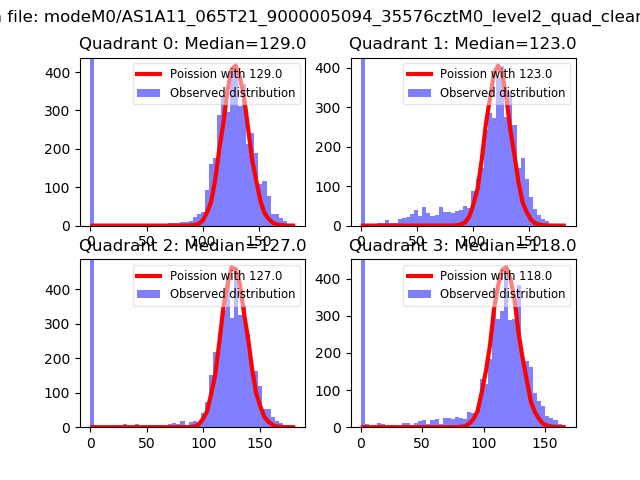 |
 |
| Quadrant-wise count rates Data is divided into 100 sec bins |
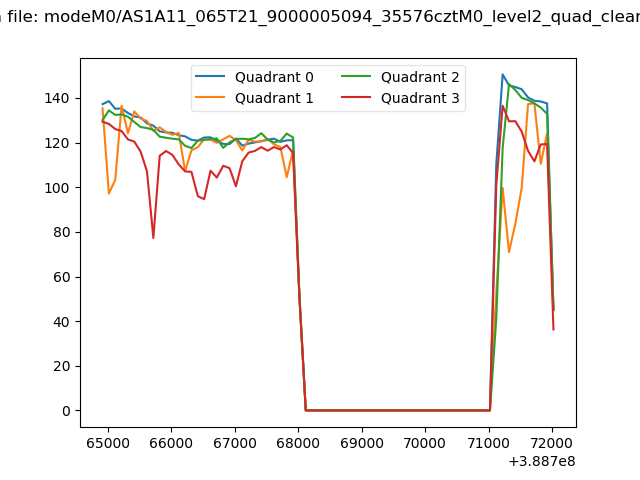 |
|
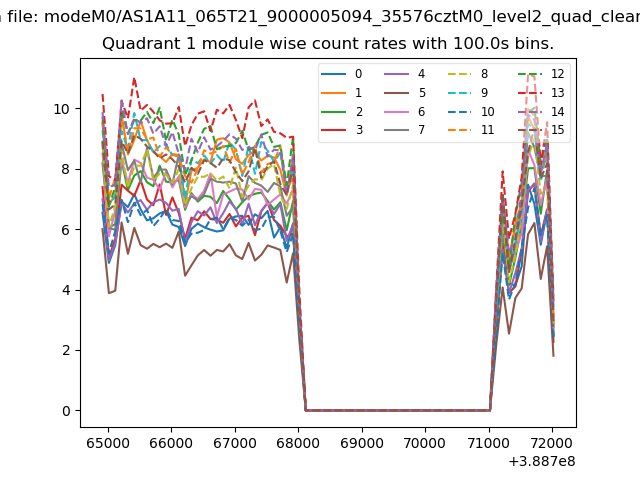
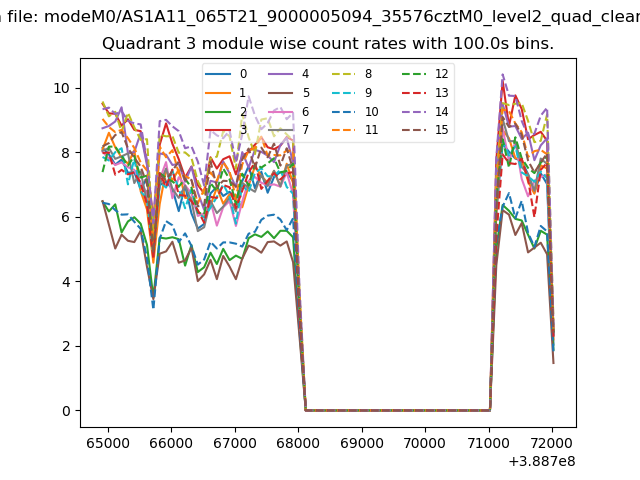
| Module-wise count rates for Quadrant A Data is divided into 100 sec bins |
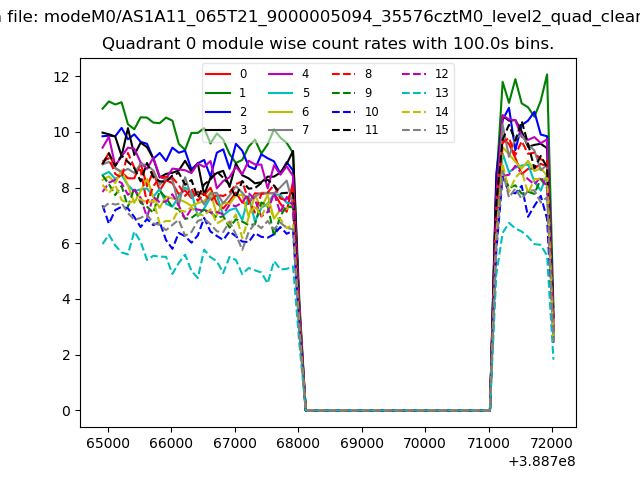 |
 |
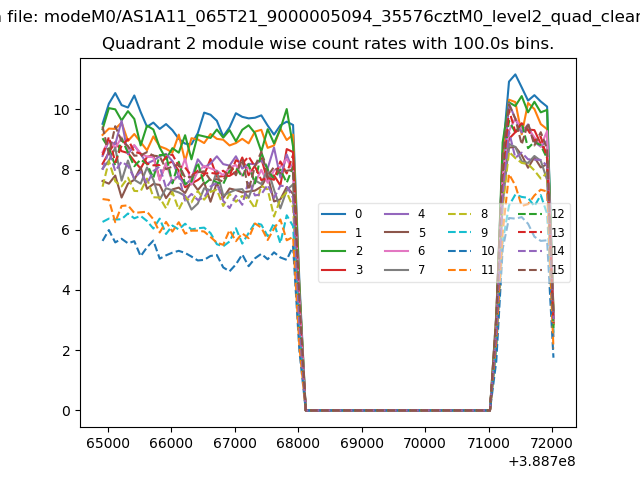
| Module-wise count rates for Quadrant B Data is divided into 100 sec bins |
 |
 |
| Module-wise count rates for Quadrant C Data is divided into 100 sec bins |
 |
 |
| Module-wise count rates for Quadrant D Data is divided into 100 sec bins |
 |
 |
| Parameter | Plot |
|---|---|
| CZT HV Monitor | 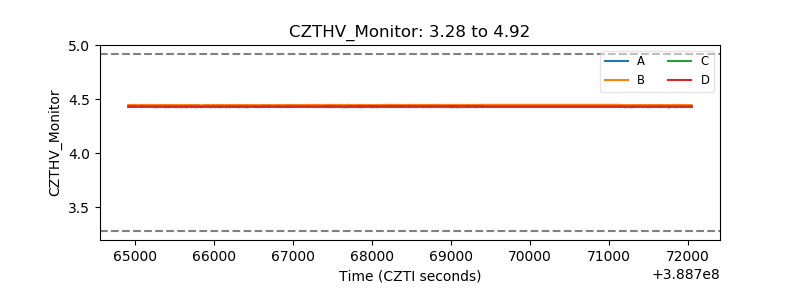 |
| D_VDD | 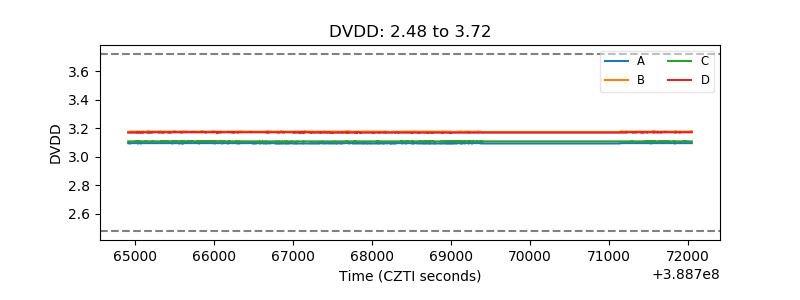 |
| Temperature 1 | 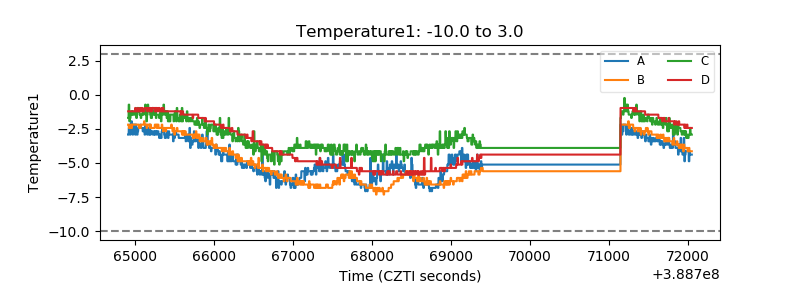 |
| Veto HV Monitor | 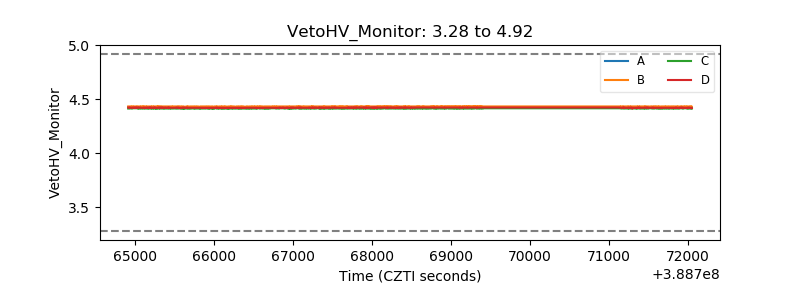 |
| Veto LLD | 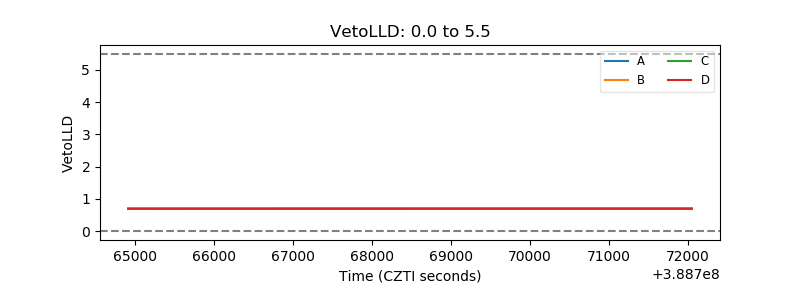 |
| Alpha Counter | 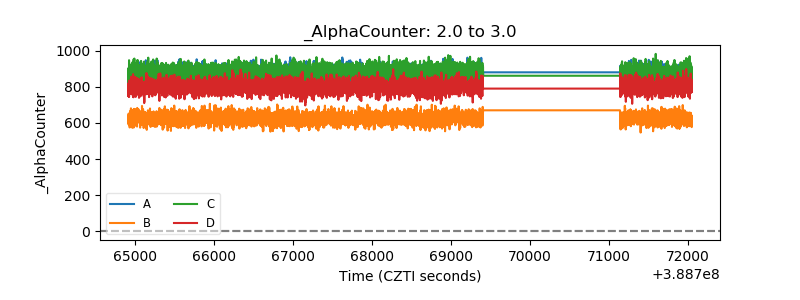 |
| _CPM_Rate | 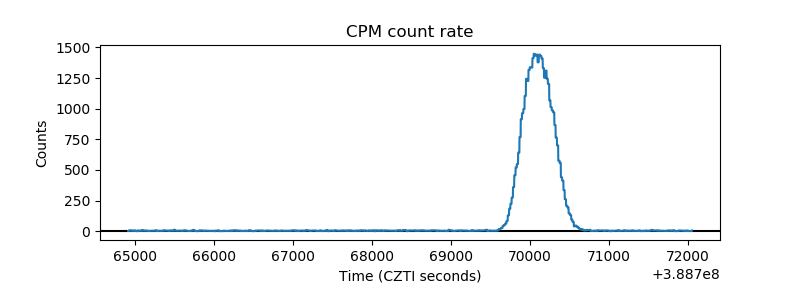 |
| CZT Counter | 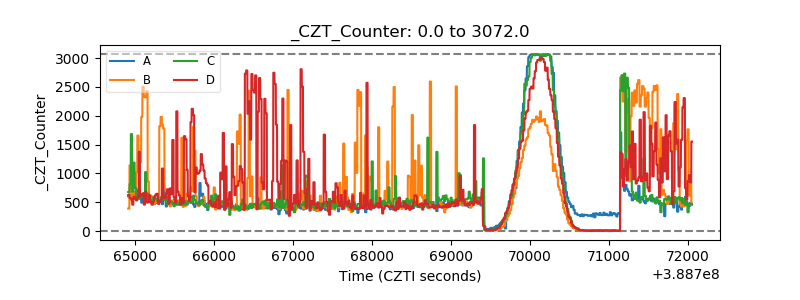 |
| +2.5 Volts monitor | 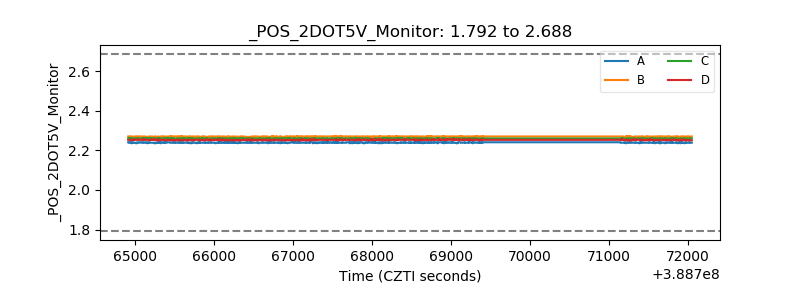 |
| +5 Volts monitor | 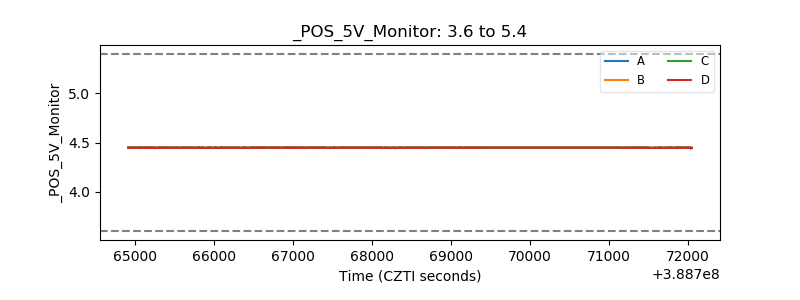 |
| _ROLL_ROT | 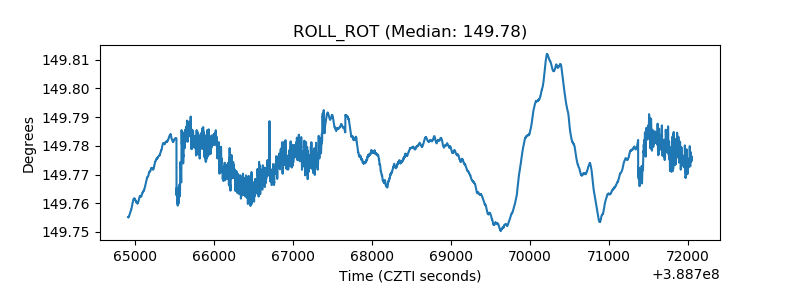 |
| _Roll_DEC | 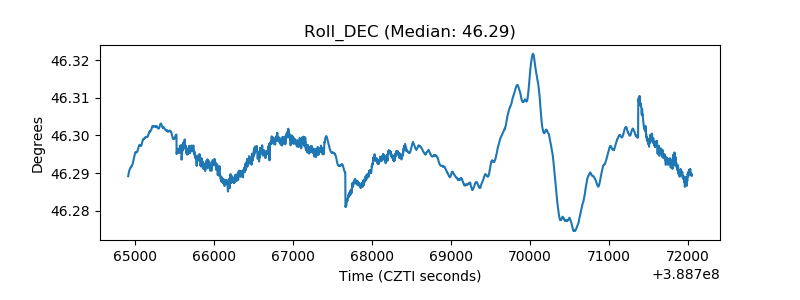 |
| _Roll_RA | 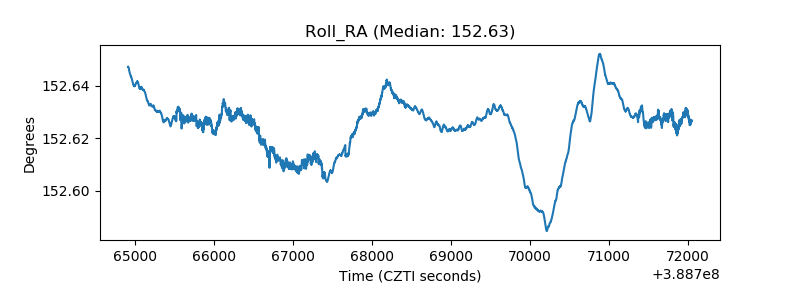 |
| Veto Counter | 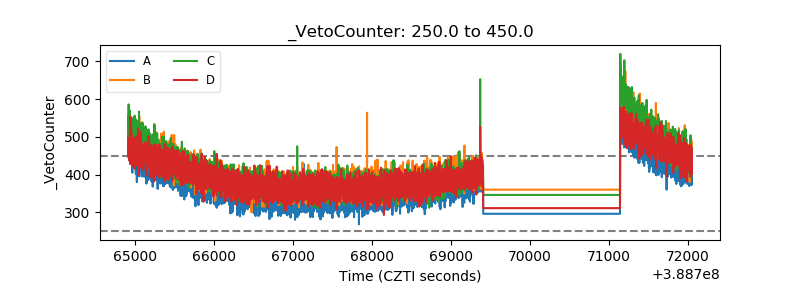 |