| Param | Original file | Final file |
|---|---|---|
| Filename | modeM0/AS1A11_065T21_9000005094_35575cztM0_level2.evt | modeM0/AS1A11_065T21_9000005094_35575cztM0_level2_quad_clean.evt |
| Size (bytes) | 467,055,360 | 79,583,040 |
| Size | 445.4 MB | 75.9 MB |
| Events in quadrant A | 2,669,555 | 524,403 |
| Events in quadrant B | 4,339,044 | 505,369 |
| Events in quadrant C | 2,851,806 | 523,828 |
| Events in quadrant D | 3,920,983 | 481,255 |
| Mode M0 | |||
|---|---|---|---|
| Quadrant | BADHDUFLAG | Total packets | Discarded packets |
| A | 0 | 11517 | 2 |
| B | 0 | 16491 | 1 |
| C | 0 | 11711 | 1 |
| D | 0 | 15124 | 1 |
| Mode M9 | |||
|---|---|---|---|
| Quadrant | BADHDUFLAG | Total packets | Discarded packets |
| A | 0 | 16 | 0 |
| B | 0 | 16 | 0 |
| C | 0 | 16 | 0 |
| D | 0 | 16 | 0 |
| Mode SS | |||
|---|---|---|---|
| Quadrant | BADHDUFLAG | Total packets | Discarded packets |
| A | 0 | 110 | 0 |
| B | 0 | 110 | 0 |
| C | 0 | 110 | 0 |
| D | 0 | 110 | 0 |
| Quadrant | Total seconds | Saturated seconds | Saturation percentage |
|---|---|---|---|
| A | 5348 | 78 | 1.458489% |
| B | 5348 | 610 | 11.406133% |
| C | 5348 | 43 | 0.804039% |
| D | 5348 | 349 | 6.525804% |
Noise dominated data is calculated using 1-second bins in cleaned event files. If a bin has >2000 counts, and if more than 50% of those come from <1% of pixels, then it is considered to be noise-dominated and hence unusable.
| Quadrant | # 1 sec bins | Bins with >0 counts | Bins with >2000 counts | High rate bins dominated by noise | Noise dominated (total time) | Noise dominated (detector-on time) | Marked lightcurve |
|---|---|---|---|---|---|---|---|
| A | 6961 | 5349 | 60 | 60 | 0.86% | 1.12% | 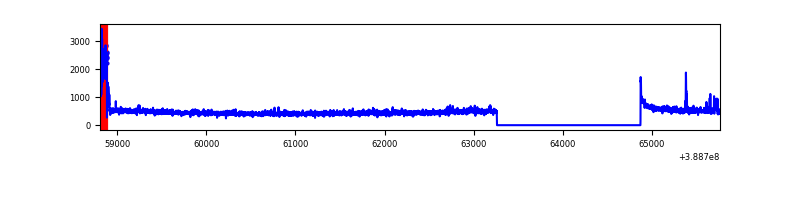 |
| B | 6961 | 5349 | 392 | 392 | 5.63% | 7.33% | 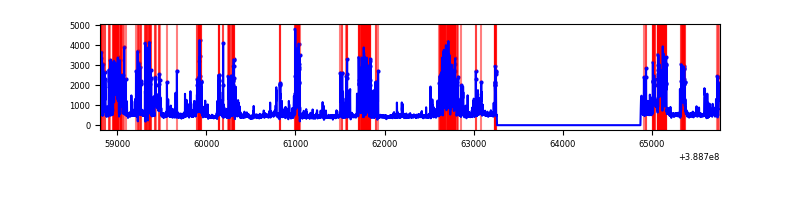 |
| C | 6961 | 5349 | 21 | 21 | 0.30% | 0.39% | 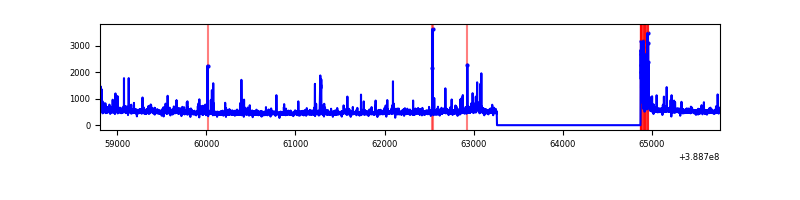 |
| D | 6961 | 5349 | 310 | 310 | 4.45% | 5.80% | 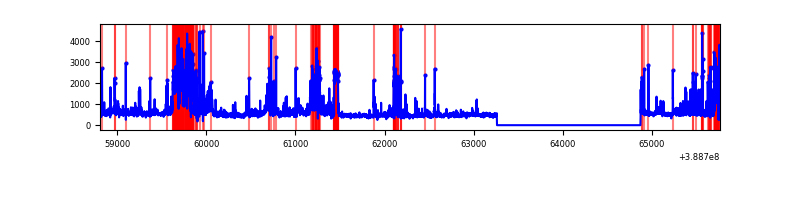 |
Top three noisy pixels from each quadrant. If the there are fewer than three noisy pixels in the level2.evt file, extra rows are filled as -1
| Pixel properties | Quadrant properties | ||||||
|---|---|---|---|---|---|---|---|
| Quadrant | DetID | PixID | Counts | Sigma | Mean | Median | Sigma |
| A | 15 | 169 | 176287 | 1450.64 | 601 | 587 | 121.1 |
| A | 10 | 83 | 110211 | 905.09 | 601 | 587 | 121.1 |
| A | 7 | 3 | 29377 | 237.7 | 601 | 587 | 121.1 |
| B | 5 | 172 | 1672824 | 15072.7 | 575 | 558 | 110.9 |
| B | 5 | 200 | 196555 | 1766.59 | 575 | 558 | 110.9 |
| B | 4 | 81 | 75341 | 674.04 | 575 | 558 | 110.9 |
| C | 15 | 214 | 219210 | 1584.67 | 594 | 596 | 138.0 |
| C | 0 | 10 | 154943 | 1118.82 | 594 | 596 | 138.0 |
| C | 9 | 187 | 122728 | 885.3 | 594 | 596 | 138.0 |
| D | 7 | 80 | 414525 | 2909.11 | 578 | 562 | 142.3 |
| D | 8 | 195 | 267954 | 1879.09 | 578 | 562 | 142.3 |
| D | 10 | 118 | 241049 | 1690.01 | 578 | 562 | 142.3 |
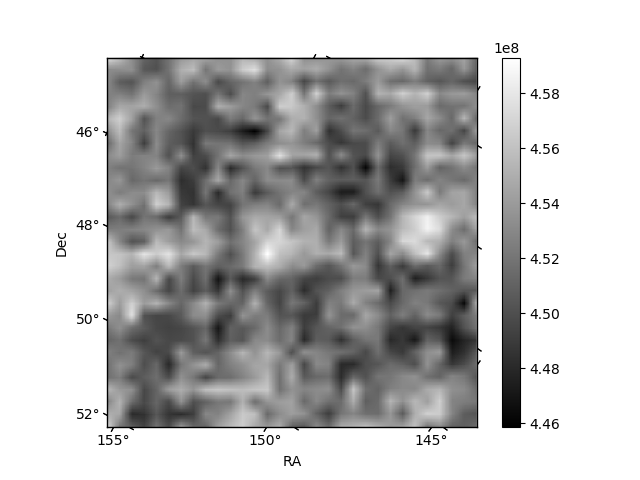
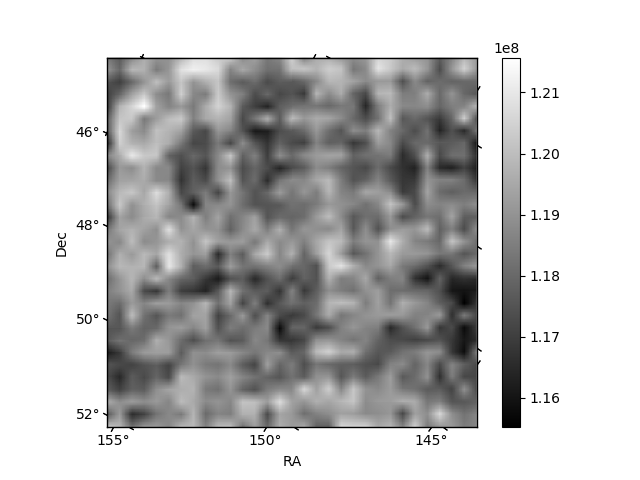
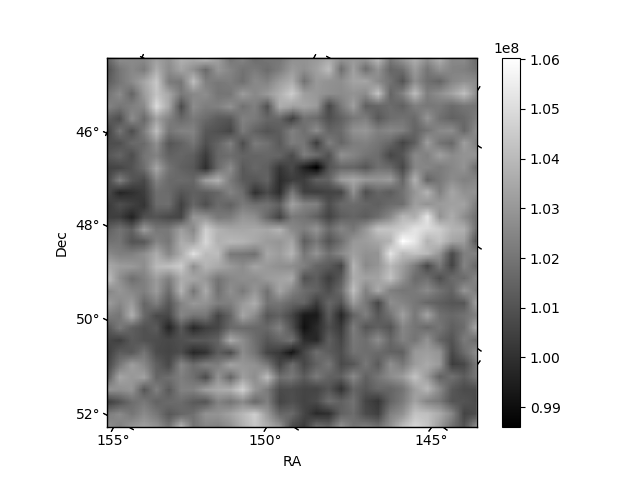
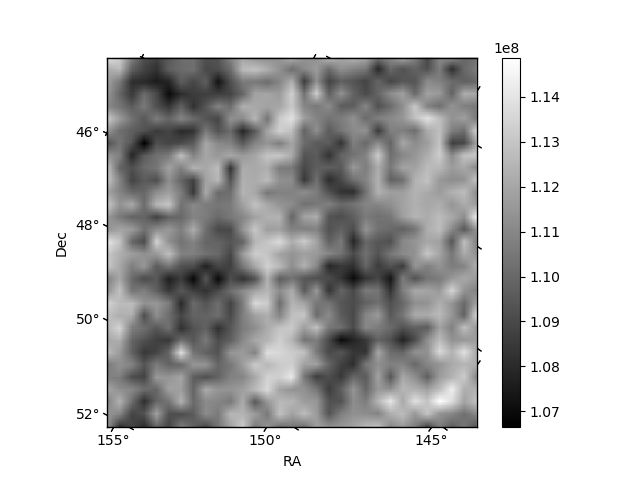
Histogram calculated using DETX and DETY for each event in the final _common_clean file
| Quadrant A | 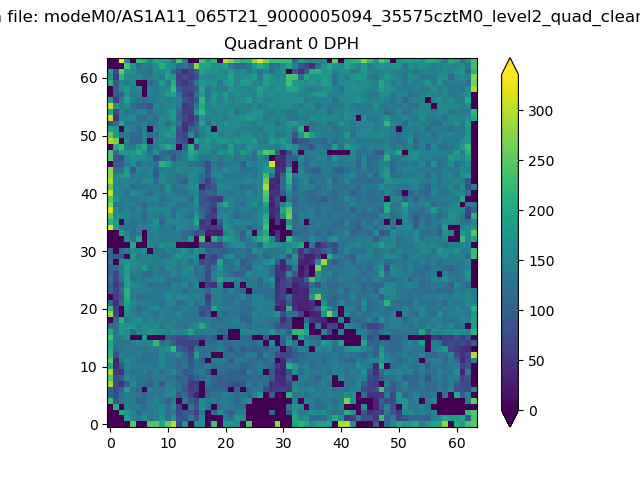 |
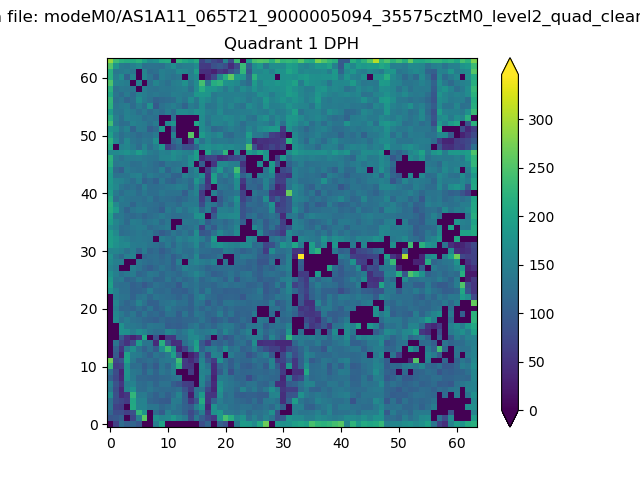 |
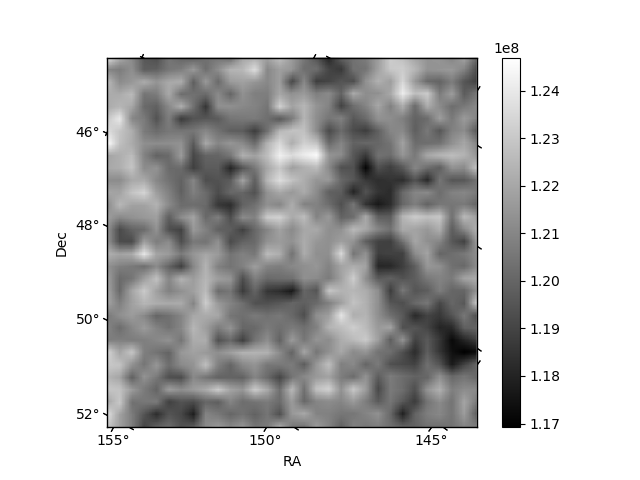
Quadrant B |
|---|---|---|---|
| Quadrant D | 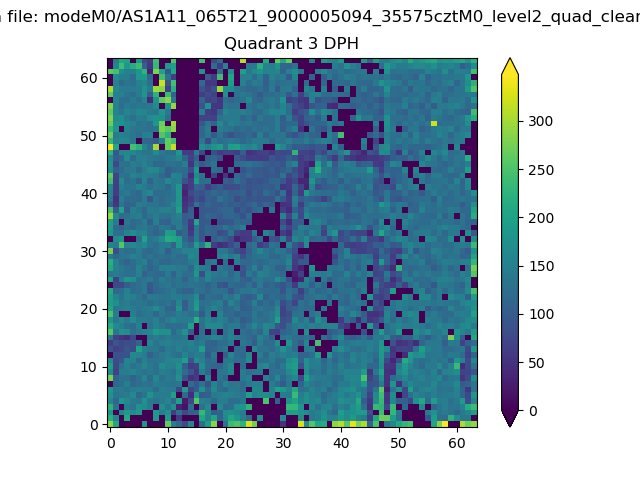 |
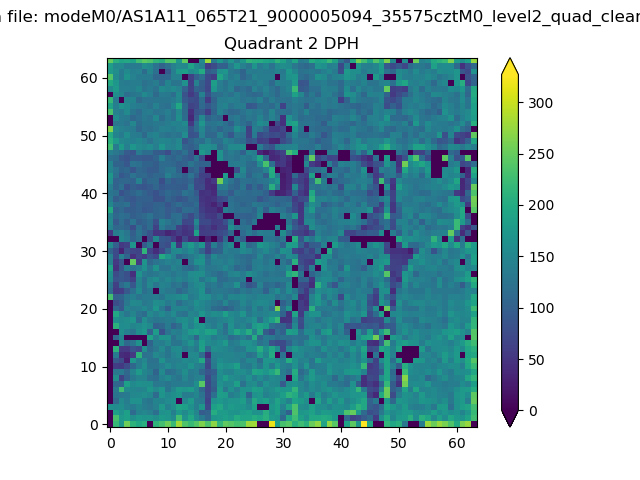 |
Quadrant C |
| Plot type | Count rate plots | Images |
|---|---|---|
| Comparison with Poisson distribution Blue bars denote a histogram of data divided into 1 sec bins. Red curve is a Poisson curve with rate = median count rate of data. |
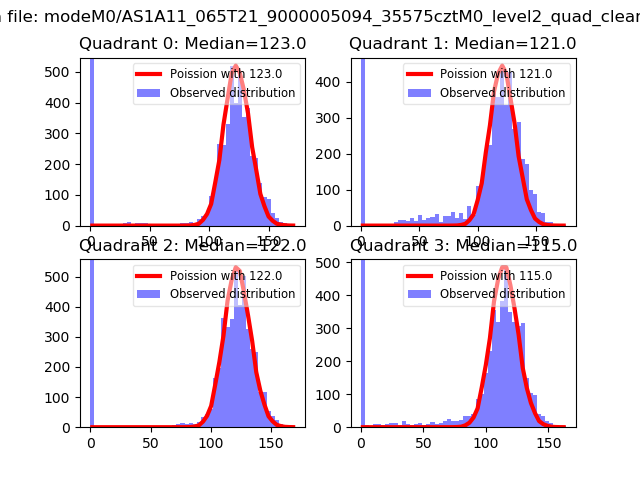 |
 |
| Quadrant-wise count rates Data is divided into 100 sec bins |
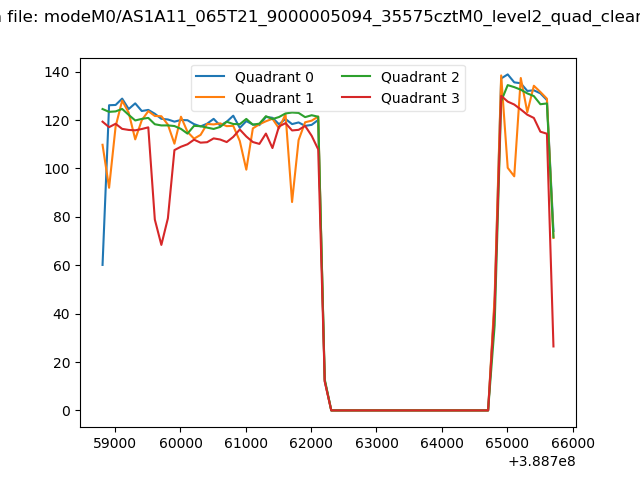 |
|
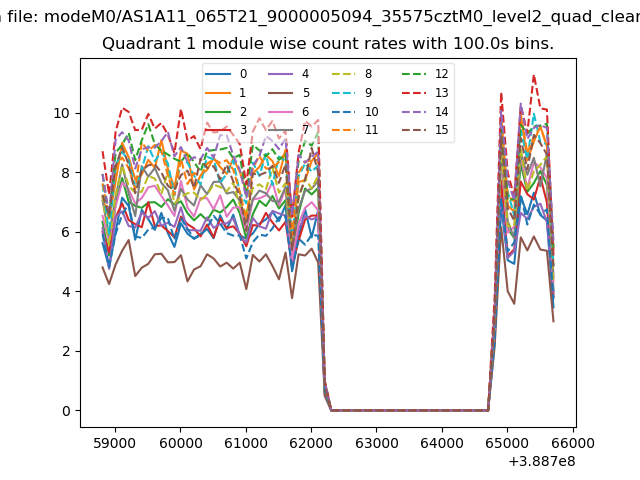
| Module-wise count rates for Quadrant A Data is divided into 100 sec bins |
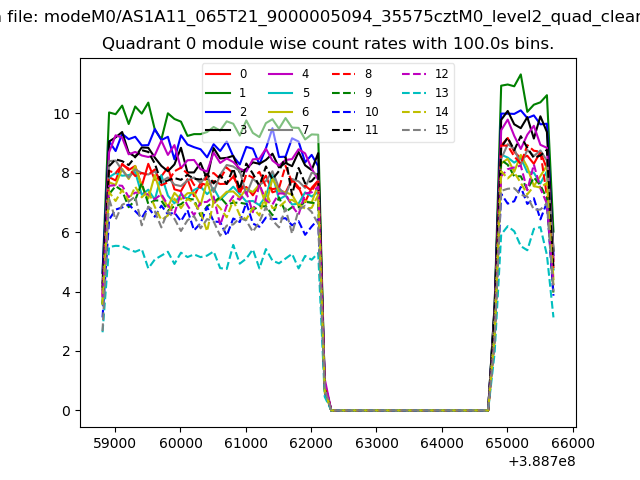 |
 |
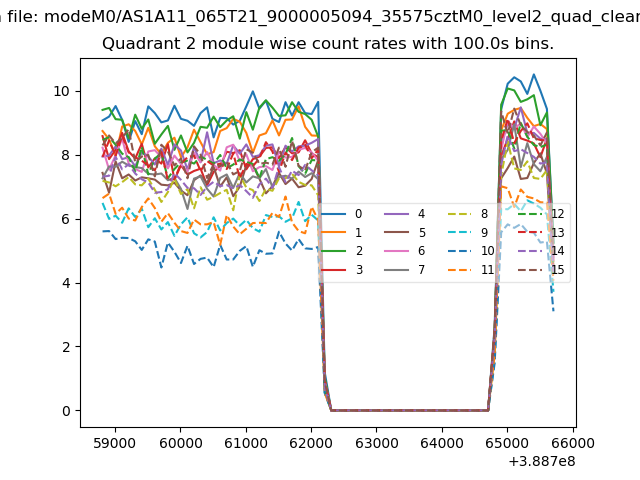
| Module-wise count rates for Quadrant B Data is divided into 100 sec bins |
 |
 |
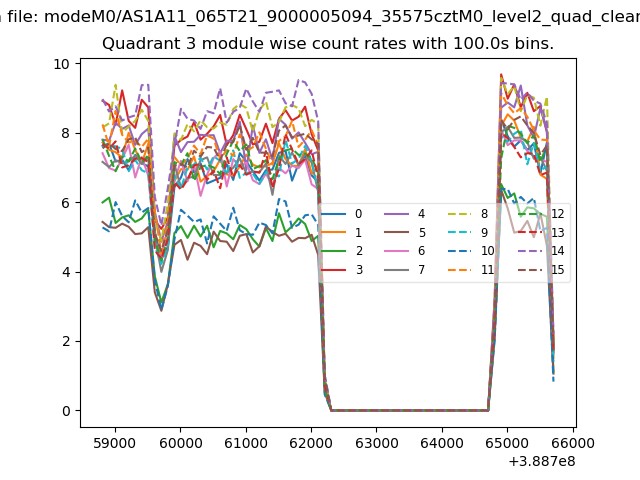
| Module-wise count rates for Quadrant C Data is divided into 100 sec bins |
 |
 |
| Module-wise count rates for Quadrant D Data is divided into 100 sec bins |
 |
 |
| Parameter | Plot |
|---|---|
| CZT HV Monitor | 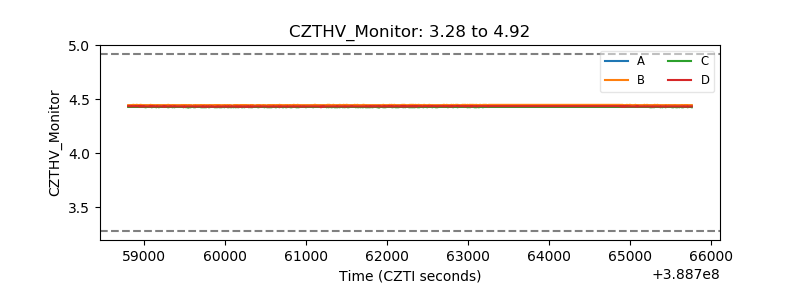 |
| D_VDD | 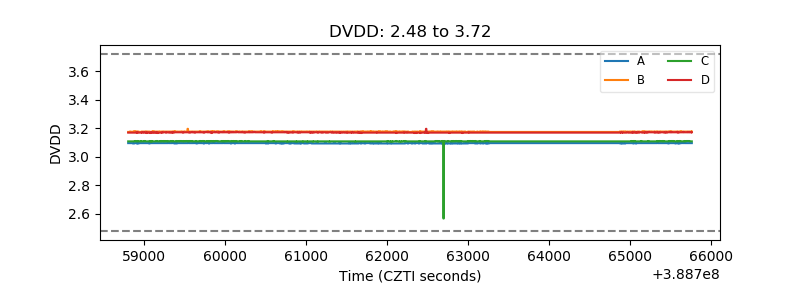 |
| Temperature 1 | 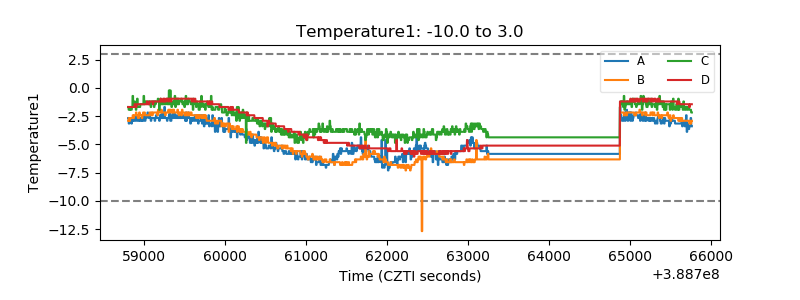 |
| Veto HV Monitor | 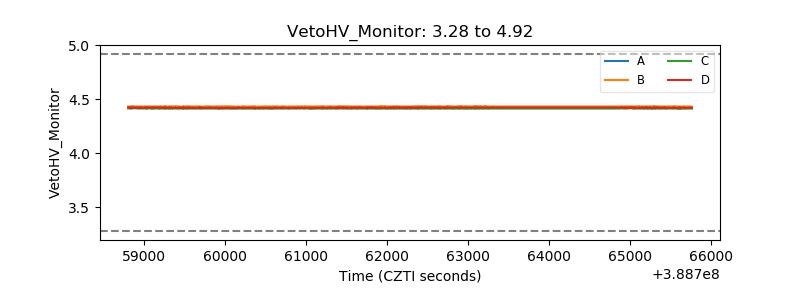 |
| Veto LLD | 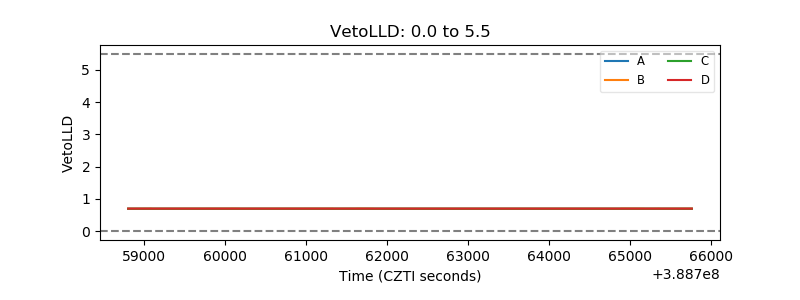 |
| Alpha Counter | 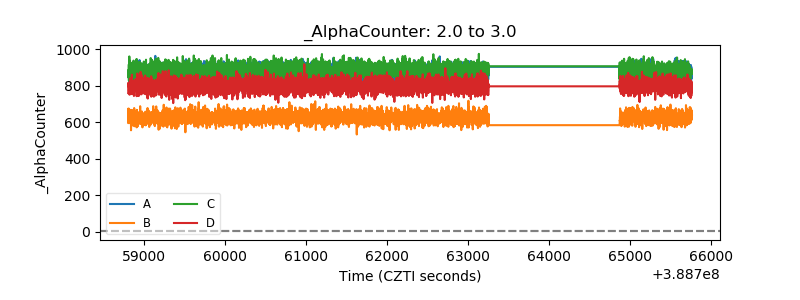 |
| _CPM_Rate | 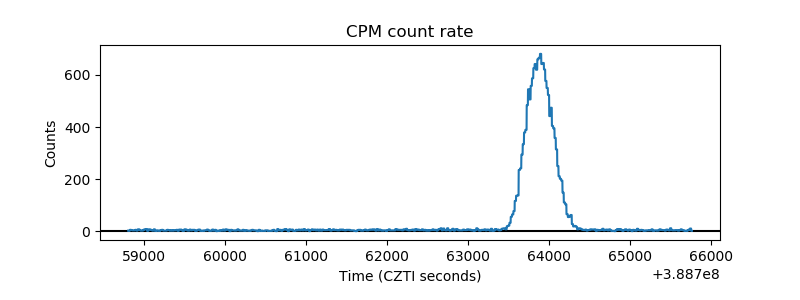 |
| CZT Counter | 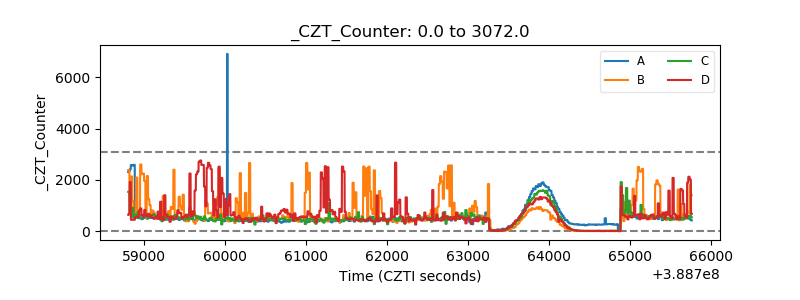 |
| +2.5 Volts monitor | 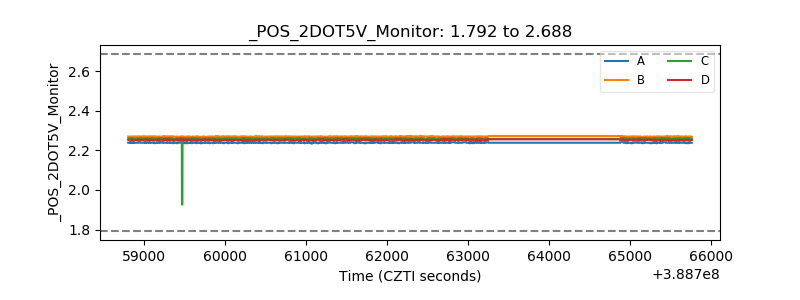 |
| +5 Volts monitor | 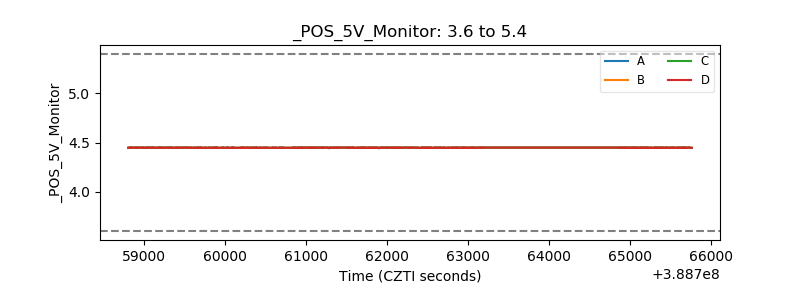 |
| _ROLL_ROT | 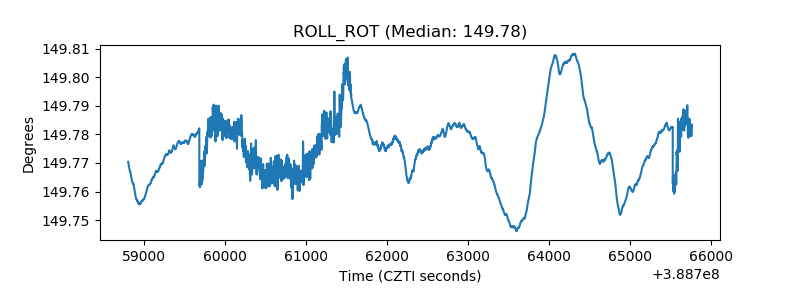 |
| _Roll_DEC | 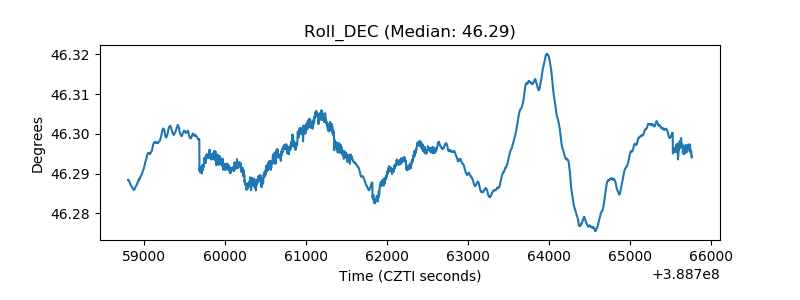 |
| _Roll_RA | 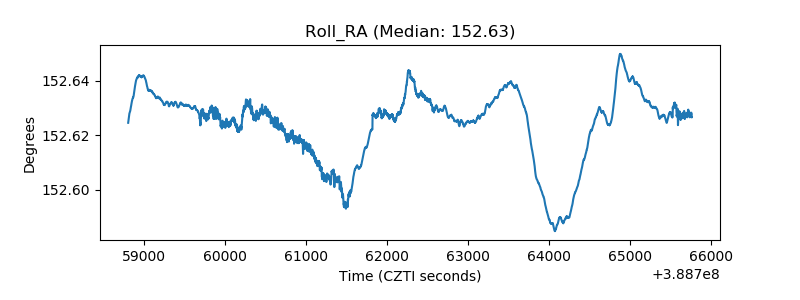 |
| Veto Counter | 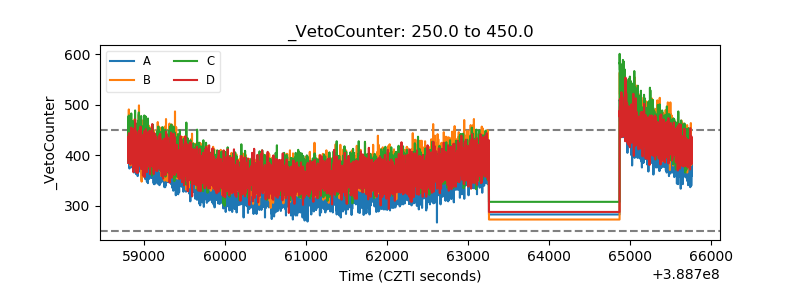 |