| Param | Original file | Final file |
|---|---|---|
| Filename | modeM0/AS1A11_065T21_9000005094cztM0_level2_bc.evt | modeM0/AS1A11_065T21_9000005094cztM0_level2_quad_clean.evt |
| Size (bytes) | 759,559,680 | 232,064,640 |
| Size | 724.4 MB | 221.3 MB |
| Events in quadrant A | 3,639,536 | 1,518,914 |
| Events in quadrant B | 6,513,378 | 1,465,593 |
| Events in quadrant C | 4,966,277 | 1,515,910 |
| Events in quadrant D | 6,781,194 | 1,416,491 |
| Mode M0 | |||
|---|---|---|---|
| Quadrant | BADHDUFLAG | Total packets | Discarded packets |
| A | 0 | 35094 | 0 |
| B | 0 | 46961 | 0 |
| C | 0 | 37169 | 0 |
| D | 0 | 44869 | 0 |
| Mode M9 | |||
|---|---|---|---|
| Quadrant | BADHDUFLAG | Total packets | Discarded packets |
| A | 0 | 62 | 0 |
| B | 0 | 62 | 0 |
| C | 0 | 62 | 0 |
| D | 0 | 62 | 0 |
| Mode SS | |||
|---|---|---|---|
| Quadrant | BADHDUFLAG | Total packets | Discarded packets |
| A | 0 | 330 | 0 |
| B | 0 | 330 | 0 |
| C | 0 | 330 | 0 |
| D | 0 | 330 | 0 |
| Quadrant | Total seconds | Saturated seconds | Saturation percentage |
|---|---|---|---|
| A | 16108 | 360 | 2.234914% |
| B | 16108 | 1700 | 10.553762% |
| C | 16108 | 310 | 1.924510% |
| D | 16108 | 878 | 5.450708% |
Noise dominated data is calculated using 1-second bins in cleaned event files. If a bin has >2000 counts, and if more than 50% of those come from <1% of pixels, then it is considered to be noise-dominated and hence unusable.
| Quadrant | # 1 sec bins | Bins with >0 counts | Bins with >2000 counts | High rate bins dominated by noise | Noise dominated (total time) | Noise dominated (detector-on time) | Marked lightcurve |
|---|---|---|---|---|---|---|---|
| A | 22289 | 16111 | 0 | 0 | 0.00% | 0.00% | 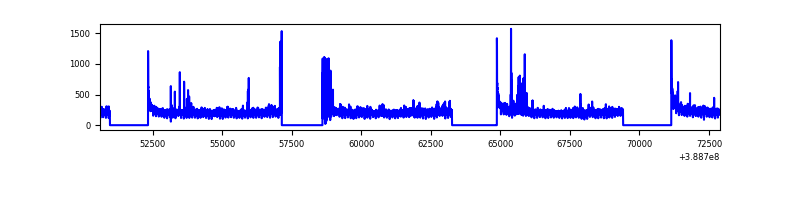 |
| B | 22289 | 16108 | 88 | 88 | 0.39% | 0.55% | 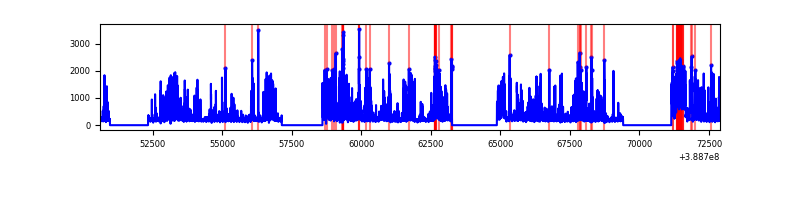 |
| C | 22289 | 16108 | 42 | 42 | 0.19% | 0.26% | 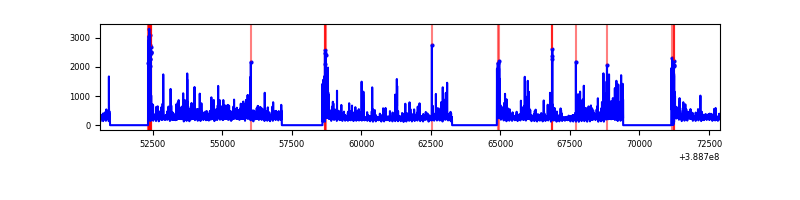 |
| D | 22289 | 16108 | 194 | 194 | 0.87% | 1.20% | 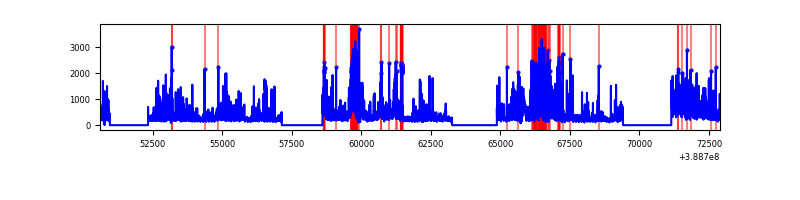 |
Top three noisy pixels from each quadrant. If the there are fewer than three noisy pixels in the level2.evt file, extra rows are filled as -1
| Pixel properties | Quadrant properties | ||||||
|---|---|---|---|---|---|---|---|
| Quadrant | DetID | PixID | Counts | Sigma | Mean | Median | Sigma |
| A | 10 | 83 | 310882 | 1761.49 | 784 | 770 | 176.1 |
| A | 15 | 169 | 180168 | 1019.01 | 784 | 770 | 176.1 |
| A | 7 | 3 | 47700 | 266.57 | 784 | 770 | 176.1 |
| B | 5 | 172 | 3087077 | 20145.61 | 760 | 743 | 153.2 |
| B | 5 | 200 | 189417 | 1231.54 | 760 | 743 | 153.2 |
| B | 0 | 189 | 91657 | 593.43 | 760 | 743 | 153.2 |
| C | 0 | 10 | 936838 | 5170.55 | 775 | 767 | 181.0 |
| C | 15 | 214 | 622498 | 3434.24 | 775 | 767 | 181.0 |
| C | 9 | 187 | 262683 | 1446.74 | 775 | 767 | 181.0 |
| D | 7 | 80 | 950407 | 5077.01 | 771 | 748 | 187.1 |
| D | 8 | 195 | 596582 | 3185.41 | 771 | 748 | 187.1 |
| D | 10 | 118 | 321204 | 1713.2 | 771 | 748 | 187.1 |
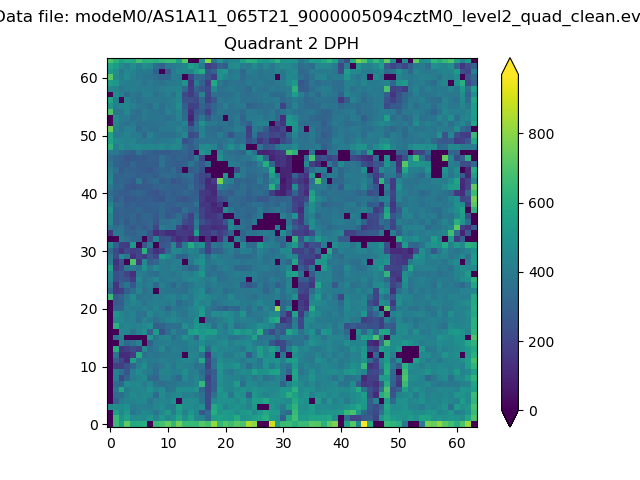
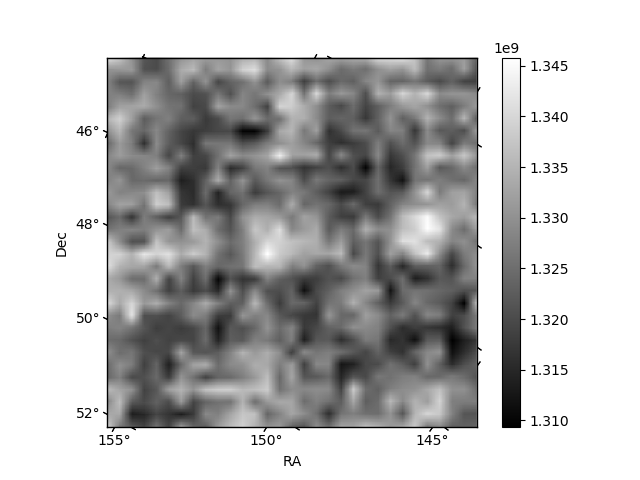
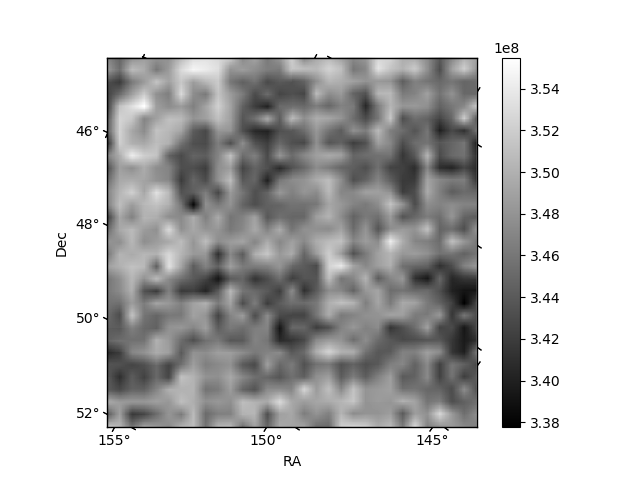
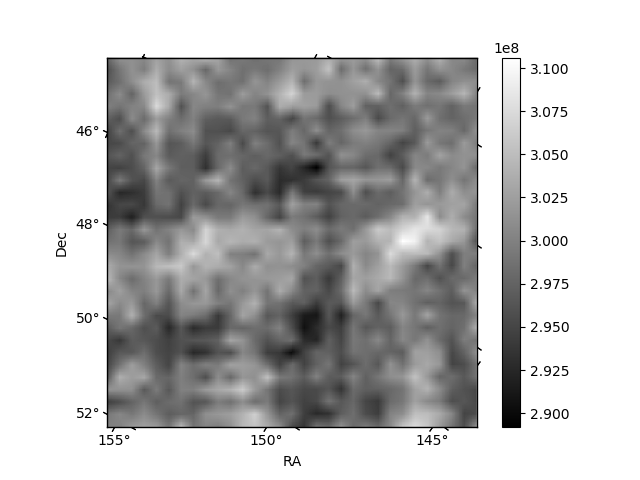
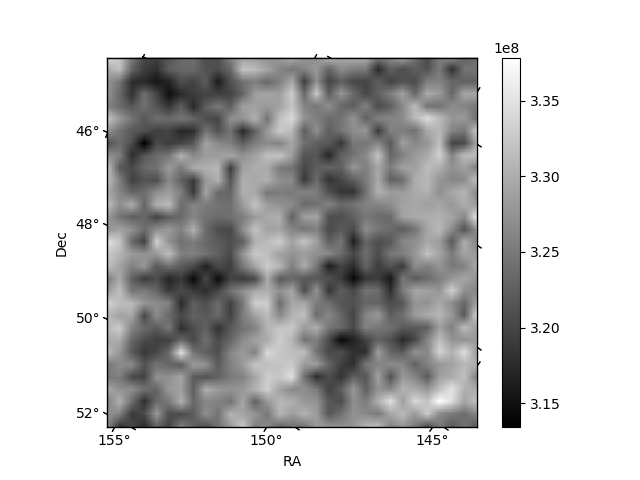
Histogram calculated using DETX and DETY for each event in the final _common_clean file
| Quadrant A | 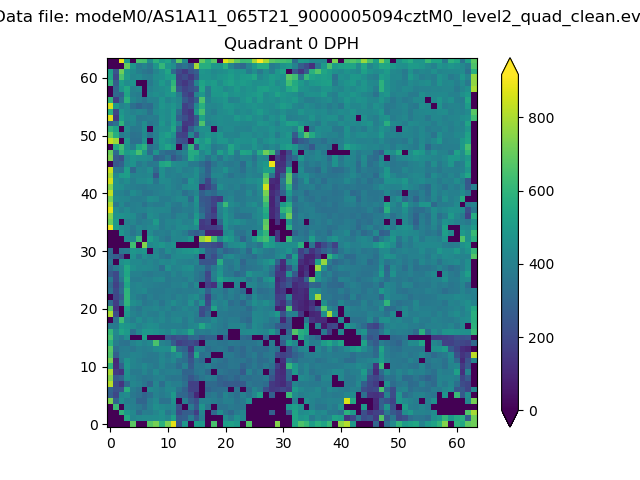 |
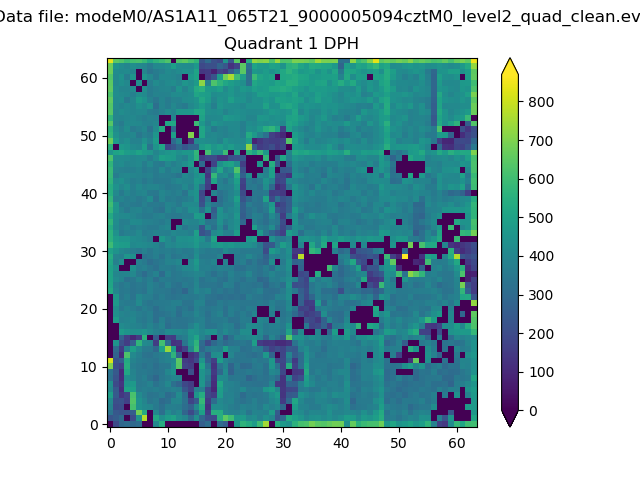 |
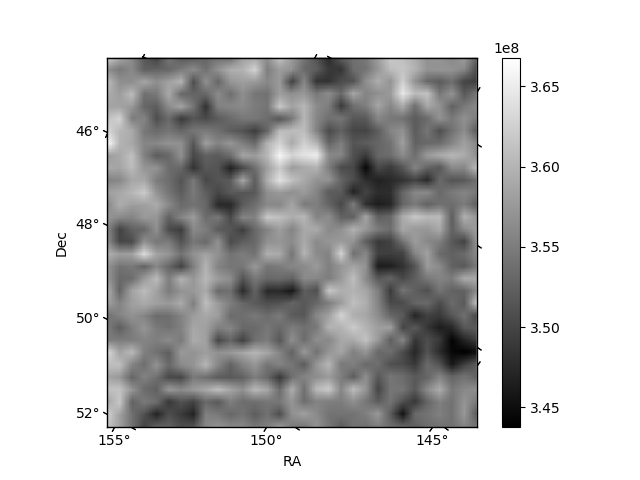
Quadrant B |
|---|---|---|---|
| Quadrant D | 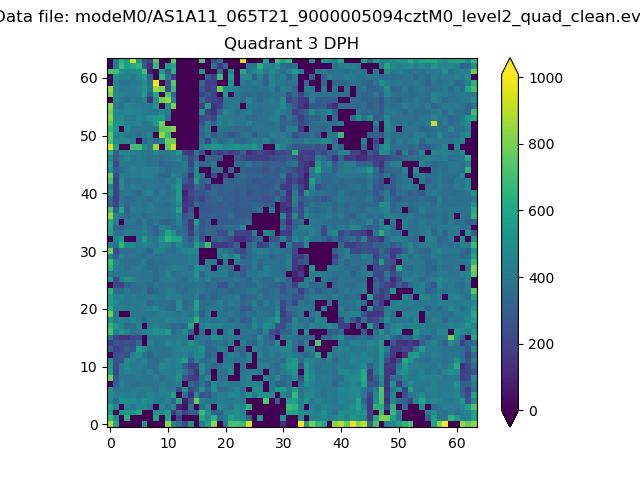 |
 |
Quadrant C |
| Plot type | Count rate plots | Images |
|---|---|---|
| Comparison with Poisson distribution Blue bars denote a histogram of data divided into 1 sec bins. Red curve is a Poisson curve with rate = median count rate of data. |
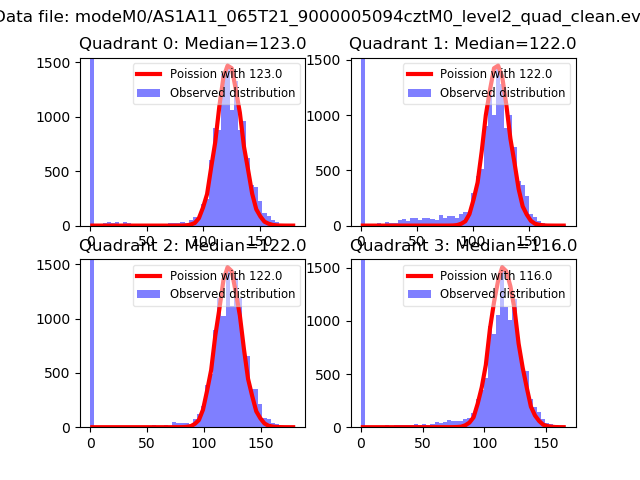 |
 |
| Quadrant-wise count rates Data is divided into 100 sec bins |
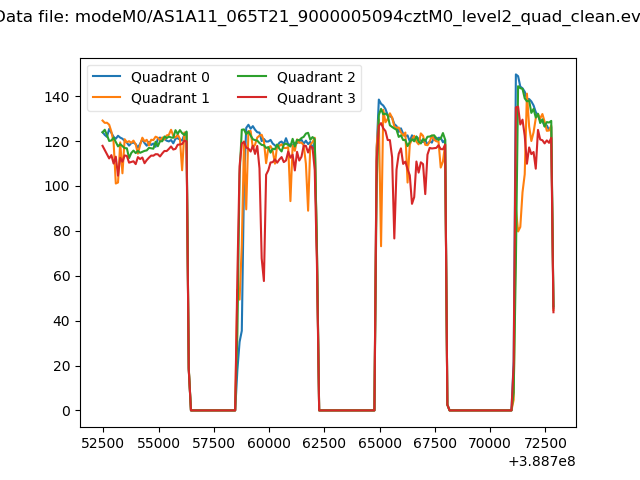 |
|
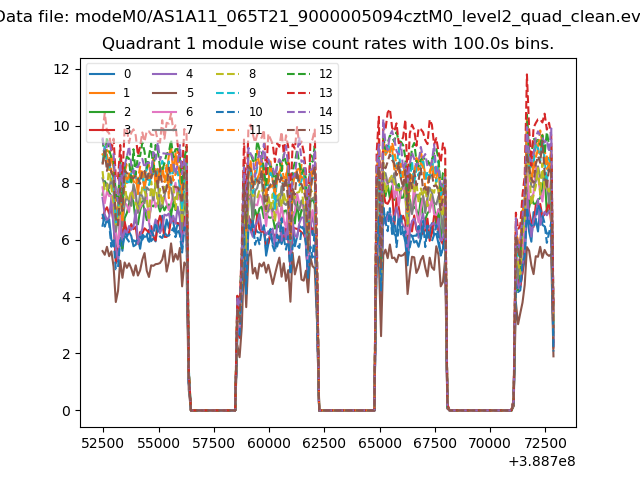
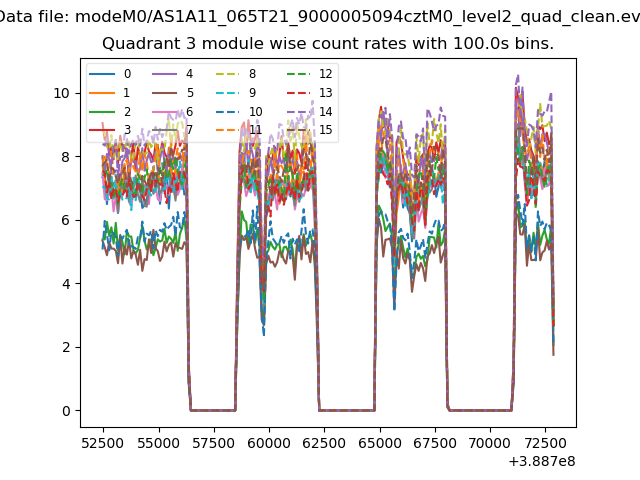
| Module-wise count rates for Quadrant A Data is divided into 100 sec bins |
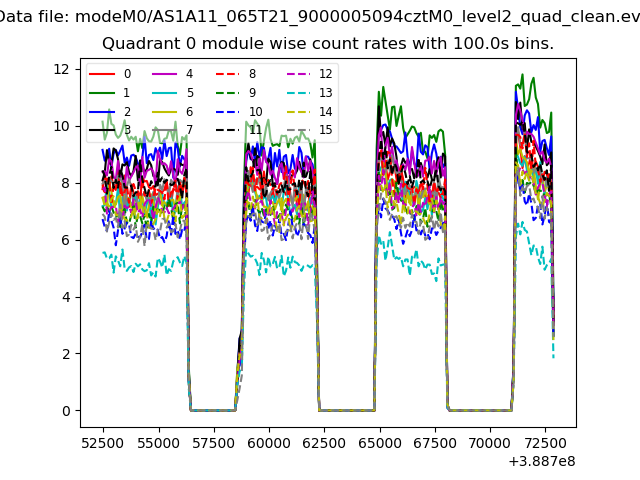 |
 |
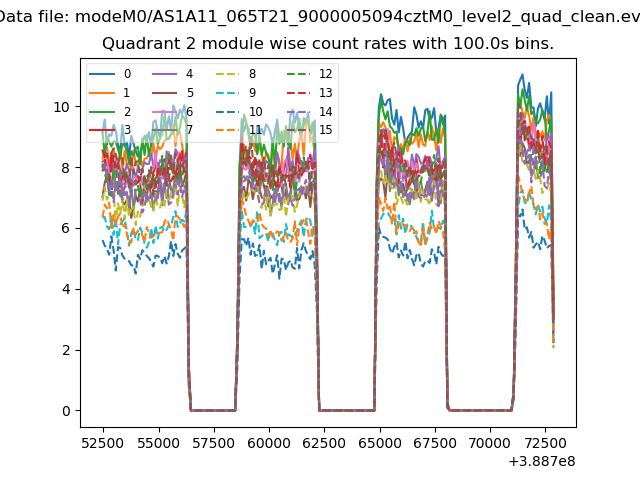
| Module-wise count rates for Quadrant B Data is divided into 100 sec bins |
 |
 |
| Module-wise count rates for Quadrant C Data is divided into 100 sec bins |
 |
 |
| Module-wise count rates for Quadrant D Data is divided into 100 sec bins |
 |
 |
| Parameter | Plot |
|---|---|
| CZT HV Monitor |  |
| D_VDD | 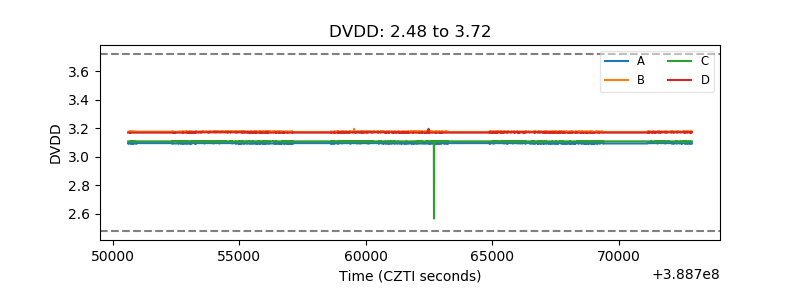 |
| Temperature 1 | 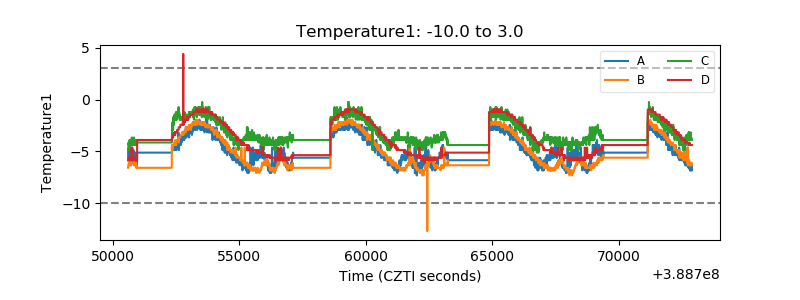 |
| Veto HV Monitor | 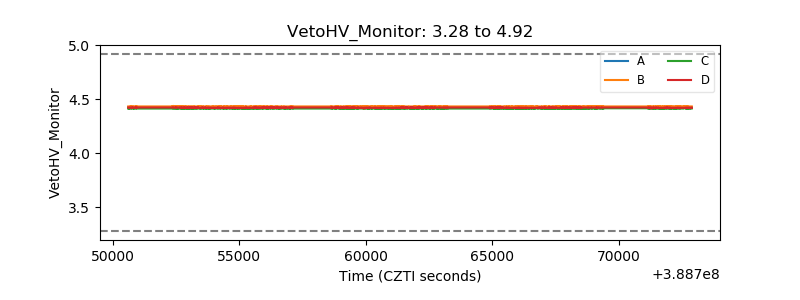 |
| Veto LLD | 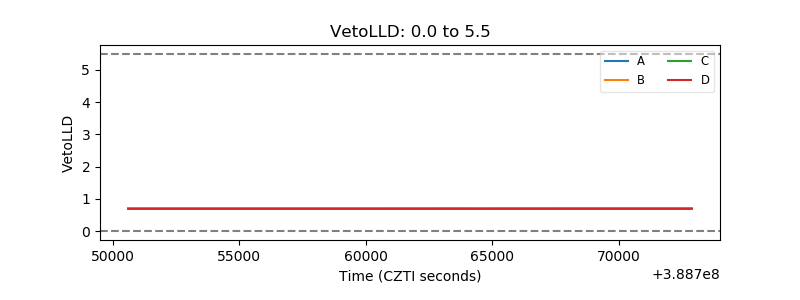 |
| Alpha Counter | 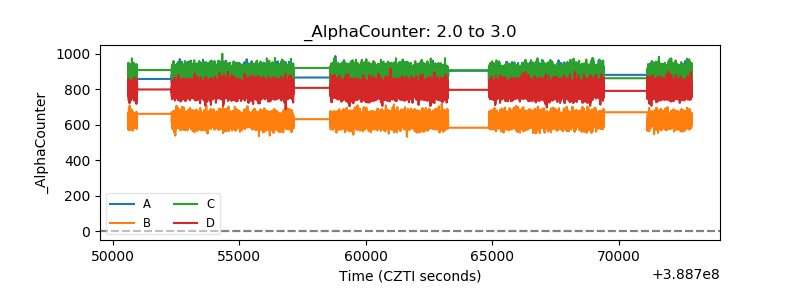 |
| _CPM_Rate | 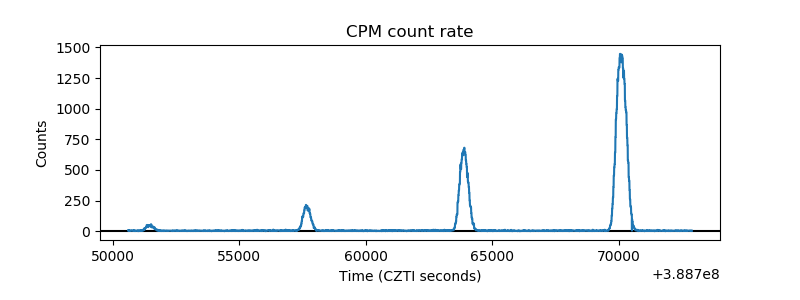 |
| CZT Counter | 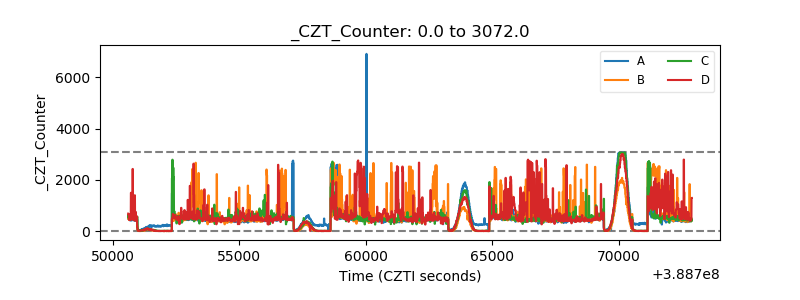 |
| +2.5 Volts monitor | 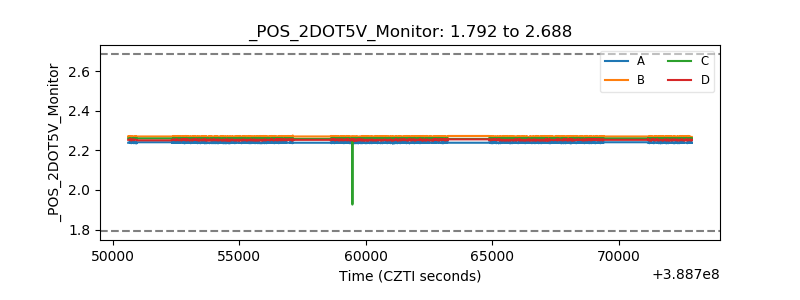 |
| +5 Volts monitor | 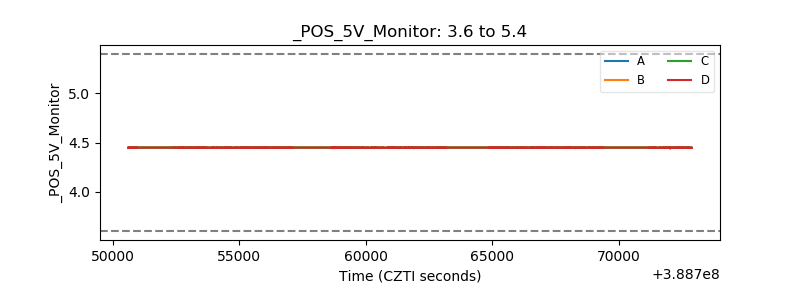 |
| _ROLL_ROT | 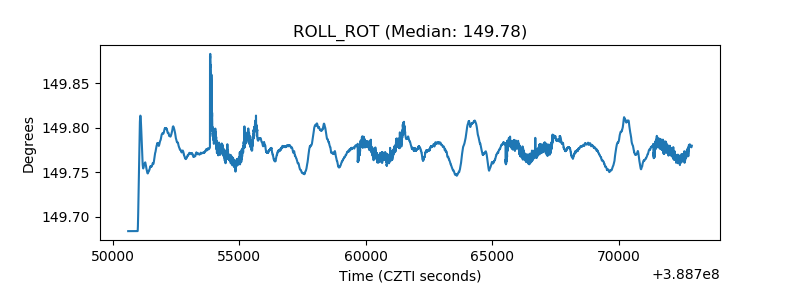 |
| _Roll_DEC | 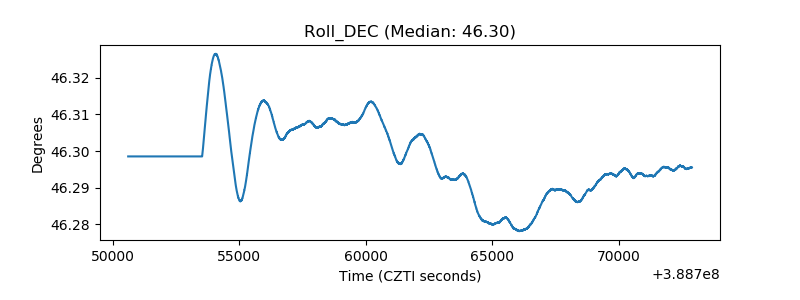 |
| _Roll_RA | 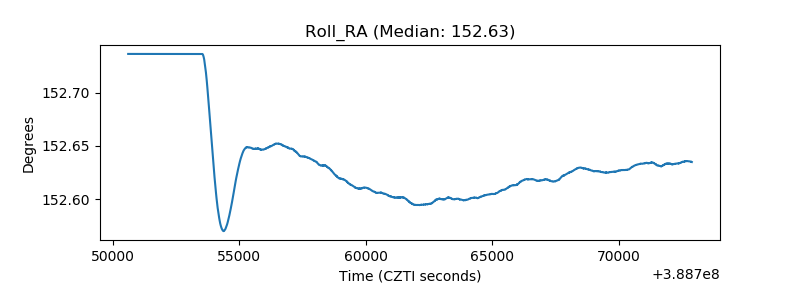 |
| Veto Counter | 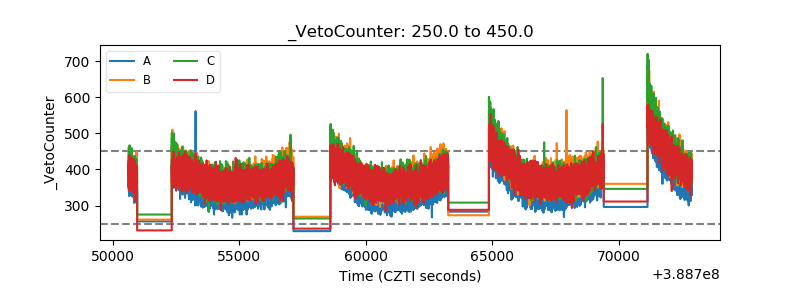 |