| Param | Original file | Final file |
|---|---|---|
| Filename | modeM0/AS1A10_071T01_9000005096_35588cztM0_level2.evt | modeM0/AS1A10_071T01_9000005096_35588cztM0_level2_quad_clean.evt |
| Size (bytes) | 438,295,680 | 82,229,760 |
| Size | 418.0 MB | 78.4 MB |
| Events in quadrant A | 2,869,039 | 528,493 |
| Events in quadrant B | 3,555,775 | 526,890 |
| Events in quadrant C | 3,014,593 | 530,571 |
| Events in quadrant D | 3,447,271 | 505,609 |
| Mode SS | |||
|---|---|---|---|
| Quadrant | BADHDUFLAG | Total packets | Discarded packets |
| A | 0 | 116 | 0 |
| B | 0 | 116 | 0 |
| C | 0 | 116 | 0 |
| D | 0 | 116 | 0 |
| Mode M9 | |||
|---|---|---|---|
| Quadrant | BADHDUFLAG | Total packets | Discarded packets |
| A | 0 | 13 | 0 |
| B | 0 | 13 | 0 |
| C | 0 | 13 | 0 |
| D | 0 | 13 | 0 |
| Mode M0 | |||
|---|---|---|---|
| Quadrant | BADHDUFLAG | Total packets | Discarded packets |
| A | 0 | 11892 | 1 |
| B | 0 | 14220 | 1 |
| C | 0 | 12179 | 1 |
| D | 0 | 13896 | 1 |
| Quadrant | Total seconds | Saturated seconds | Saturation percentage |
|---|---|---|---|
| A | 5698 | 31 | 0.544051% |
| B | 5698 | 265 | 4.650755% |
| C | 5698 | 69 | 1.210951% |
| D | 5698 | 100 | 1.755002% |
Noise dominated data is calculated using 1-second bins in cleaned event files. If a bin has >2000 counts, and if more than 50% of those come from <1% of pixels, then it is considered to be noise-dominated and hence unusable.
| Quadrant | # 1 sec bins | Bins with >0 counts | Bins with >2000 counts | High rate bins dominated by noise | Noise dominated (total time) | Noise dominated (detector-on time) | Marked lightcurve |
|---|---|---|---|---|---|---|---|
| A | 6982 | 5699 | 21 | 21 | 0.30% | 0.37% | 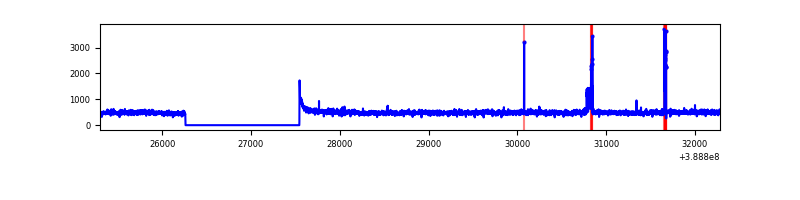 |
| B | 6982 | 5699 | 173 | 173 | 2.48% | 3.04% | 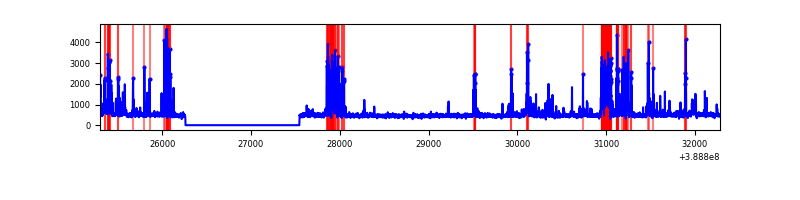 |
| C | 6982 | 5699 | 60 | 60 | 0.86% | 1.05% | 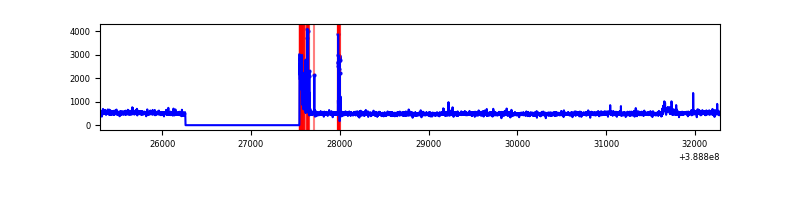 |
| D | 6982 | 5699 | 80 | 80 | 1.15% | 1.40% | 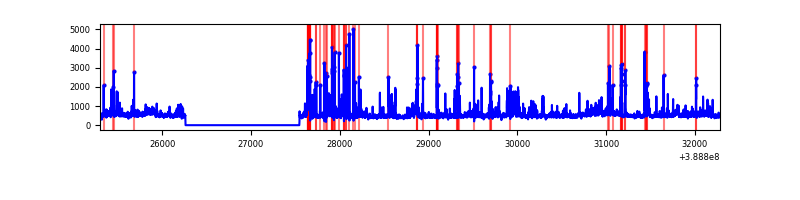 |
Top three noisy pixels from each quadrant. If the there are fewer than three noisy pixels in the level2.evt file, extra rows are filled as -1
| Pixel properties | Quadrant properties | ||||||
|---|---|---|---|---|---|---|---|
| Quadrant | DetID | PixID | Counts | Sigma | Mean | Median | Sigma |
| A | 15 | 169 | 198971 | 1473.46 | 662 | 649 | 134.6 |
| A | 10 | 83 | 101010 | 745.64 | 662 | 649 | 134.6 |
| A | 13 | 6 | 11836 | 83.12 | 662 | 649 | 134.6 |
| B | 5 | 172 | 947916 | 7453.1 | 652 | 631 | 127.1 |
| B | 12 | 111 | 16362 | 123.77 | 652 | 631 | 127.1 |
| B | 8 | 128 | 16156 | 122.15 | 652 | 631 | 127.1 |
| C | 15 | 214 | 229506 | 1502.45 | 648 | 653 | 152.3 |
| C | 0 | 10 | 168726 | 1103.42 | 648 | 653 | 152.3 |
| C | 9 | 69 | 80311 | 522.97 | 648 | 653 | 152.3 |
| D | 7 | 80 | 423179 | 2670.82 | 644 | 625 | 158.2 |
| D | 2 | 249 | 143271 | 901.62 | 644 | 625 | 158.2 |
| D | 1 | 52 | 137543 | 865.41 | 644 | 625 | 158.2 |
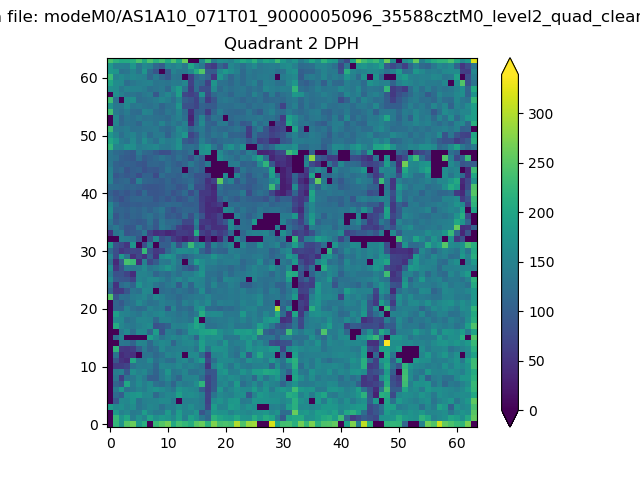
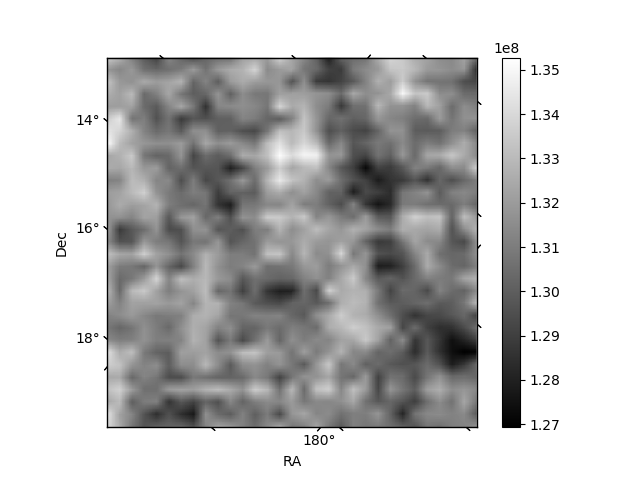
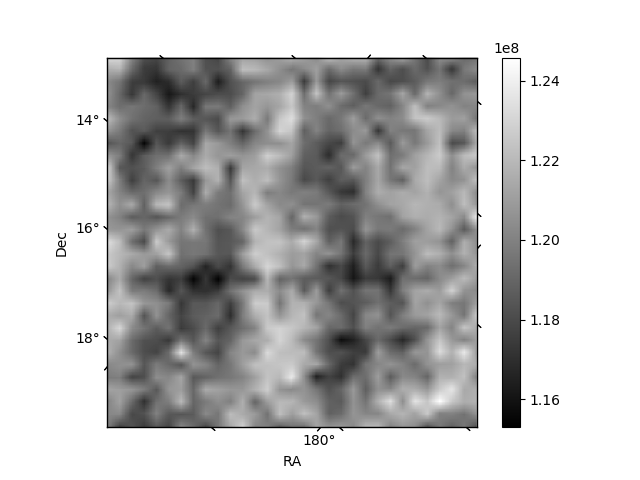
Histogram calculated using DETX and DETY for each event in the final _common_clean file
| Quadrant A | 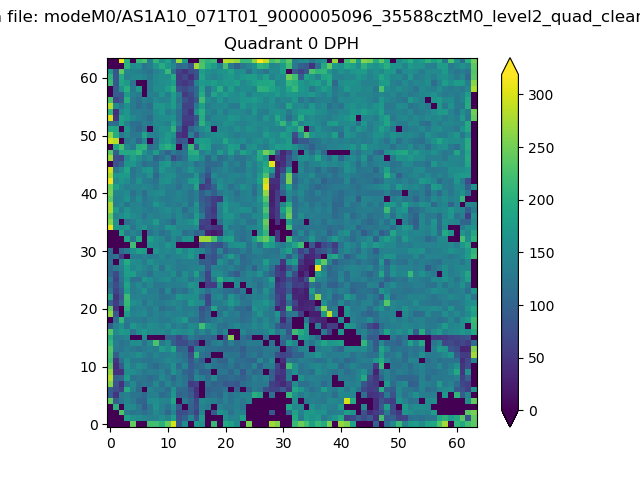 |
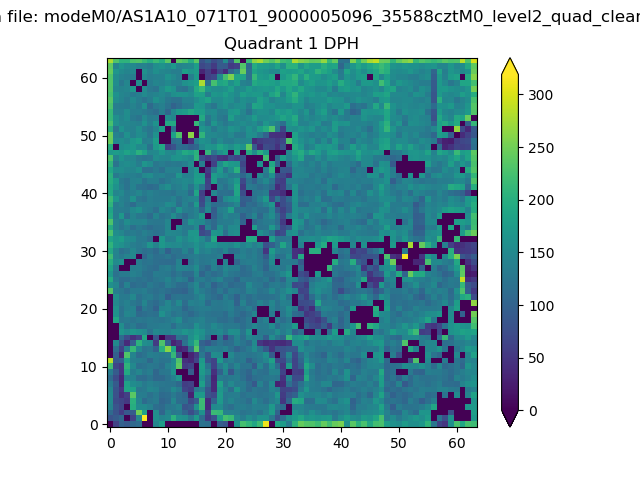 |
Quadrant B |
|---|---|---|---|
| Quadrant D | 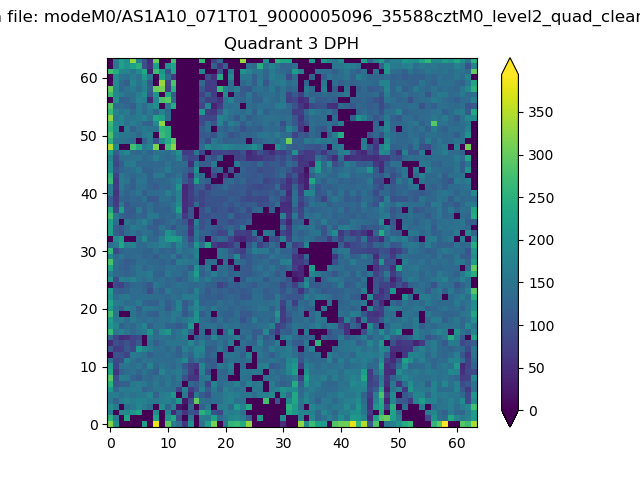 |
 |
Quadrant C |
| Plot type | Count rate plots | Images |
|---|---|---|
| Comparison with Poisson distribution Blue bars denote a histogram of data divided into 1 sec bins. Red curve is a Poisson curve with rate = median count rate of data. |
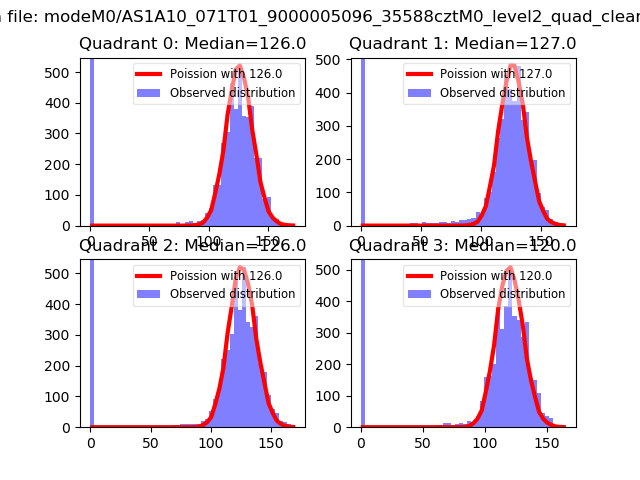 |
 |
| Quadrant-wise count rates Data is divided into 100 sec bins |
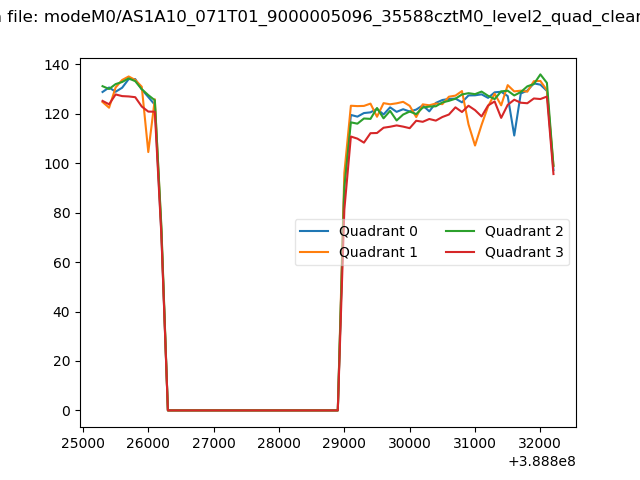 |
|
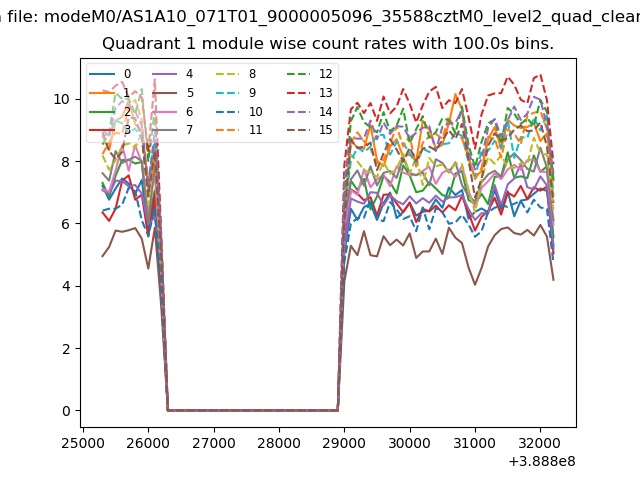
| Module-wise count rates for Quadrant A Data is divided into 100 sec bins |
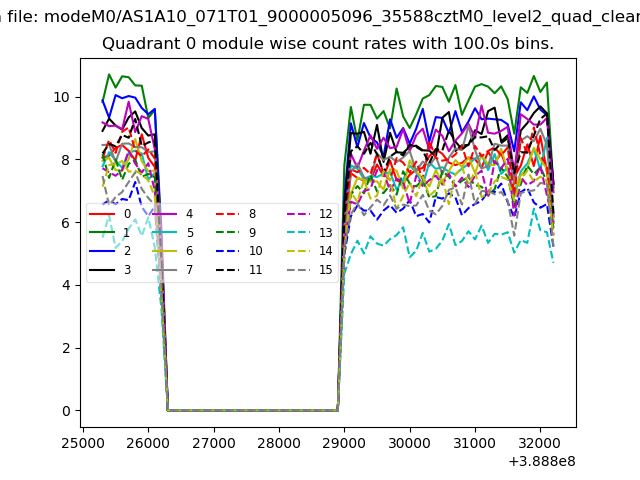 |
 |
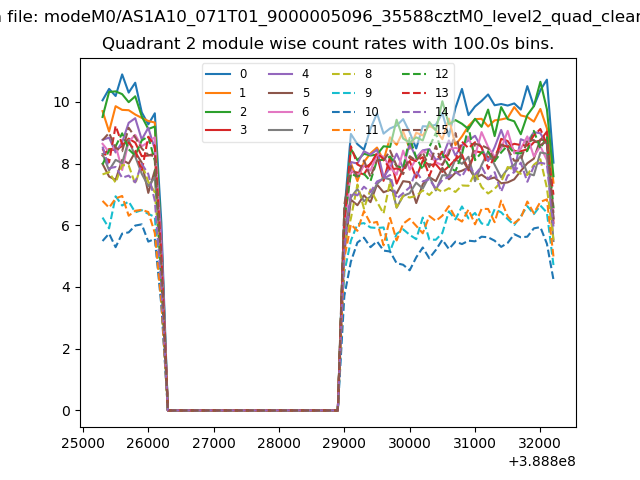
| Module-wise count rates for Quadrant B Data is divided into 100 sec bins |
 |
 |
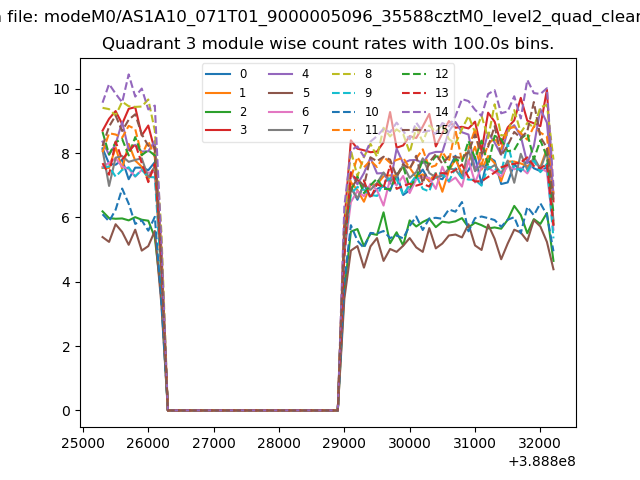
| Module-wise count rates for Quadrant C Data is divided into 100 sec bins |
 |
 |
| Module-wise count rates for Quadrant D Data is divided into 100 sec bins |
 |
 |
| Parameter | Plot |
|---|---|
| CZT HV Monitor | 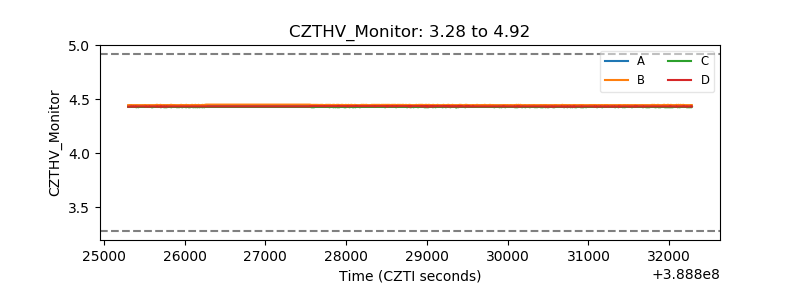 |
| D_VDD | 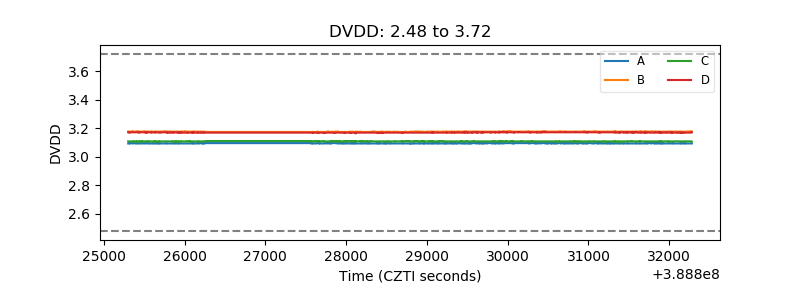 |
| Temperature 1 | 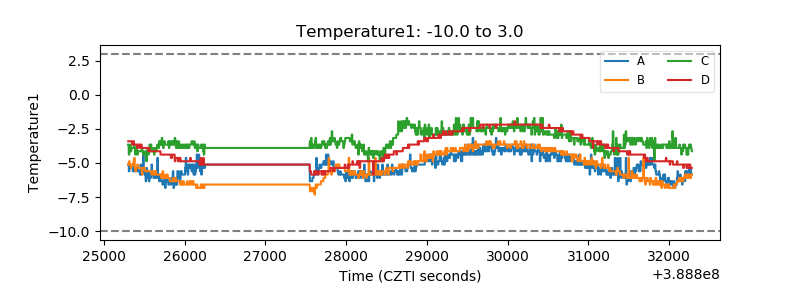 |
| Veto HV Monitor | 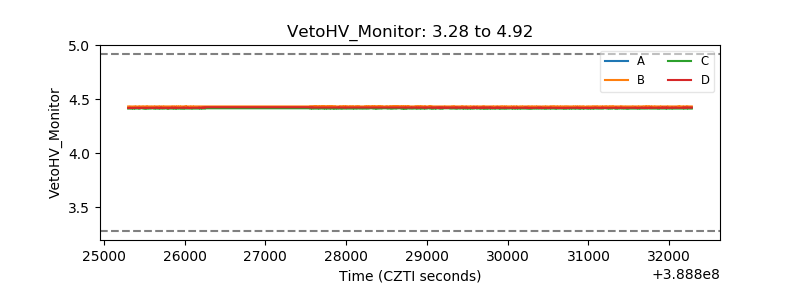 |
| Veto LLD | 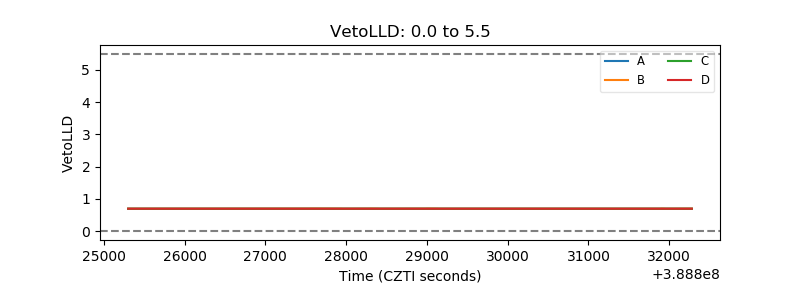 |
| Alpha Counter | 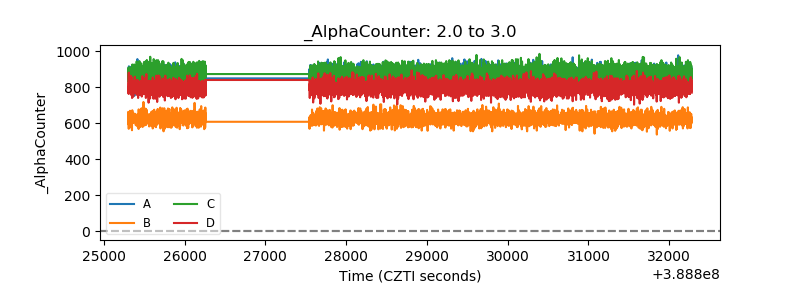 |
| _CPM_Rate | 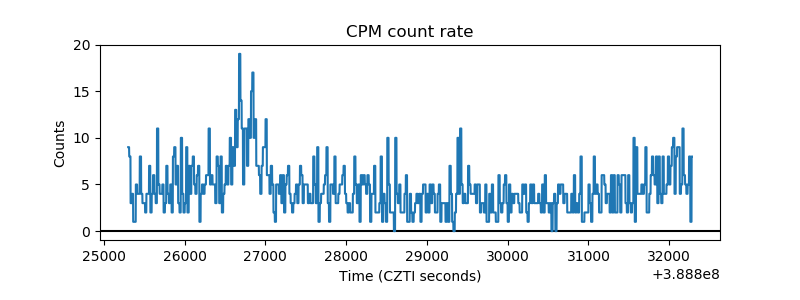 |
| CZT Counter | 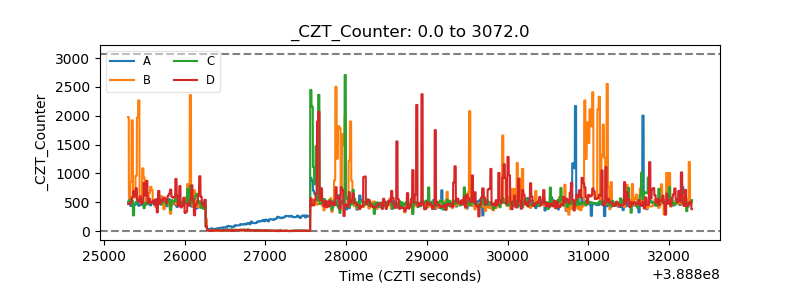 |
| +2.5 Volts monitor | 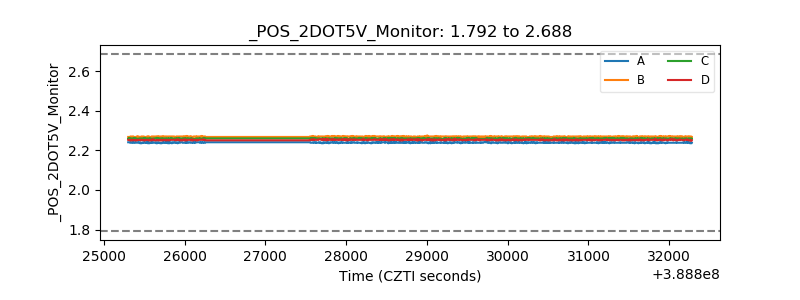 |
| +5 Volts monitor | 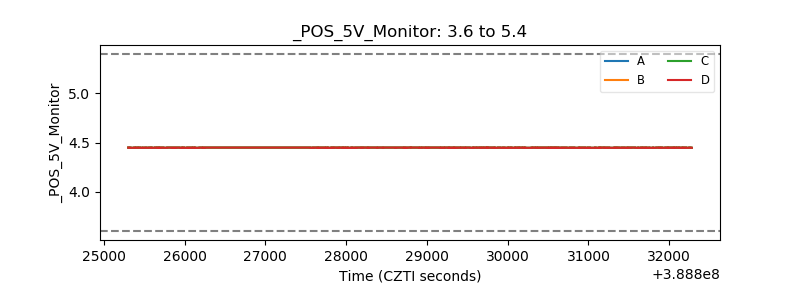 |
| _ROLL_ROT | 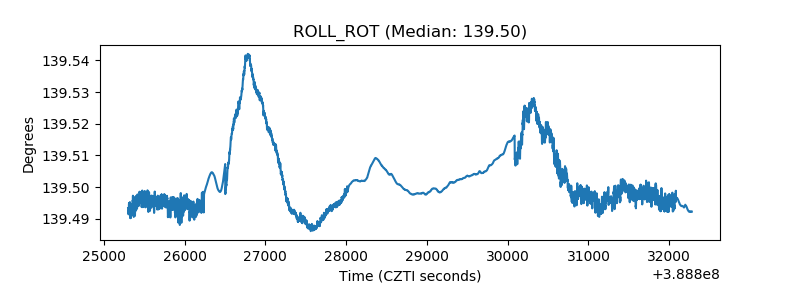 |
| _Roll_DEC | 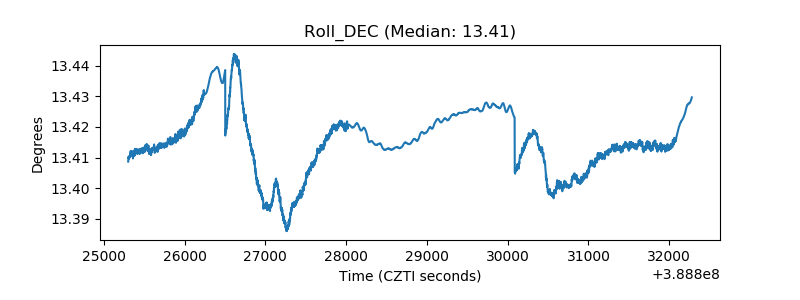 |
| _Roll_RA | 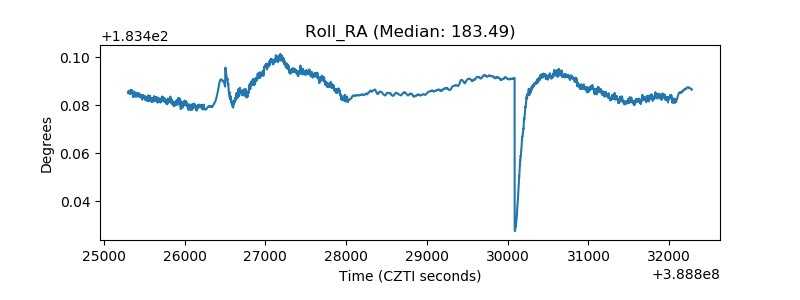 |
| Veto Counter | 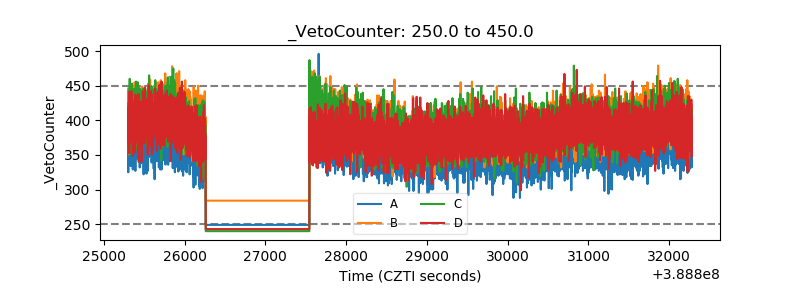 |