| Param | Original file | Final file |
|---|---|---|
| Filename | modeM0/AS1A10_071T01_9000005096_35585cztM0_level2.evt | modeM0/AS1A10_071T01_9000005096_35585cztM0_level2_quad_clean.evt |
| Size (bytes) | 456,814,080 | 55,745,280 |
| Size | 435.7 MB | 53.2 MB |
| Events in quadrant A | 3,881,089 | 300,692 |
| Events in quadrant B | 3,331,121 | 335,297 |
| Events in quadrant C | 3,273,641 | 331,643 |
| Events in quadrant D | 2,960,070 | 319,704 |
| Mode SS | |||
|---|---|---|---|
| Quadrant | BADHDUFLAG | Total packets | Discarded packets |
| A | 0 | 116 | 0 |
| B | 0 | 116 | 0 |
| C | 0 | 116 | 0 |
| D | 0 | 116 | 0 |
| Mode M9 | |||
|---|---|---|---|
| Quadrant | BADHDUFLAG | Total packets | Discarded packets |
| A | 0 | 22 | 0 |
| B | 0 | 22 | 0 |
| C | 0 | 22 | 0 |
| D | 0 | 23 | 0 |
| Mode M0 | |||
|---|---|---|---|
| Quadrant | BADHDUFLAG | Total packets | Discarded packets |
| A | 0 | 15264 | 3 |
| B | 0 | 13633 | 2 |
| C | 0 | 12990 | 2 |
| D | 0 | 12611 | 2 |
| Quadrant | Total seconds | Saturated seconds | Saturation percentage |
|---|---|---|---|
| A | 5723 | 431 | 7.531015% |
| B | 5723 | 184 | 3.215097% |
| C | 5723 | 105 | 1.834702% |
| D | 5723 | 47 | 0.821248% |
Noise dominated data is calculated using 1-second bins in cleaned event files. If a bin has >2000 counts, and if more than 50% of those come from <1% of pixels, then it is considered to be noise-dominated and hence unusable.
| Quadrant | # 1 sec bins | Bins with >0 counts | Bins with >2000 counts | High rate bins dominated by noise | Noise dominated (total time) | Noise dominated (detector-on time) | Marked lightcurve |
|---|---|---|---|---|---|---|---|
| A | 7098 | 5724 | 366 | 366 | 5.16% | 6.39% | 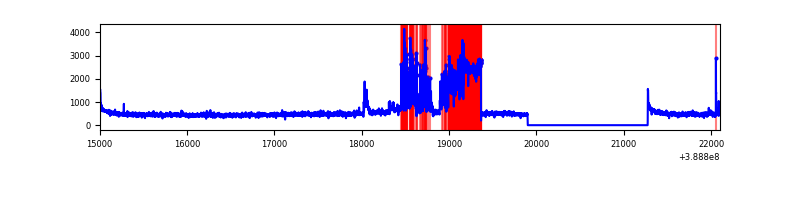 |
| B | 7098 | 5724 | 97 | 97 | 1.37% | 1.69% | 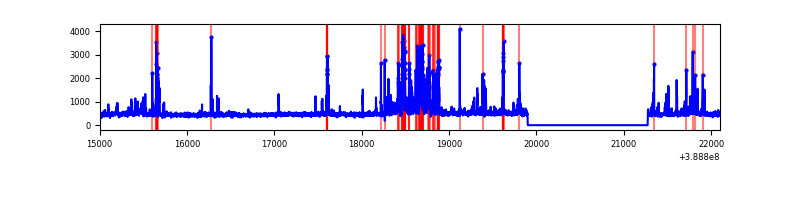 |
| C | 7098 | 5724 | 82 | 82 | 1.16% | 1.43% | 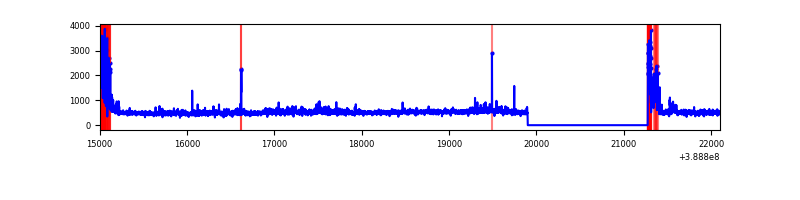 |
| D | 7098 | 5724 | 39 | 39 | 0.55% | 0.68% | 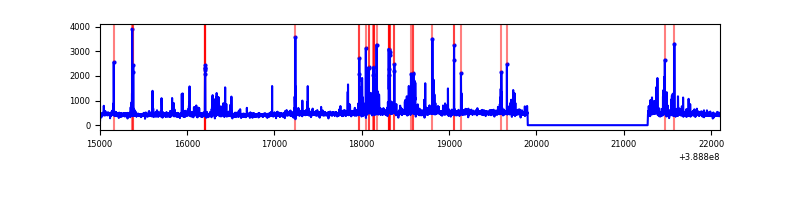 |
Top three noisy pixels from each quadrant. If the there are fewer than three noisy pixels in the level2.evt file, extra rows are filled as -1
| Pixel properties | Quadrant properties | ||||||
|---|---|---|---|---|---|---|---|
| Quadrant | DetID | PixID | Counts | Sigma | Mean | Median | Sigma |
| A | 15 | 169 | 1277276 | 9767.01 | 635 | 621 | 130.7 |
| A | 10 | 83 | 134856 | 1026.96 | 635 | 621 | 130.7 |
| A | 13 | 6 | 17843 | 131.76 | 635 | 621 | 130.7 |
| B | 5 | 172 | 664319 | 5214.83 | 654 | 635 | 127.3 |
| B | 4 | 232 | 63598 | 494.73 | 654 | 635 | 127.3 |
| B | 12 | 111 | 16367 | 123.61 | 654 | 635 | 127.3 |
| C | 0 | 10 | 497407 | 3310.6 | 643 | 647 | 150.1 |
| C | 15 | 214 | 252077 | 1675.63 | 643 | 647 | 150.1 |
| C | 9 | 187 | 6380 | 38.21 | 643 | 647 | 150.1 |
| D | 13 | 249 | 140100 | 875.76 | 645 | 627 | 159.3 |
| D | 2 | 249 | 102452 | 639.37 | 645 | 627 | 159.3 |
| D | 2 | 153 | 48544 | 300.87 | 645 | 627 | 159.3 |
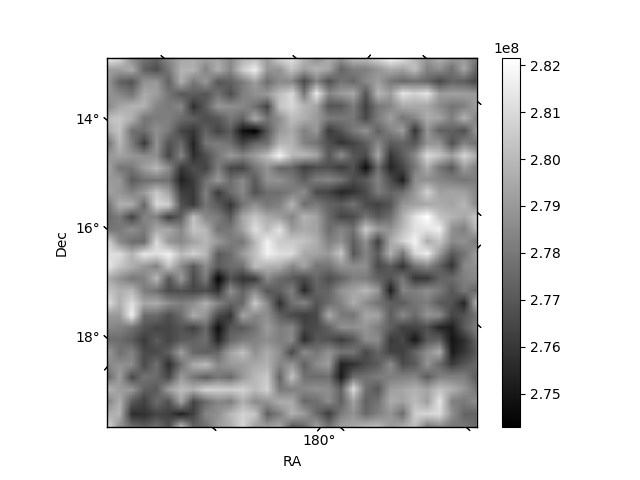
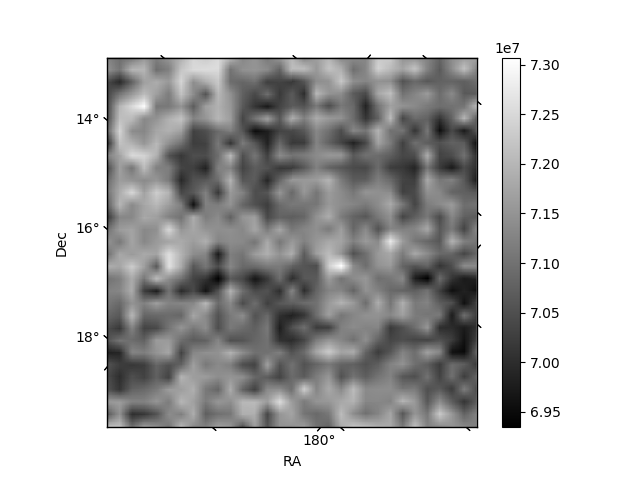
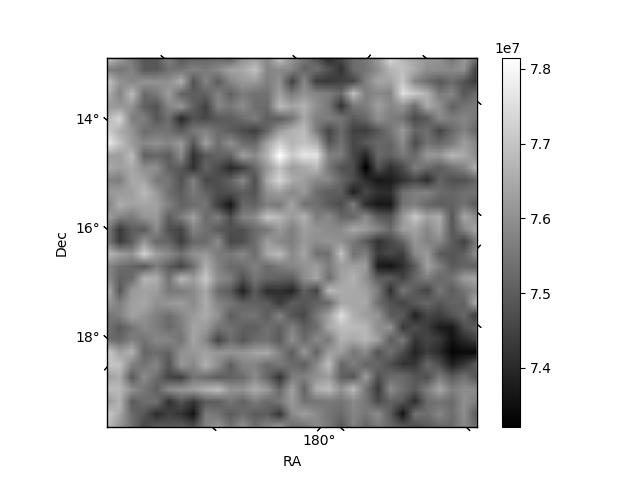
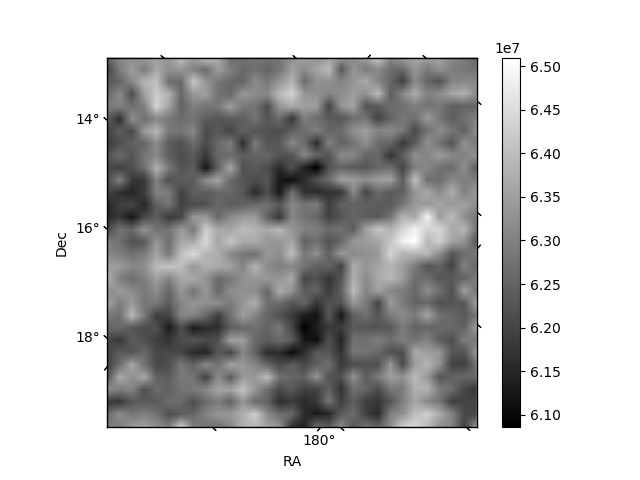
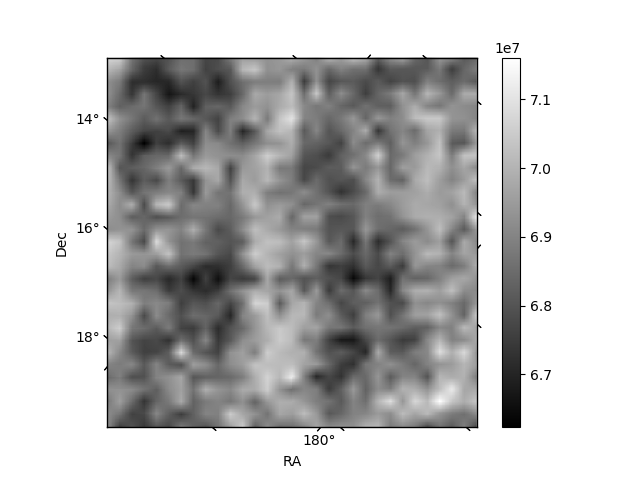
Histogram calculated using DETX and DETY for each event in the final _common_clean file
| Quadrant A | 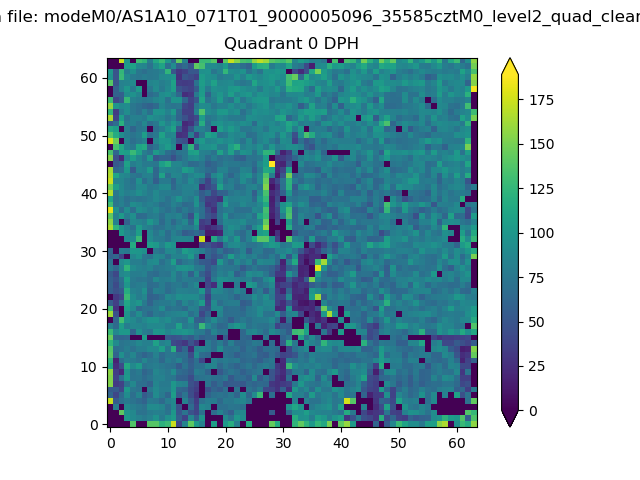 |
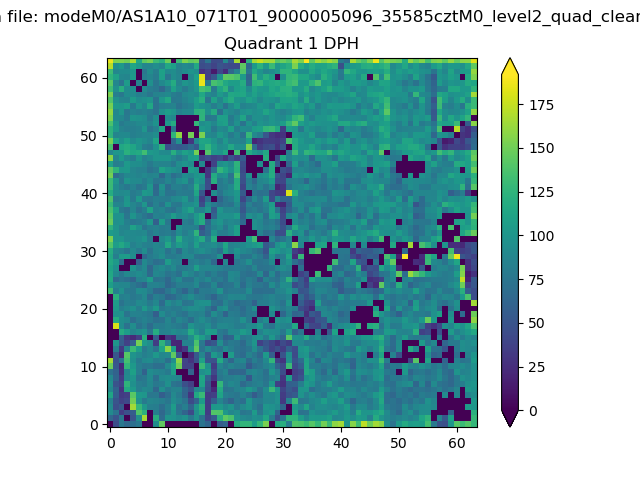 |
Quadrant B |
|---|---|---|---|
| Quadrant D | 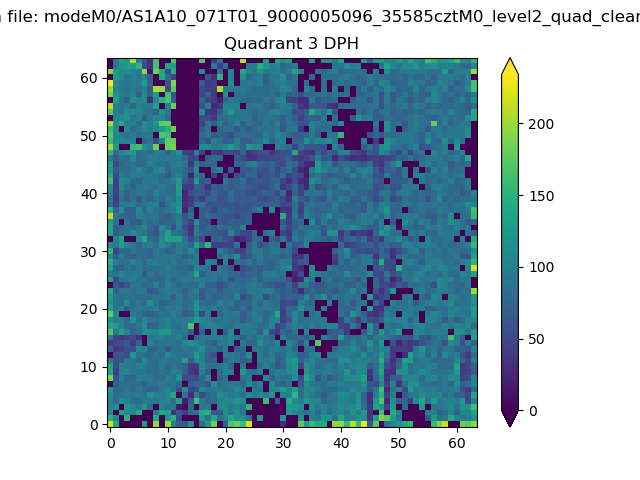 |
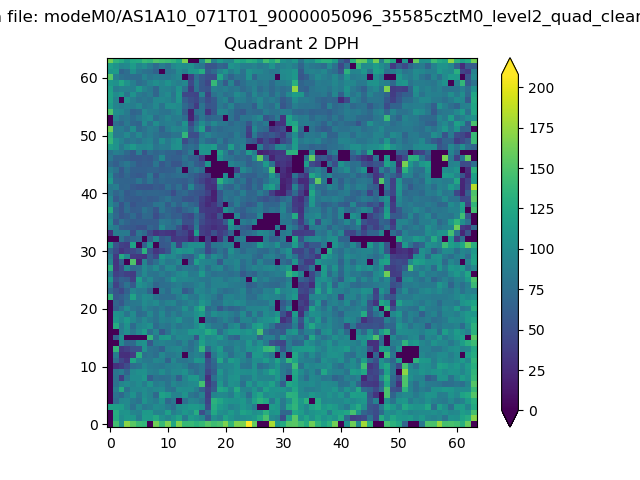 |
Quadrant C |
| Plot type | Count rate plots | Images |
|---|---|---|
| Comparison with Poisson distribution Blue bars denote a histogram of data divided into 1 sec bins. Red curve is a Poisson curve with rate = median count rate of data. |
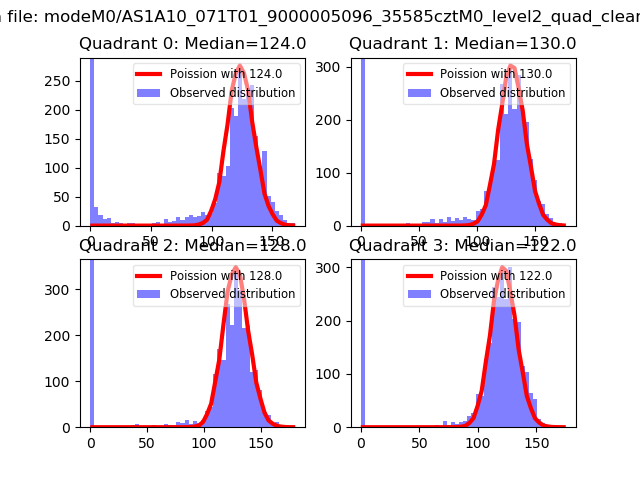 |
 |
| Quadrant-wise count rates Data is divided into 100 sec bins |
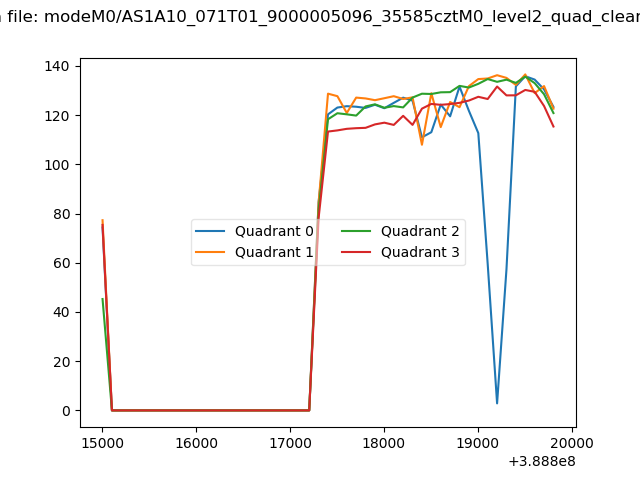 |
|
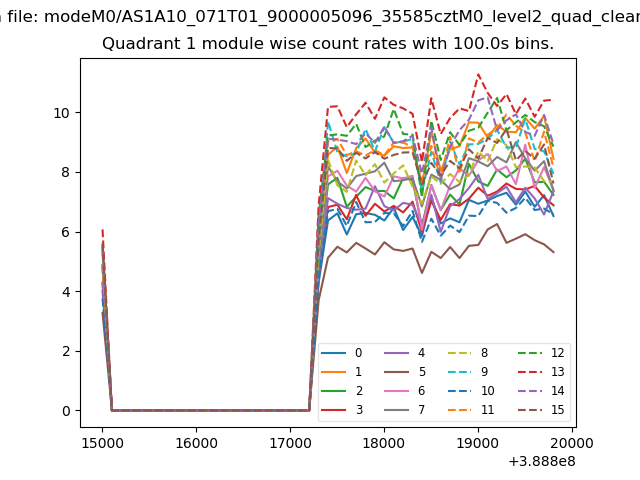
| Module-wise count rates for Quadrant A Data is divided into 100 sec bins |
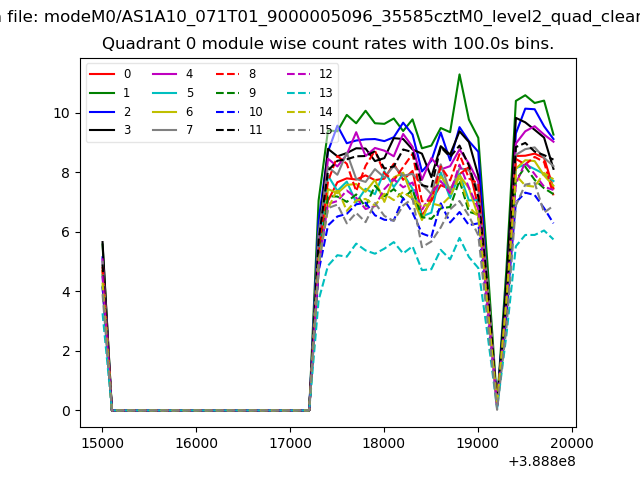 |
 |
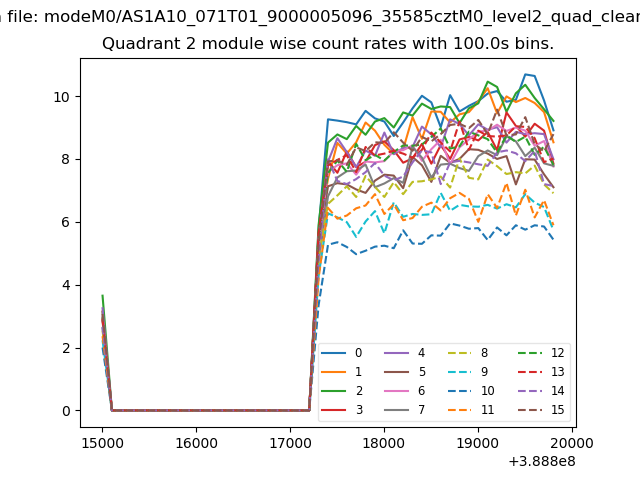
| Module-wise count rates for Quadrant B Data is divided into 100 sec bins |
 |
 |
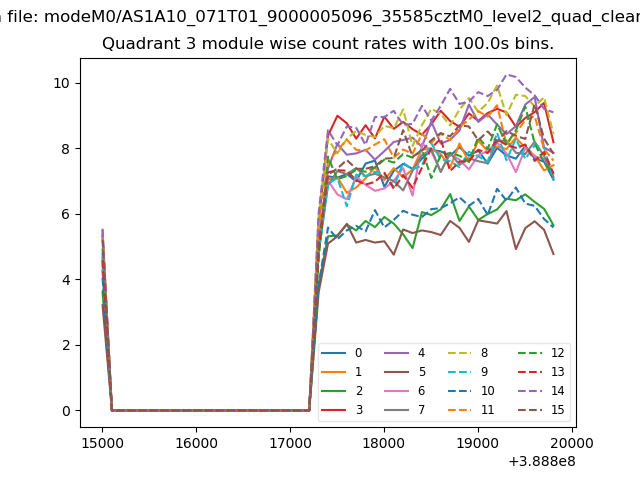
| Module-wise count rates for Quadrant C Data is divided into 100 sec bins |
 |
 |
| Module-wise count rates for Quadrant D Data is divided into 100 sec bins |
 |
 |
| Parameter | Plot |
|---|---|
| CZT HV Monitor | 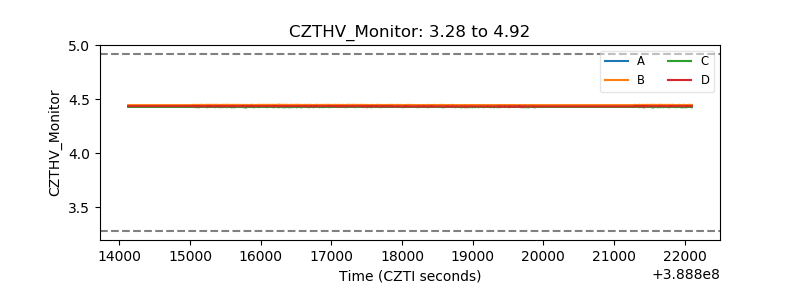 |
| D_VDD | 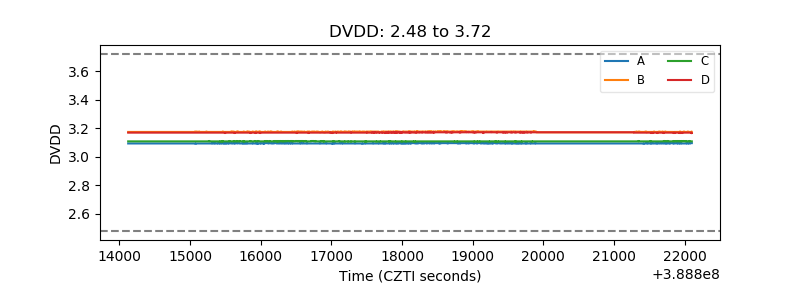 |
| Temperature 1 | 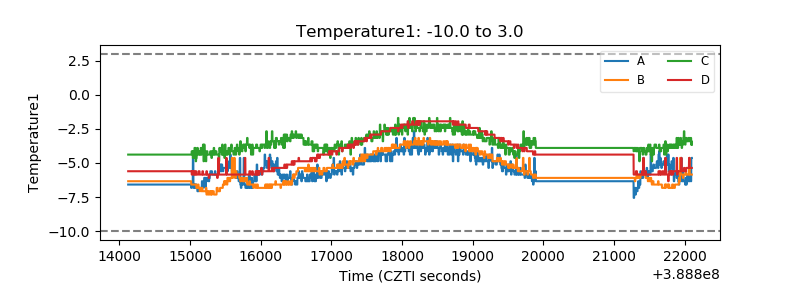 |
| Veto HV Monitor | 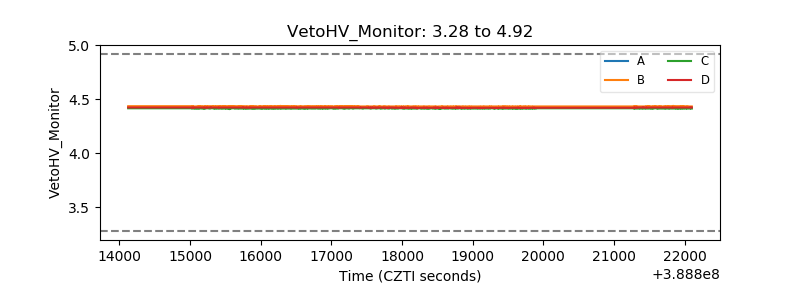 |
| Veto LLD | 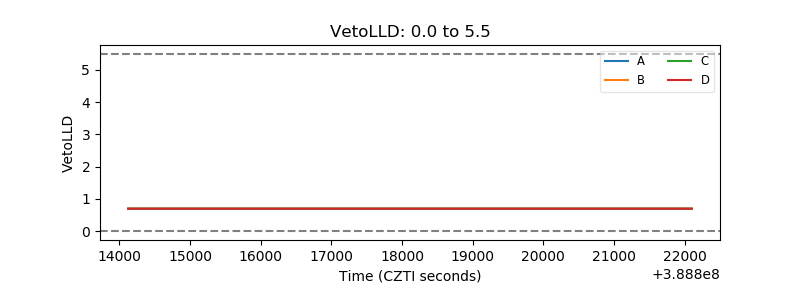 |
| Alpha Counter | 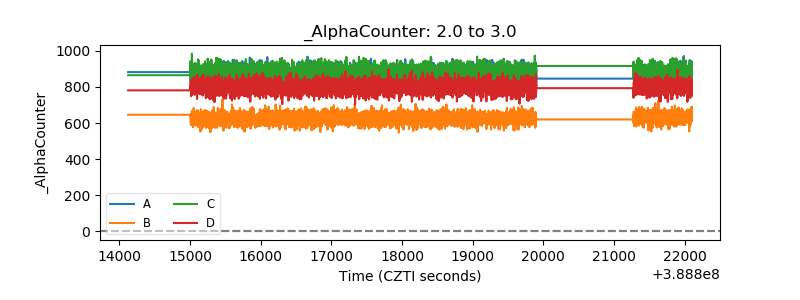 |
| _CPM_Rate | 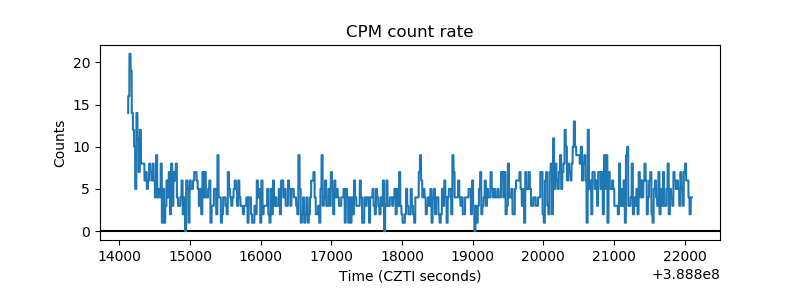 |
| CZT Counter | 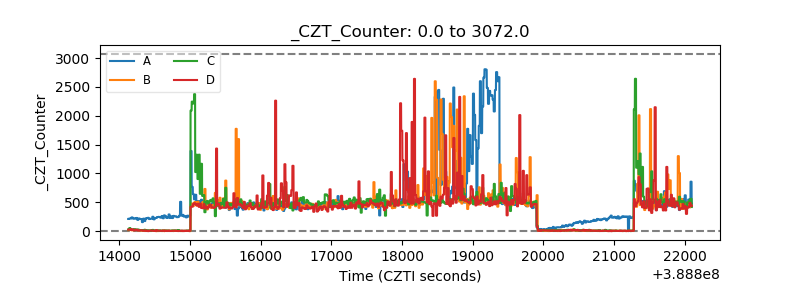 |
| +2.5 Volts monitor | 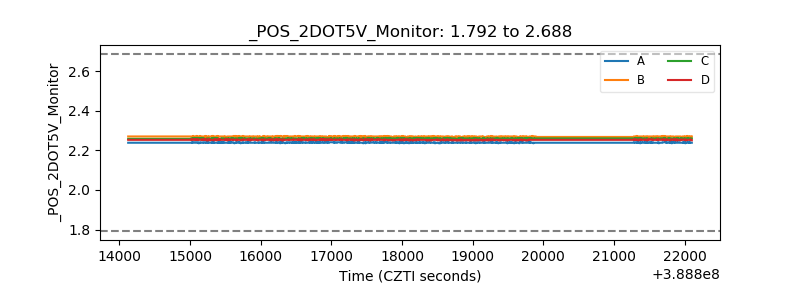 |
| +5 Volts monitor | 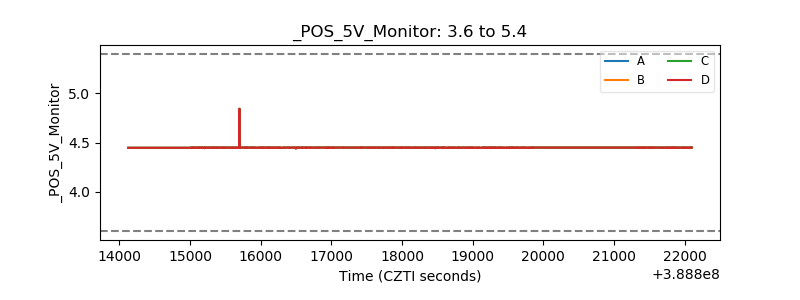 |
| _ROLL_ROT | 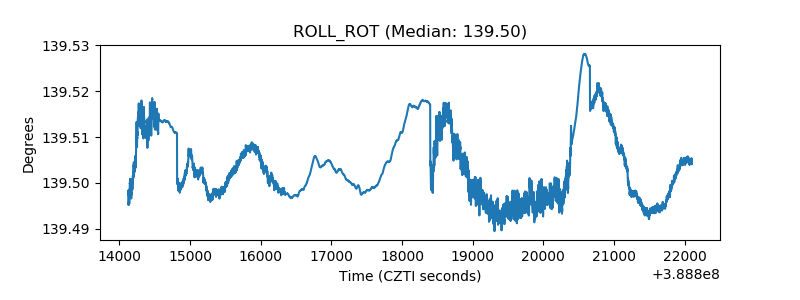 |
| _Roll_DEC | 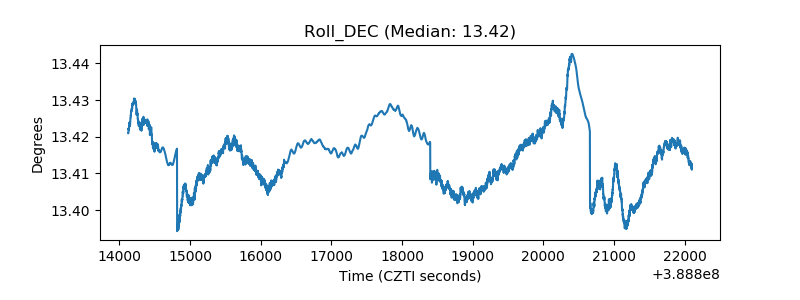 |
| _Roll_RA | 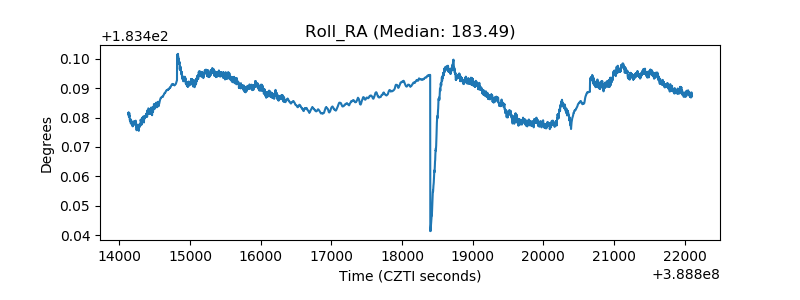 |
| Veto Counter | 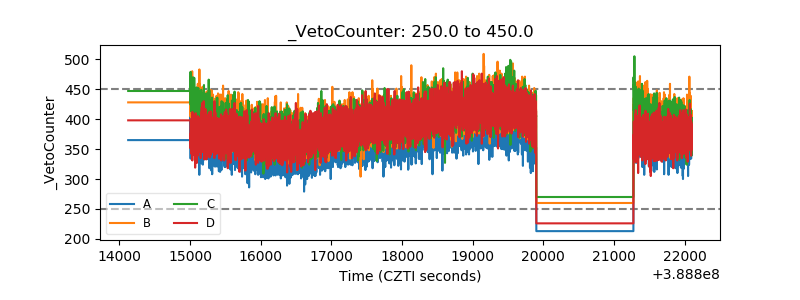 |