| Param | Original file | Final file |
|---|---|---|
| Filename | modeM0/AS1A10_071T01_9000005096_35584cztM0_level2.evt | modeM0/AS1A10_071T01_9000005096_35584cztM0_level2_quad_clean.evt |
| Size (bytes) | 449,015,040 | 61,220,160 |
| Size | 428.2 MB | 58.4 MB |
| Events in quadrant A | 2,948,164 | 373,723 |
| Events in quadrant B | 3,707,907 | 347,830 |
| Events in quadrant C | 3,348,212 | 364,318 |
| Events in quadrant D | 3,193,541 | 355,520 |
| Mode SS | |||
|---|---|---|---|
| Quadrant | BADHDUFLAG | Total packets | Discarded packets |
| A | 0 | 122 | 0 |
| B | 0 | 122 | 0 |
| C | 0 | 122 | 0 |
| D | 0 | 122 | 0 |
| Mode M9 | |||
|---|---|---|---|
| Quadrant | BADHDUFLAG | Total packets | Discarded packets |
| A | 0 | 36 | 0 |
| B | 0 | 36 | 0 |
| C | 0 | 36 | 0 |
| D | 0 | 36 | 0 |
| Mode M0 | |||
|---|---|---|---|
| Quadrant | BADHDUFLAG | Total packets | Discarded packets |
| A | 0 | 12440 | 3 |
| B | 0 | 14806 | 2 |
| C | 0 | 13362 | 2 |
| D | 0 | 13435 | 2 |
| Quadrant | Total seconds | Saturated seconds | Saturation percentage |
|---|---|---|---|
| A | 5894 | 15 | 0.254496% |
| B | 5894 | 427 | 7.244656% |
| C | 5894 | 140 | 2.375297% |
| D | 5894 | 78 | 1.323380% |
Noise dominated data is calculated using 1-second bins in cleaned event files. If a bin has >2000 counts, and if more than 50% of those come from <1% of pixels, then it is considered to be noise-dominated and hence unusable.
| Quadrant | # 1 sec bins | Bins with >0 counts | Bins with >2000 counts | High rate bins dominated by noise | Noise dominated (total time) | Noise dominated (detector-on time) | Marked lightcurve |
|---|---|---|---|---|---|---|---|
| A | 9448 | 5896 | 3 | 3 | 0.03% | 0.05% | 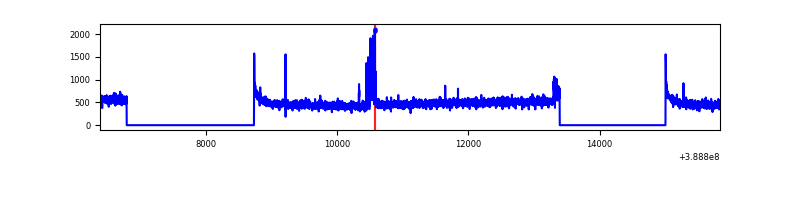 |
| B | 9448 | 5896 | 304 | 304 | 3.22% | 5.16% | 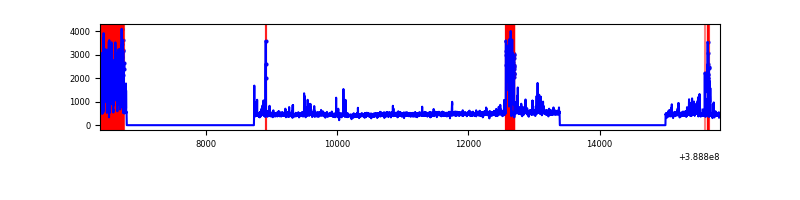 |
| C | 9448 | 5896 | 109 | 109 | 1.15% | 1.85% | 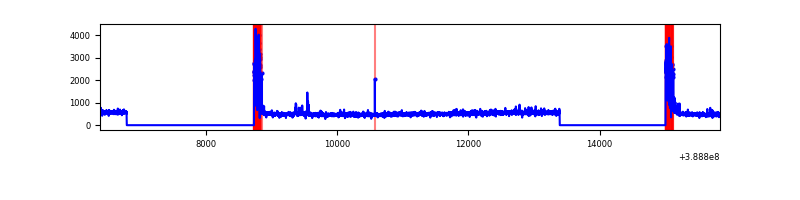 |
| D | 9448 | 5896 | 63 | 63 | 0.67% | 1.07% | 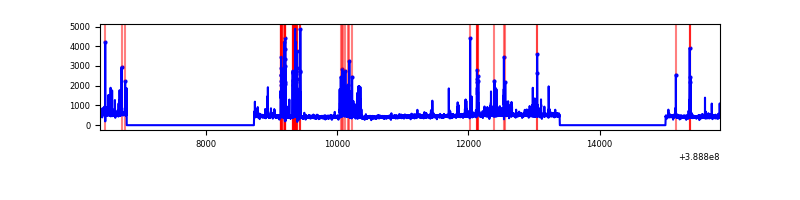 |
Top three noisy pixels from each quadrant. If the there are fewer than three noisy pixels in the level2.evt file, extra rows are filled as -1
| Pixel properties | Quadrant properties | ||||||
|---|---|---|---|---|---|---|---|
| Quadrant | DetID | PixID | Counts | Sigma | Mean | Median | Sigma |
| A | 10 | 83 | 142459 | 1010.13 | 692 | 678 | 140.4 |
| A | 15 | 169 | 122637 | 868.91 | 692 | 678 | 140.4 |
| A | 13 | 6 | 9632 | 63.79 | 692 | 678 | 140.4 |
| B | 5 | 172 | 1027530 | 7952.94 | 659 | 641 | 129.1 |
| B | 4 | 232 | 35902 | 273.09 | 659 | 641 | 129.1 |
| B | 0 | 189 | 21250 | 159.61 | 659 | 641 | 129.1 |
| C | 0 | 10 | 425783 | 2728.8 | 669 | 673 | 155.8 |
| C | 15 | 214 | 260958 | 1670.78 | 669 | 673 | 155.8 |
| C | 10 | 49 | 38711 | 244.17 | 669 | 673 | 155.8 |
| D | 13 | 249 | 179976 | 1099.16 | 671 | 652 | 163.1 |
| D | 7 | 80 | 153420 | 936.38 | 671 | 652 | 163.1 |
| D | 12 | 233 | 76540 | 465.15 | 671 | 652 | 163.1 |
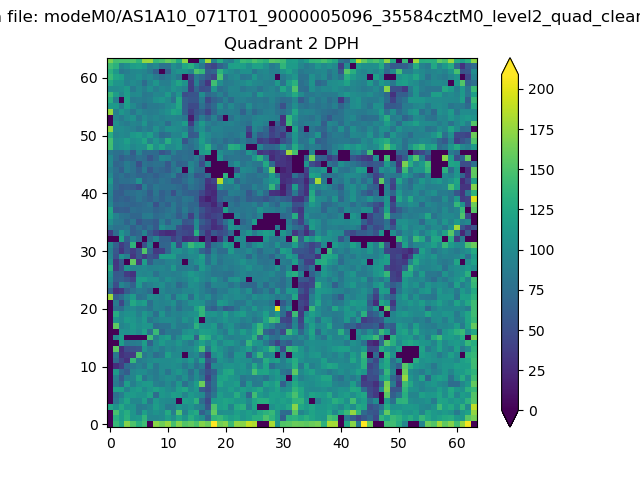
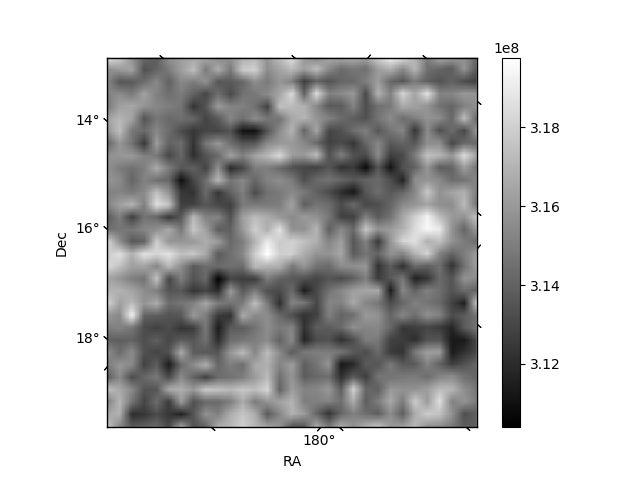
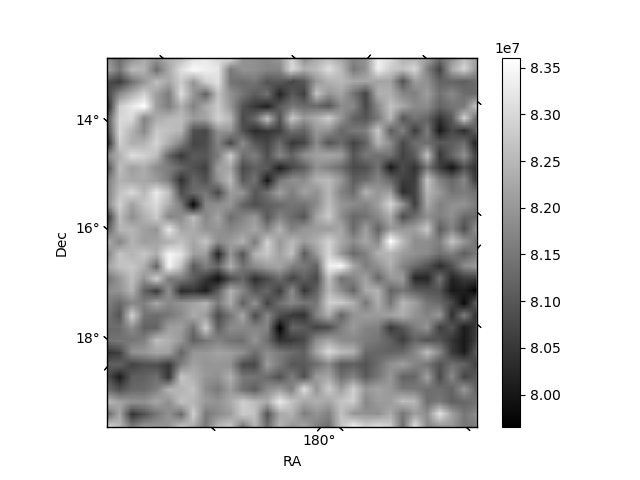
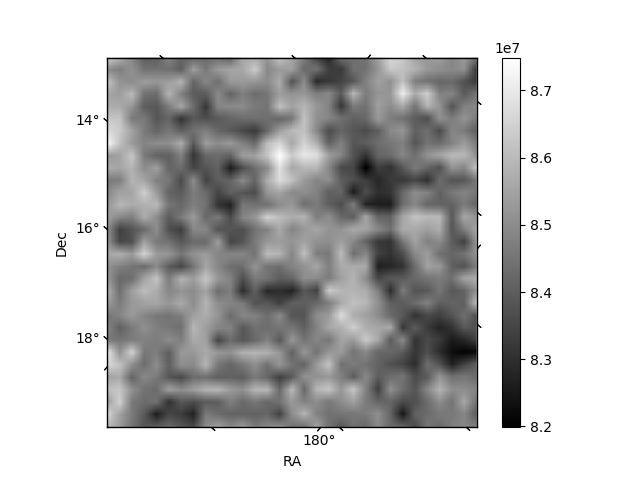
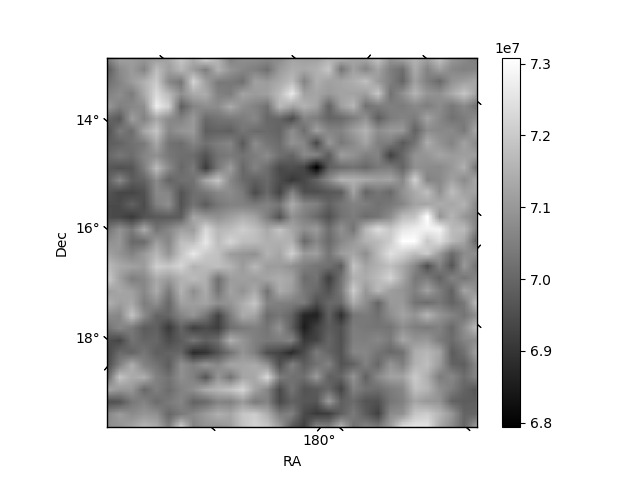
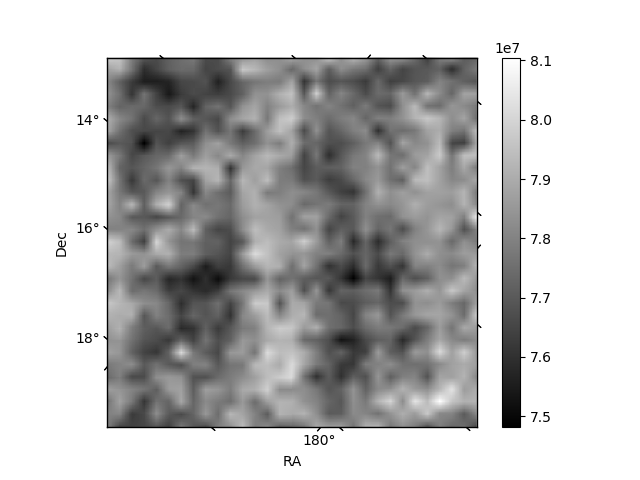
Histogram calculated using DETX and DETY for each event in the final _common_clean file
| Quadrant A | 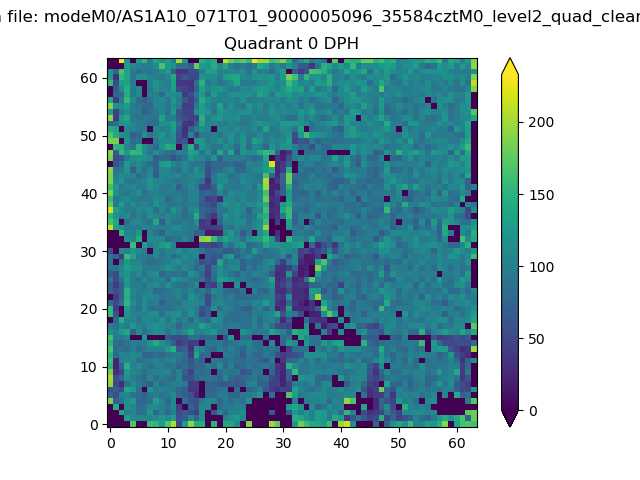 |
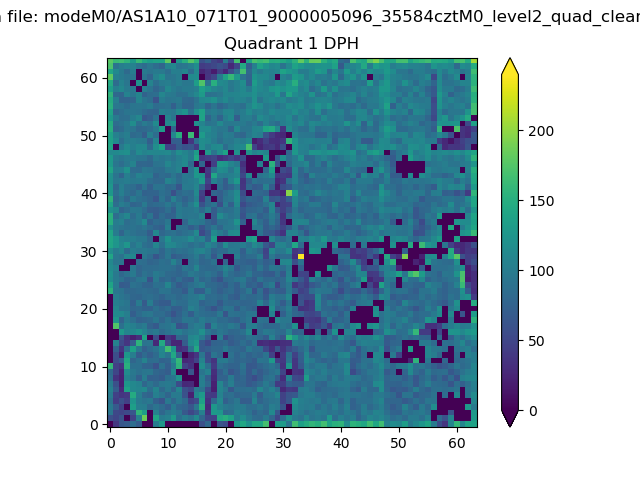 |
Quadrant B |
|---|---|---|---|
| Quadrant D | 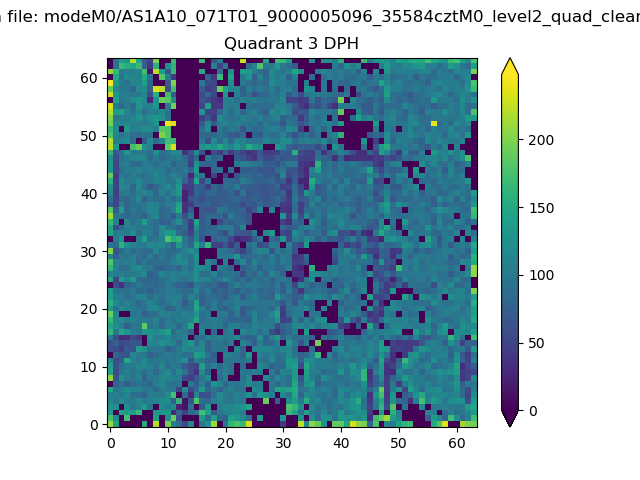 |
 |
Quadrant C |
| Plot type | Count rate plots | Images |
|---|---|---|
| Comparison with Poisson distribution Blue bars denote a histogram of data divided into 1 sec bins. Red curve is a Poisson curve with rate = median count rate of data. |
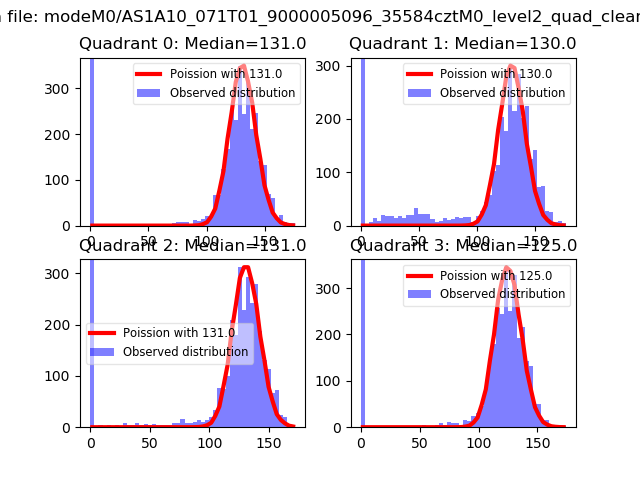 |
 |
| Quadrant-wise count rates Data is divided into 100 sec bins |
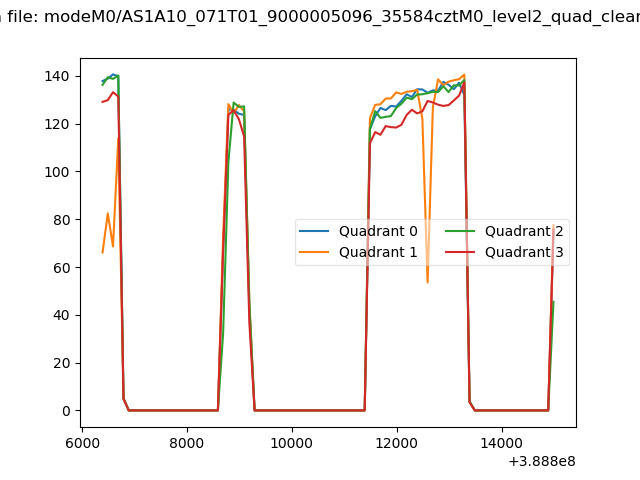 |
|
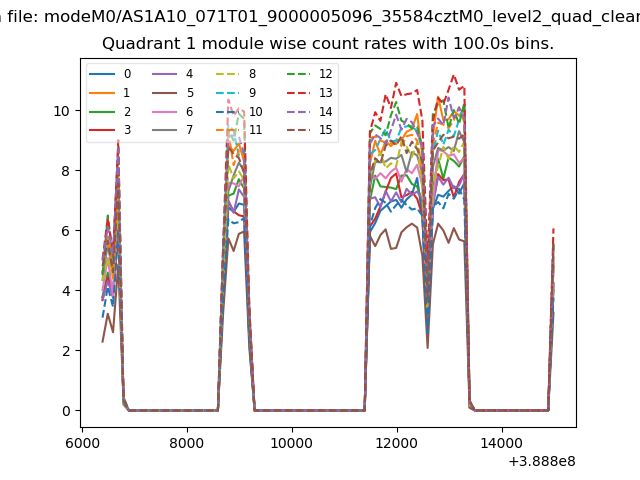
| Module-wise count rates for Quadrant A Data is divided into 100 sec bins |
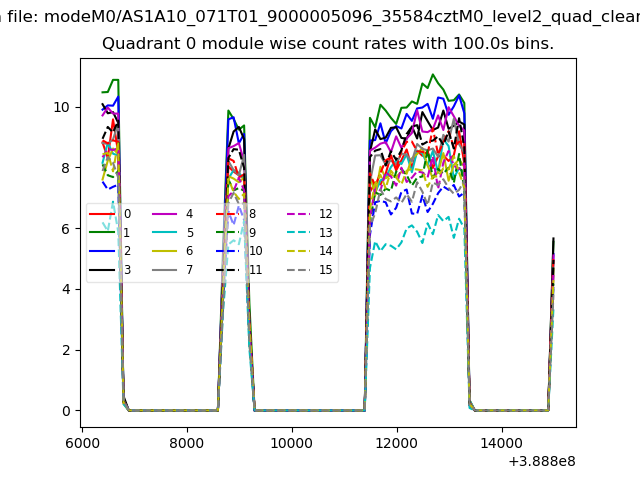 |
 |
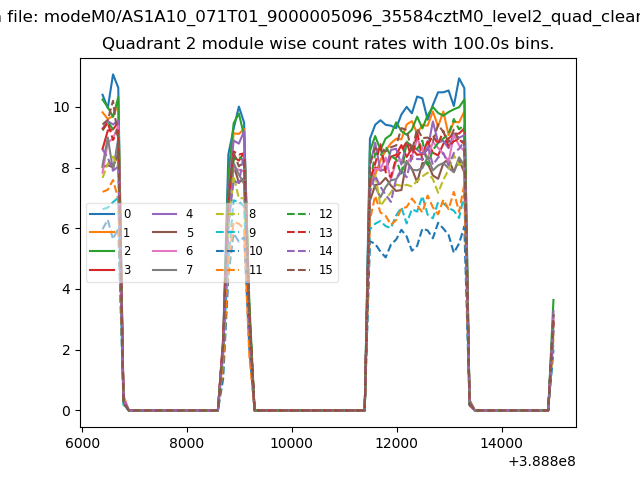
| Module-wise count rates for Quadrant B Data is divided into 100 sec bins |
 |
 |
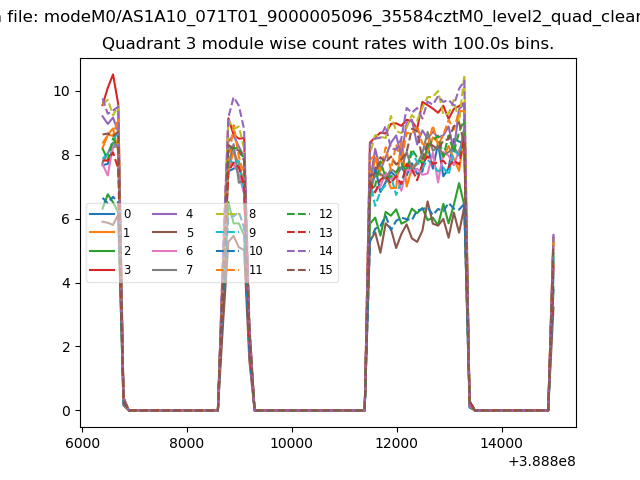
| Module-wise count rates for Quadrant C Data is divided into 100 sec bins |
 |
 |
| Module-wise count rates for Quadrant D Data is divided into 100 sec bins |
 |
 |
| Parameter | Plot |
|---|---|
| CZT HV Monitor | 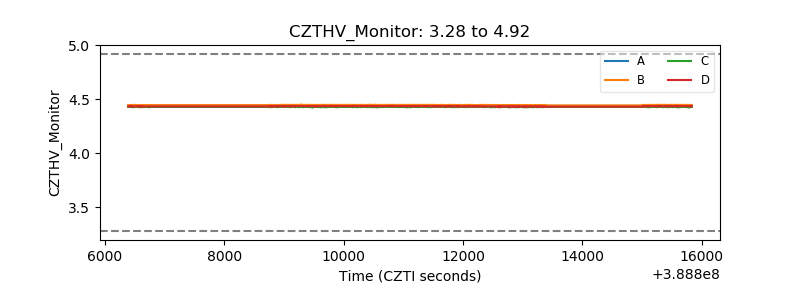 |
| D_VDD | 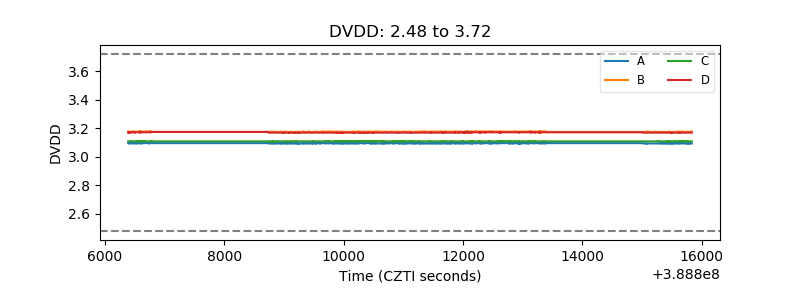 |
| Temperature 1 | 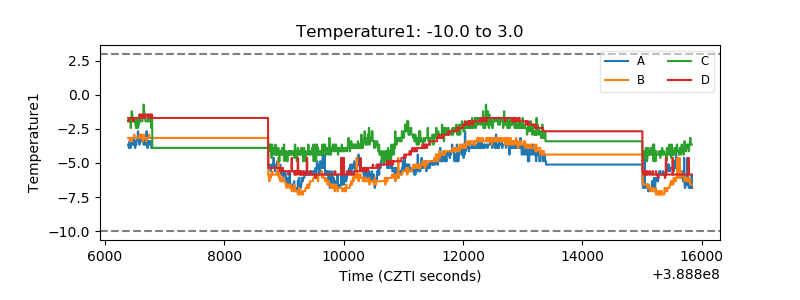 |
| Veto HV Monitor | 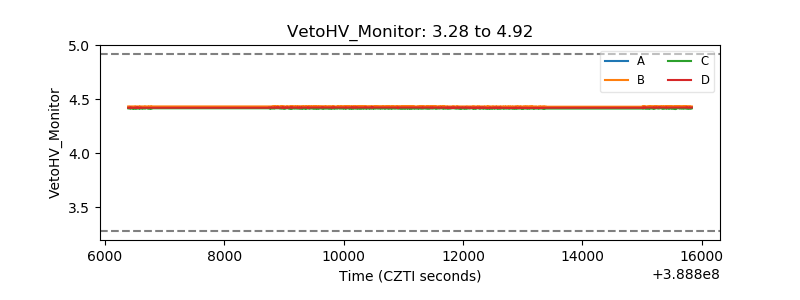 |
| Veto LLD | 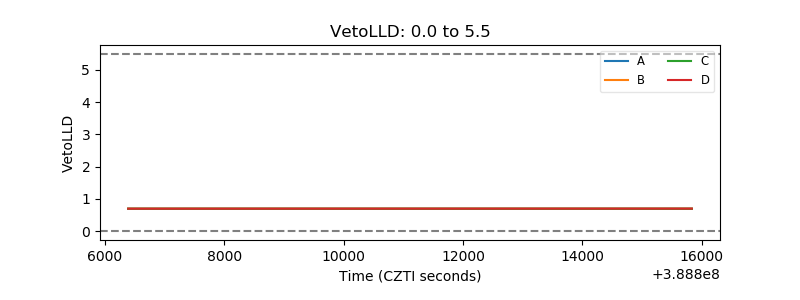 |
| Alpha Counter | 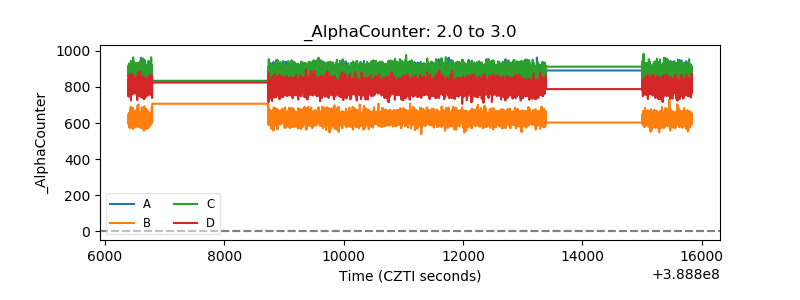 |
| _CPM_Rate | 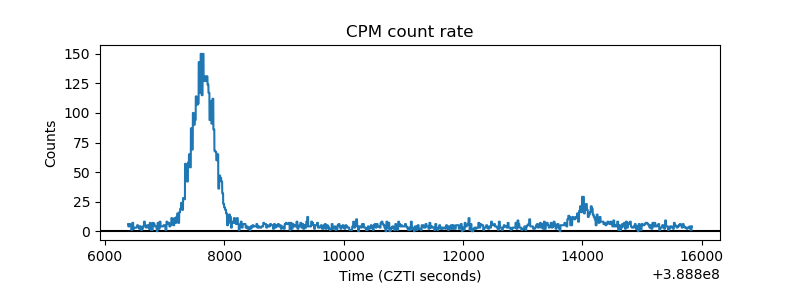 |
| CZT Counter | 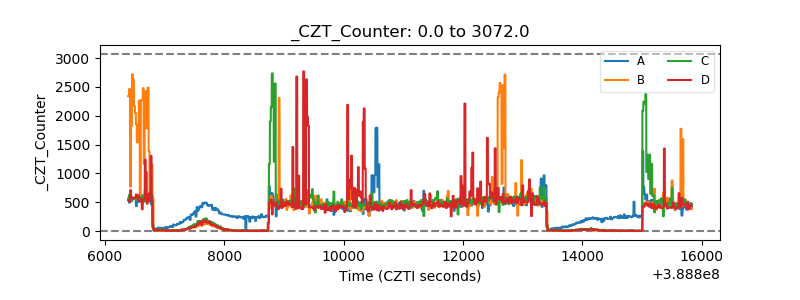 |
| +2.5 Volts monitor | 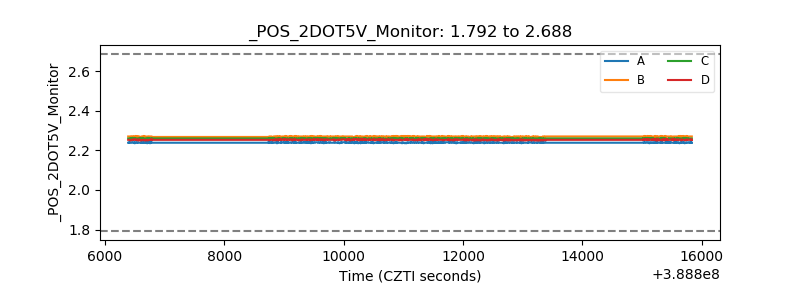 |
| +5 Volts monitor | 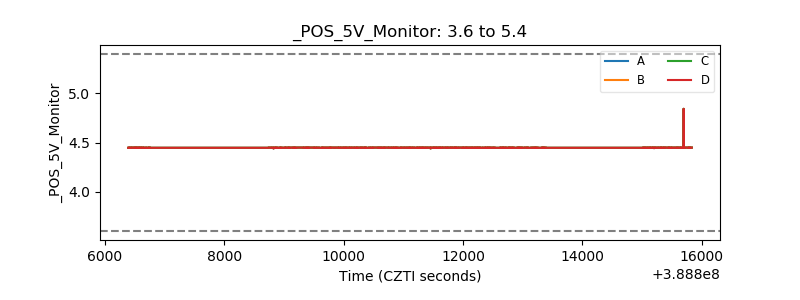 |
| _ROLL_ROT | 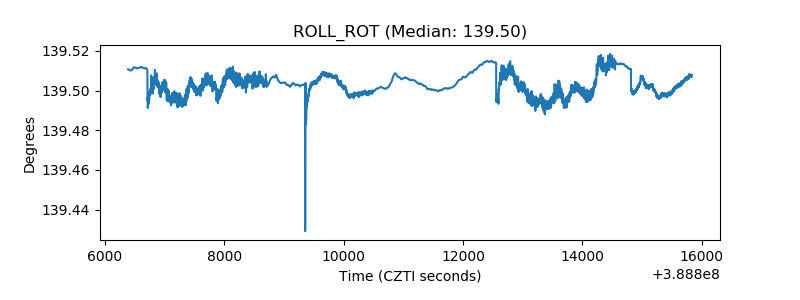 |
| _Roll_DEC | 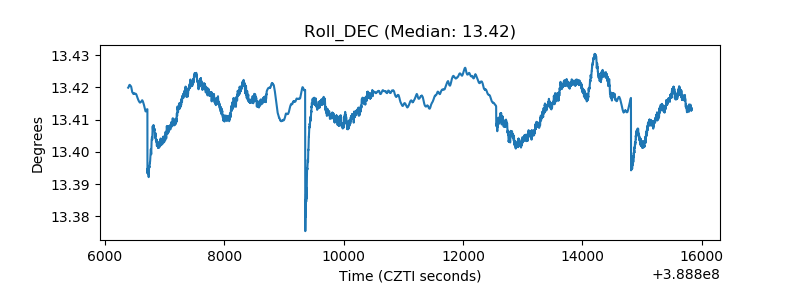 |
| _Roll_RA | 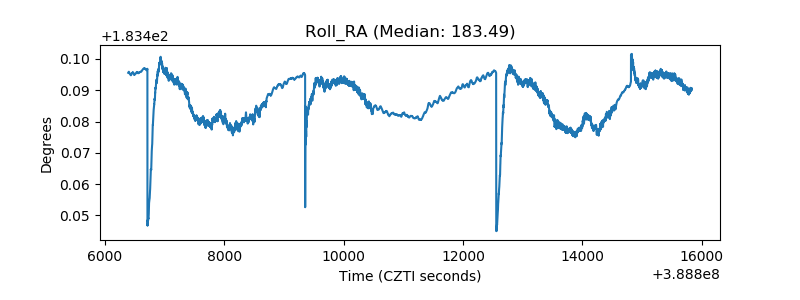 |
| Veto Counter | 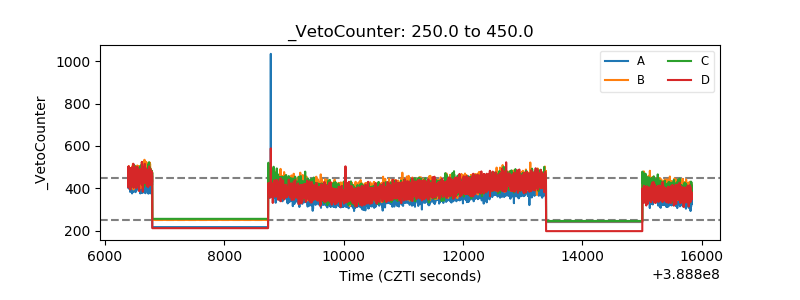 |