| Param | Original file | Final file |
|---|---|---|
| Filename | modeM0/AS1A10_071T01_9000005096_35581cztM0_level2.evt | modeM0/AS1A10_071T01_9000005096_35581cztM0_level2_quad_clean.evt |
| Size (bytes) | 456,572,160 | 60,131,520 |
| Size | 435.4 MB | 57.3 MB |
| Events in quadrant A | 4,351,853 | 357,308 |
| Events in quadrant B | 3,700,130 | 385,214 |
| Events in quadrant C | 2,924,189 | 370,088 |
| Events in quadrant D | 2,519,416 | 365,006 |
| Mode SS | |||
|---|---|---|---|
| Quadrant | BADHDUFLAG | Total packets | Discarded packets |
| A | 0 | 98 | 0 |
| B | 0 | 98 | 0 |
| C | 0 | 98 | 0 |
| D | 0 | 98 | 0 |
| Mode M9 | |||
|---|---|---|---|
| Quadrant | BADHDUFLAG | Total packets | Discarded packets |
| A | 0 | 35 | 0 |
| B | 0 | 35 | 0 |
| C | 0 | 35 | 0 |
| D | 0 | 36 | 0 |
| Mode M0 | |||
|---|---|---|---|
| Quadrant | BADHDUFLAG | Total packets | Discarded packets |
| A | 0 | 16094 | 3 |
| B | 0 | 14008 | 2 |
| C | 0 | 11408 | 2 |
| D | 0 | 10518 | 2 |
| Quadrant | Total seconds | Saturated seconds | Saturation percentage |
|---|---|---|---|
| A | 4889 | 420 | 8.590714% |
| B | 4889 | 506 | 10.349765% |
| C | 4889 | 180 | 3.681735% |
| D | 4889 | 29 | 0.593168% |
Noise dominated data is calculated using 1-second bins in cleaned event files. If a bin has >2000 counts, and if more than 50% of those come from <1% of pixels, then it is considered to be noise-dominated and hence unusable.
| Quadrant | # 1 sec bins | Bins with >0 counts | Bins with >2000 counts | High rate bins dominated by noise | Noise dominated (total time) | Noise dominated (detector-on time) | Marked lightcurve |
|---|---|---|---|---|---|---|---|
| A | 7042 | 4890 | 408 | 408 | 5.79% | 8.34% | 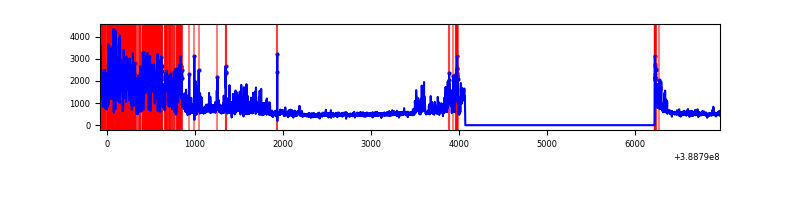 |
| B | 7042 | 4890 | 384 | 384 | 5.45% | 7.85% | 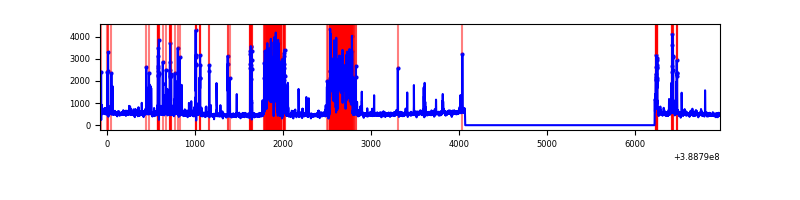 |
| C | 7042 | 4890 | 126 | 126 | 1.79% | 2.58% | 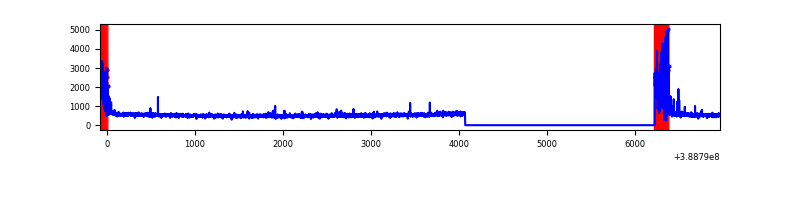 |
| D | 7042 | 4890 | 25 | 25 | 0.36% | 0.51% | 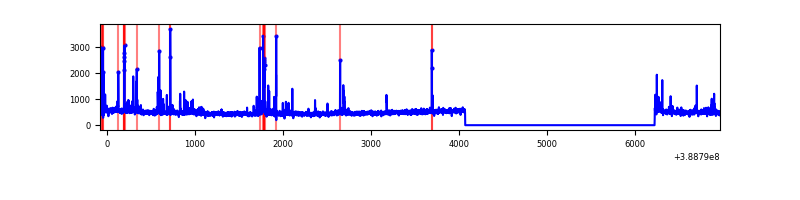 |
Top three noisy pixels from each quadrant. If the there are fewer than three noisy pixels in the level2.evt file, extra rows are filled as -1
| Pixel properties | Quadrant properties | ||||||
|---|---|---|---|---|---|---|---|
| Quadrant | DetID | PixID | Counts | Sigma | Mean | Median | Sigma |
| A | 15 | 169 | 1965890 | 16674.85 | 583 | 573 | 117.9 |
| A | 10 | 83 | 121418 | 1025.32 | 583 | 573 | 117.9 |
| A | 13 | 6 | 9917 | 79.28 | 583 | 573 | 117.9 |
| B | 5 | 172 | 1429524 | 13206.81 | 568 | 555 | 108.2 |
| B | 5 | 255 | 14534 | 129.2 | 568 | 555 | 108.2 |
| B | 12 | 111 | 13387 | 118.6 | 568 | 555 | 108.2 |
| C | 0 | 10 | 475702 | 3559.65 | 574 | 579 | 133.5 |
| C | 15 | 214 | 202425 | 1512.24 | 574 | 579 | 133.5 |
| C | 14 | 67 | 6746 | 46.2 | 574 | 579 | 133.5 |
| D | 7 | 80 | 75205 | 524.35 | 579 | 566 | 142.3 |
| D | 8 | 195 | 71981 | 501.7 | 579 | 566 | 142.3 |
| D | 2 | 249 | 65015 | 452.76 | 579 | 566 | 142.3 |
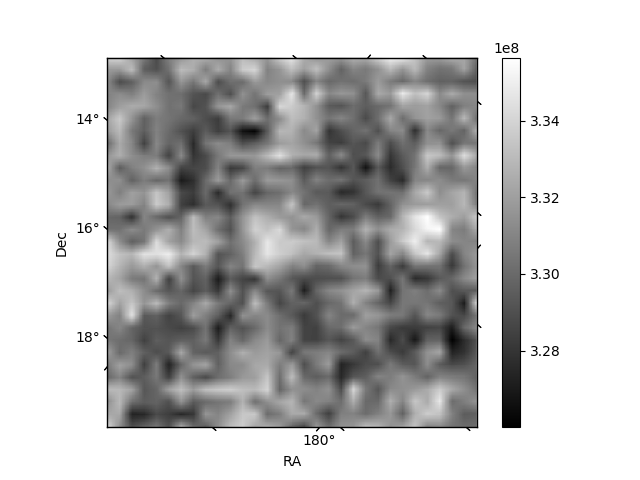
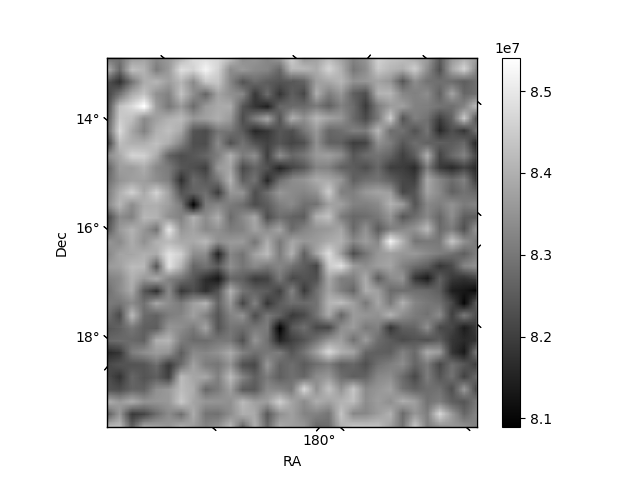
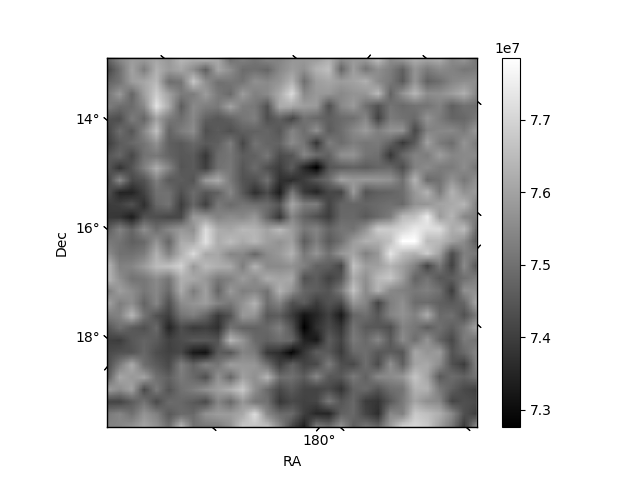
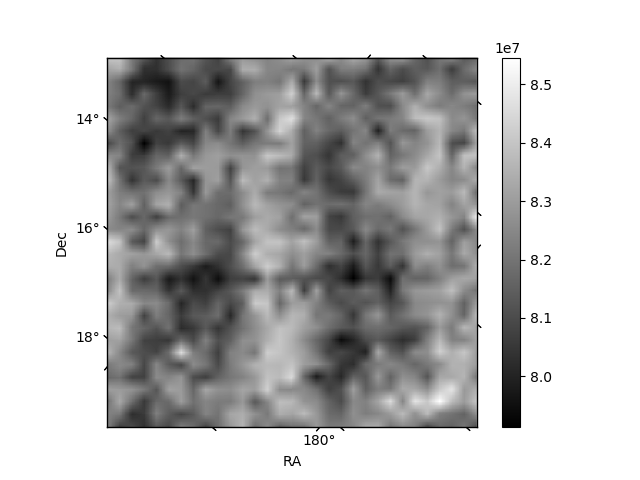
Histogram calculated using DETX and DETY for each event in the final _common_clean file
| Quadrant A | 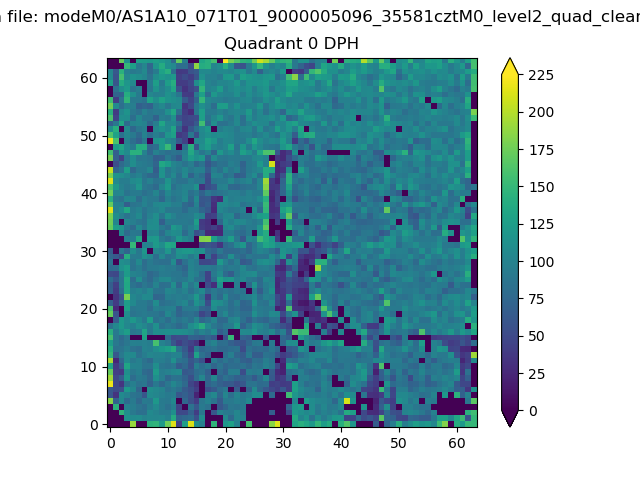 |
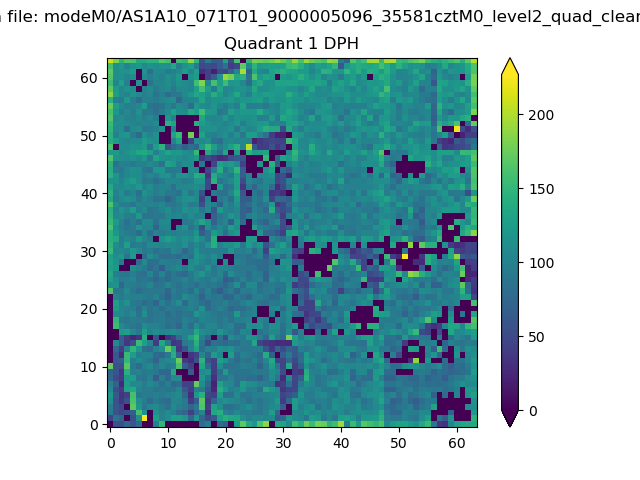 |
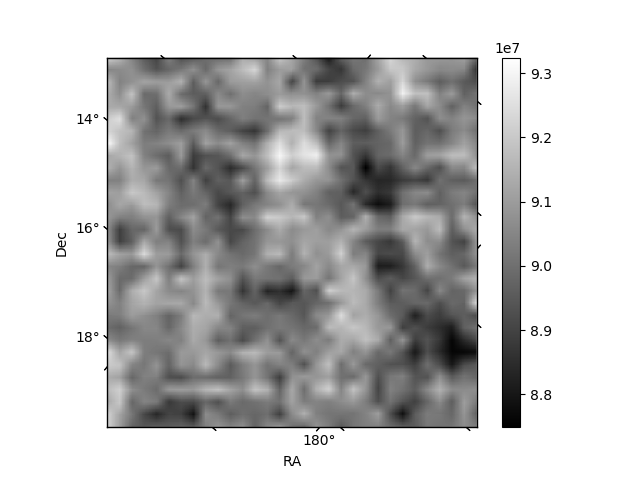
Quadrant B |
|---|---|---|---|
| Quadrant D | 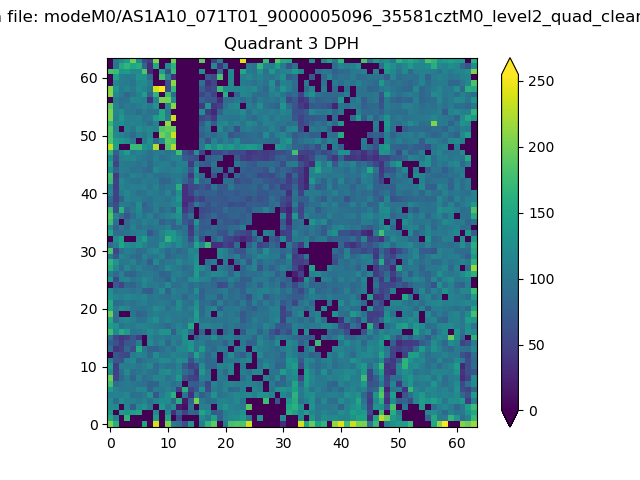 |
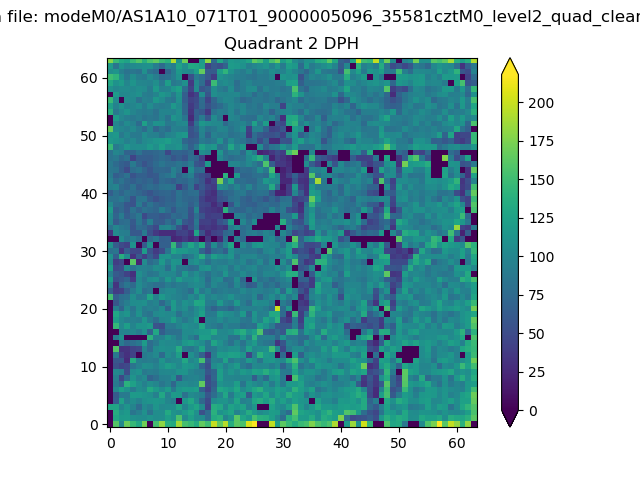 |
Quadrant C |
| Plot type | Count rate plots | Images |
|---|---|---|
| Comparison with Poisson distribution Blue bars denote a histogram of data divided into 1 sec bins. Red curve is a Poisson curve with rate = median count rate of data. |
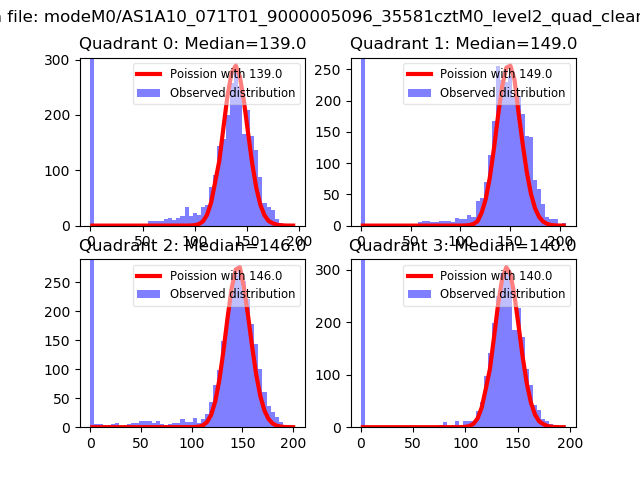 |
 |
| Quadrant-wise count rates Data is divided into 100 sec bins |
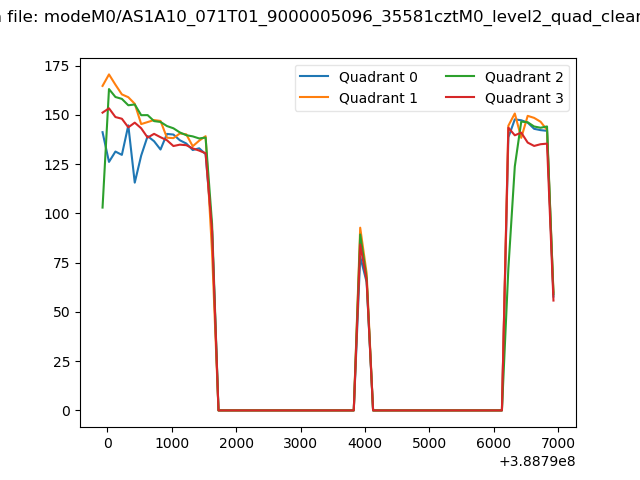 |
|
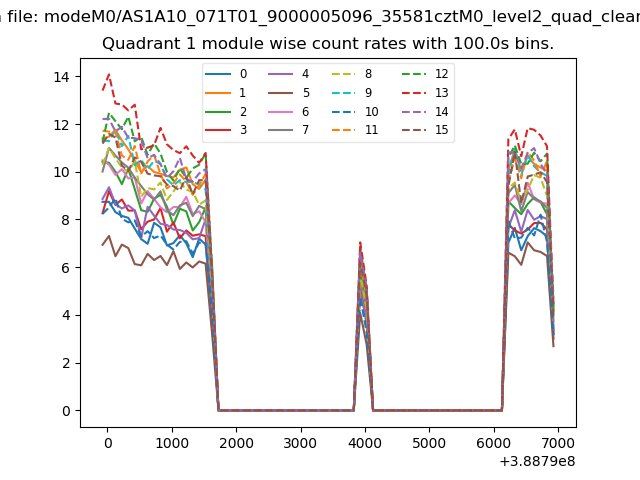
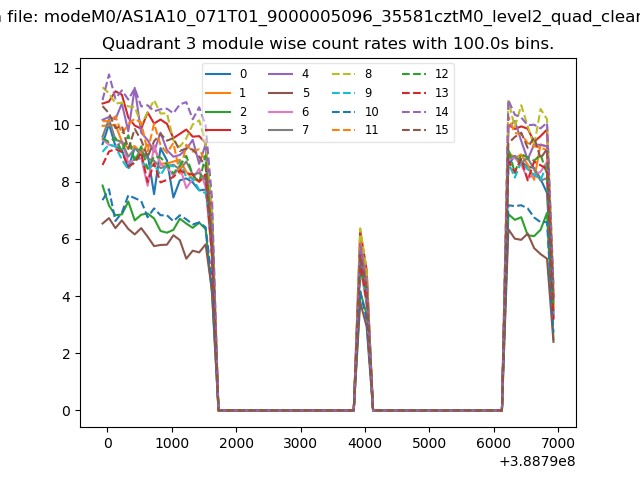
| Module-wise count rates for Quadrant A Data is divided into 100 sec bins |
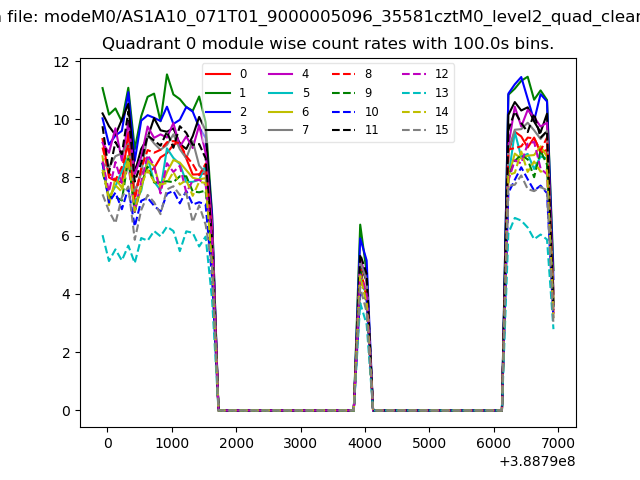 |
 |
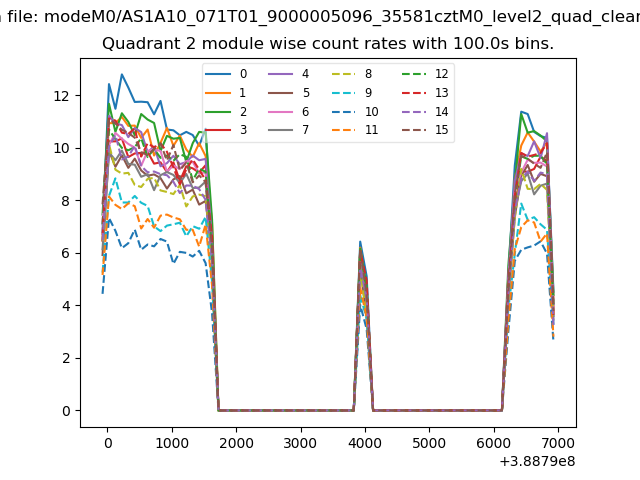
| Module-wise count rates for Quadrant B Data is divided into 100 sec bins |
 |
 |
| Module-wise count rates for Quadrant C Data is divided into 100 sec bins |
 |
 |
| Module-wise count rates for Quadrant D Data is divided into 100 sec bins |
 |
 |
| Parameter | Plot |
|---|---|
| CZT HV Monitor | 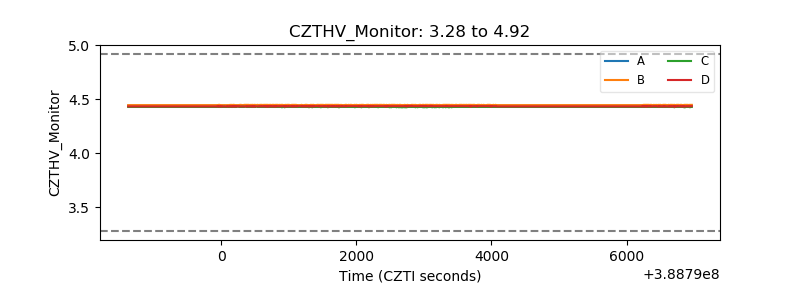 |
| D_VDD | 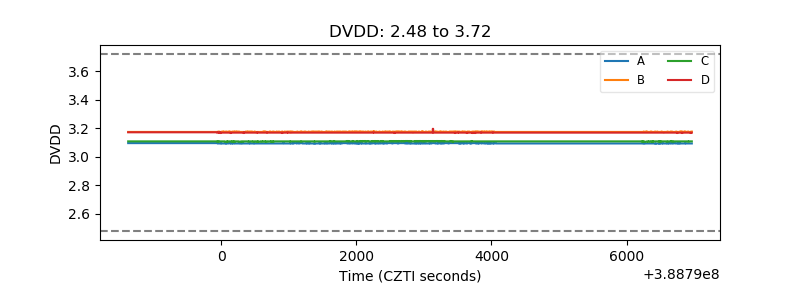 |
| Temperature 1 | 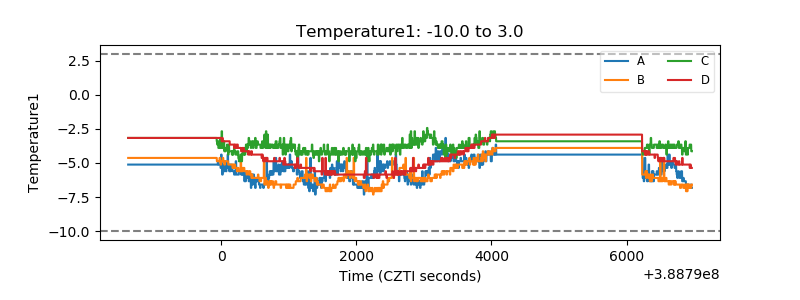 |
| Veto HV Monitor | 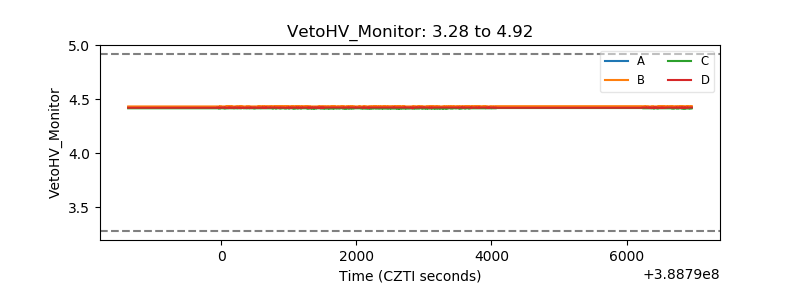 |
| Veto LLD | 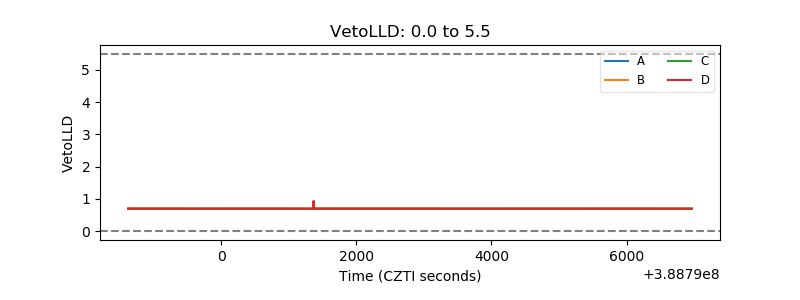 |
| Alpha Counter | 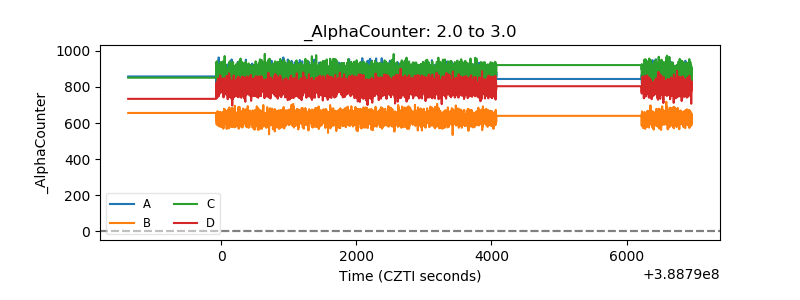 |
| _CPM_Rate | 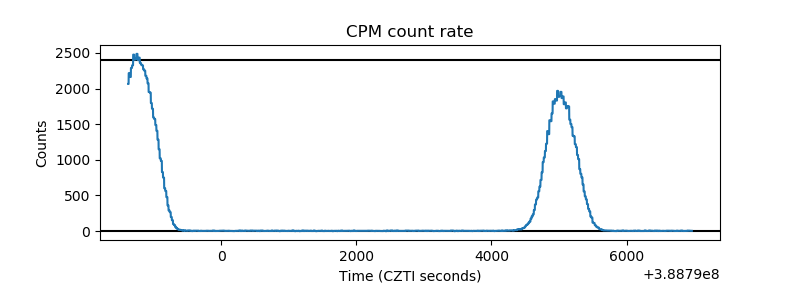 |
| CZT Counter | 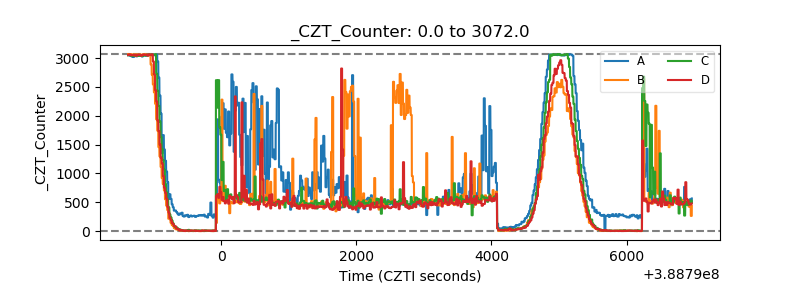 |
| +2.5 Volts monitor | 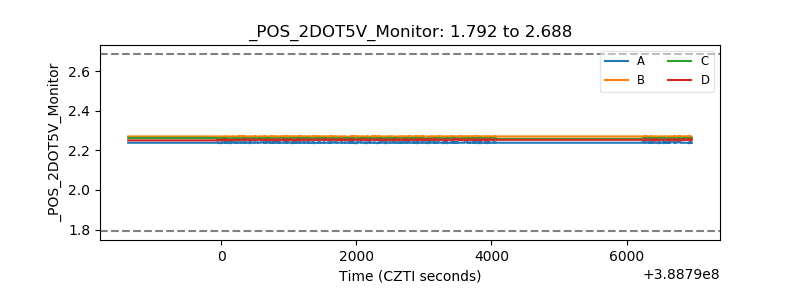 |
| +5 Volts monitor | 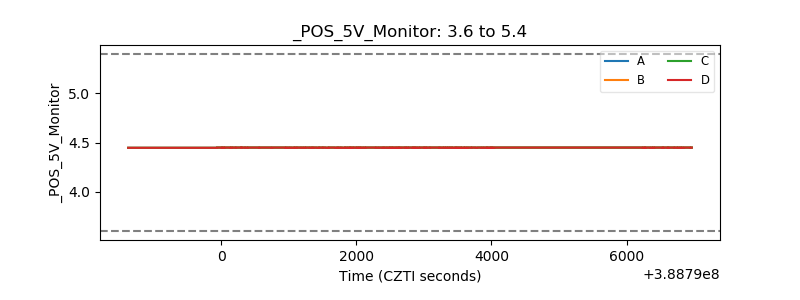 |
| _ROLL_ROT | 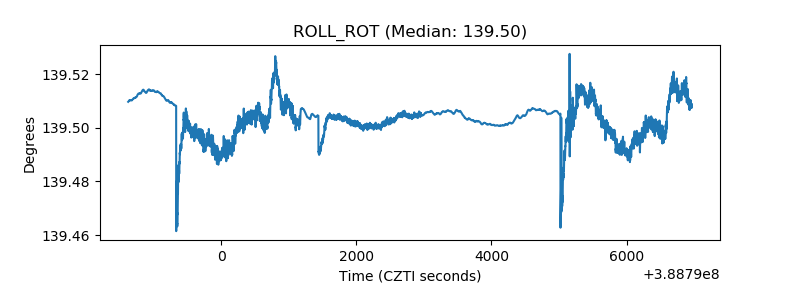 |
| _Roll_DEC | 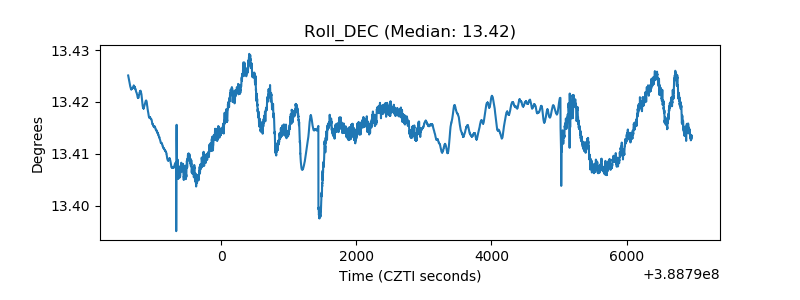 |
| _Roll_RA | 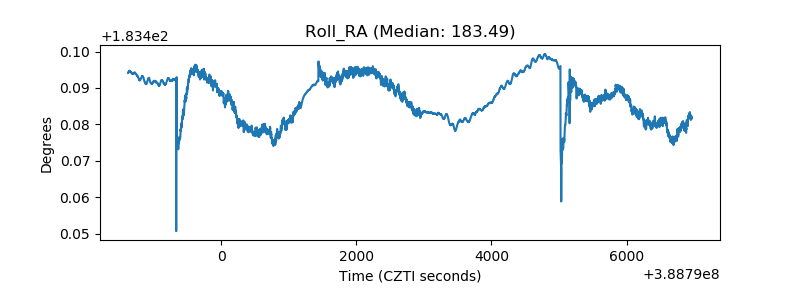 |
| Veto Counter | 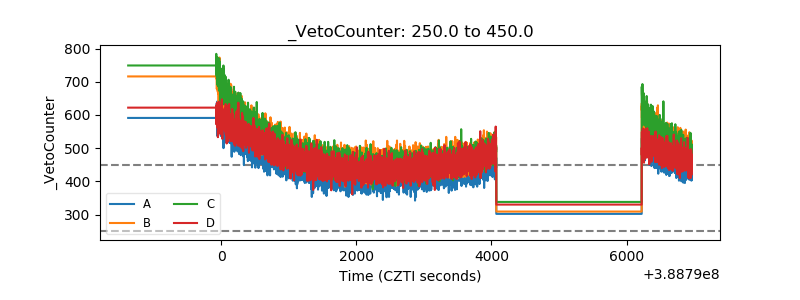 |