| Param | Original file | Final file |
|---|---|---|
| Filename | modeM0/AS1A10_071T01_9000005096_35580cztM0_level2.evt | modeM0/AS1A10_071T01_9000005096_35580cztM0_level2_quad_clean.evt |
| Size (bytes) | 433,883,520 | 70,646,400 |
| Size | 413.8 MB | 67.4 MB |
| Events in quadrant A | 3,998,340 | 437,996 |
| Events in quadrant B | 3,021,730 | 463,455 |
| Events in quadrant C | 2,953,980 | 449,071 |
| Events in quadrant D | 2,821,999 | 433,333 |
| Mode SS | |||
|---|---|---|---|
| Quadrant | BADHDUFLAG | Total packets | Discarded packets |
| A | 0 | 102 | 0 |
| B | 0 | 102 | 0 |
| C | 0 | 102 | 0 |
| D | 0 | 102 | 0 |
| Mode M9 | |||
|---|---|---|---|
| Quadrant | BADHDUFLAG | Total packets | Discarded packets |
| A | 0 | 31 | 0 |
| B | 0 | 31 | 0 |
| C | 0 | 31 | 0 |
| D | 0 | 32 | 0 |
| Mode M0 | |||
|---|---|---|---|
| Quadrant | BADHDUFLAG | Total packets | Discarded packets |
| A | 0 | 15135 | 3 |
| B | 0 | 12032 | 2 |
| C | 0 | 11633 | 2 |
| D | 0 | 11495 | 2 |
| Quadrant | Total seconds | Saturated seconds | Saturation percentage |
|---|---|---|---|
| A | 5071 | 390 | 7.690791% |
| B | 5071 | 136 | 2.681917% |
| C | 5071 | 132 | 2.603037% |
| D | 5071 | 44 | 0.867679% |
Noise dominated data is calculated using 1-second bins in cleaned event files. If a bin has >2000 counts, and if more than 50% of those come from <1% of pixels, then it is considered to be noise-dominated and hence unusable.
| Quadrant | # 1 sec bins | Bins with >0 counts | Bins with >2000 counts | High rate bins dominated by noise | Noise dominated (total time) | Noise dominated (detector-on time) | Marked lightcurve |
|---|---|---|---|---|---|---|---|
| A | 7134 | 5072 | 368 | 368 | 5.16% | 7.26% | 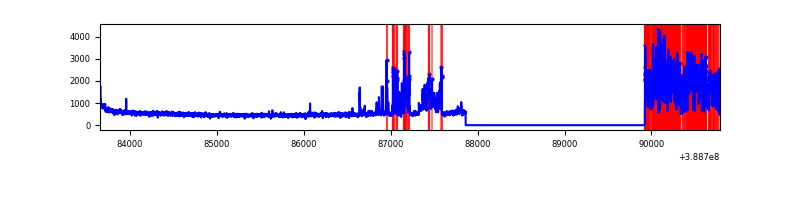 |
| B | 7134 | 5072 | 90 | 90 | 1.26% | 1.77% | 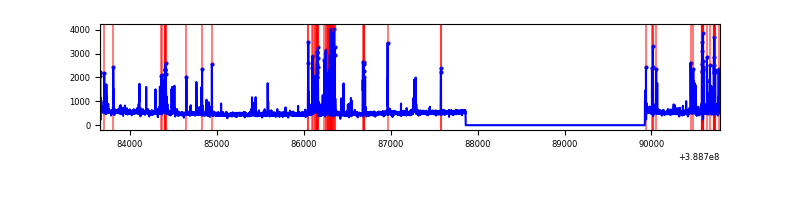 |
| C | 7134 | 5072 | 90 | 90 | 1.26% | 1.77% | 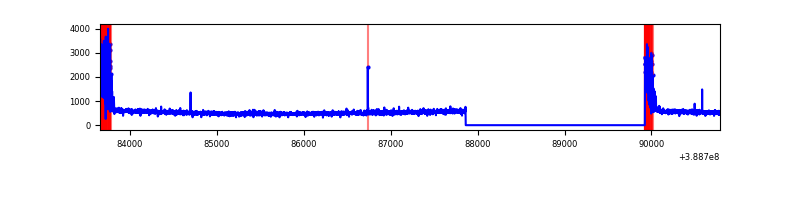 |
| D | 7134 | 5072 | 40 | 40 | 0.56% | 0.79% | 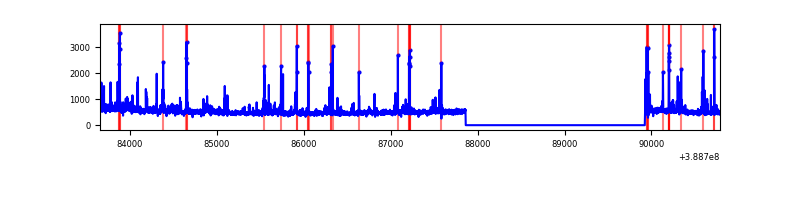 |
Top three noisy pixels from each quadrant. If the there are fewer than three noisy pixels in the level2.evt file, extra rows are filled as -1
| Pixel properties | Quadrant properties | ||||||
|---|---|---|---|---|---|---|---|
| Quadrant | DetID | PixID | Counts | Sigma | Mean | Median | Sigma |
| A | 15 | 169 | 1472943 | 11816.49 | 618 | 608 | 124.6 |
| A | 10 | 83 | 126833 | 1013.04 | 618 | 608 | 124.6 |
| A | 13 | 6 | 13201 | 101.07 | 618 | 608 | 124.6 |
| B | 5 | 172 | 529255 | 4443.72 | 623 | 609 | 119.0 |
| B | 0 | 189 | 27781 | 228.4 | 623 | 609 | 119.0 |
| B | 12 | 111 | 14478 | 116.58 | 623 | 609 | 119.0 |
| C | 0 | 10 | 351055 | 2486.65 | 609 | 615 | 140.9 |
| C | 15 | 214 | 212553 | 1503.87 | 609 | 615 | 140.9 |
| C | 14 | 67 | 8137 | 53.37 | 609 | 615 | 140.9 |
| D | 7 | 80 | 118287 | 794.76 | 610 | 595 | 148.1 |
| D | 2 | 153 | 92479 | 620.48 | 610 | 595 | 148.1 |
| D | 8 | 195 | 79330 | 531.69 | 610 | 595 | 148.1 |
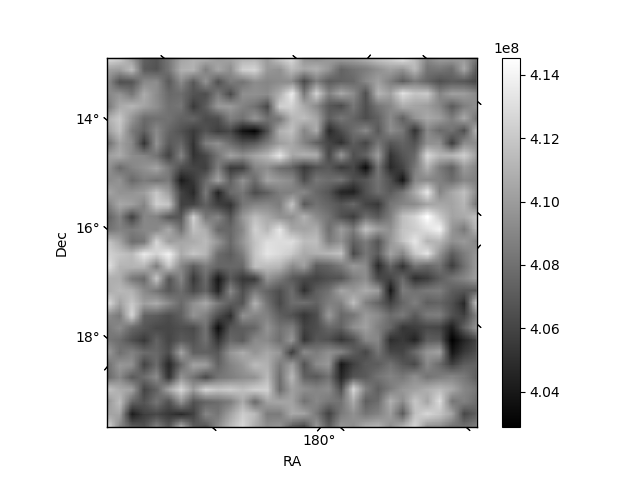
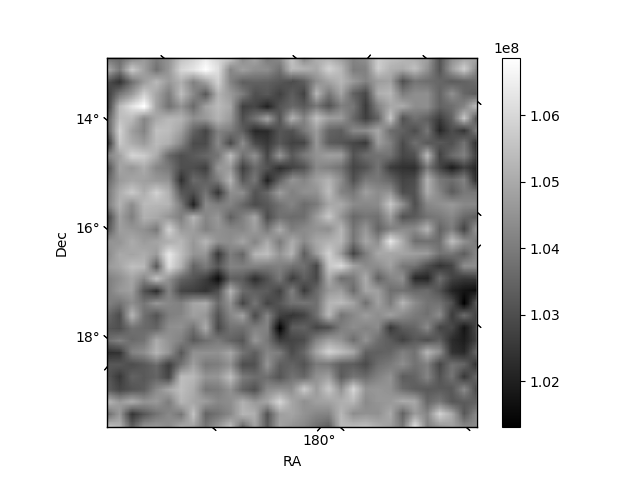
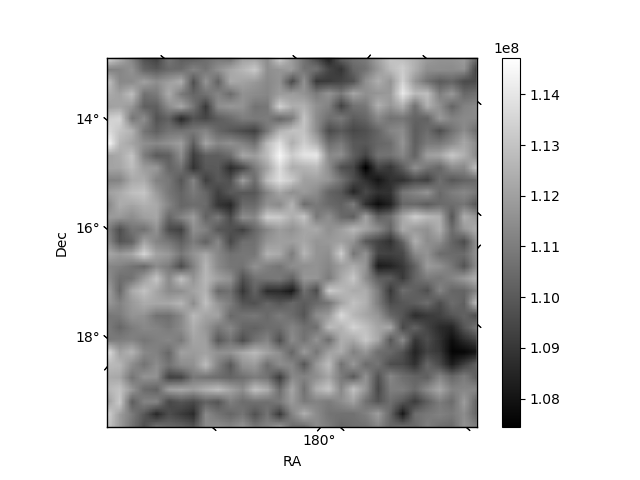
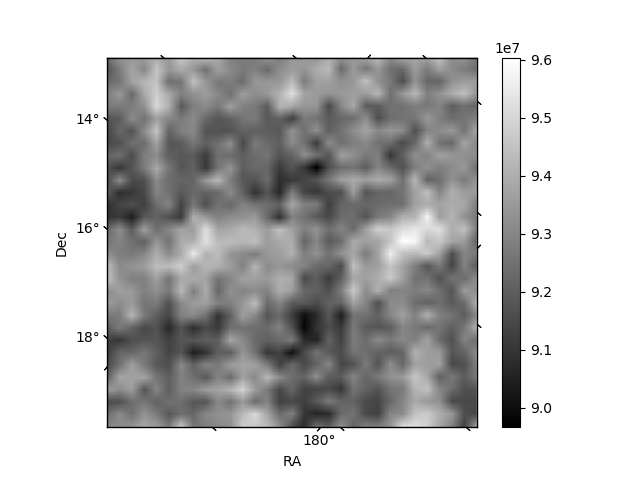
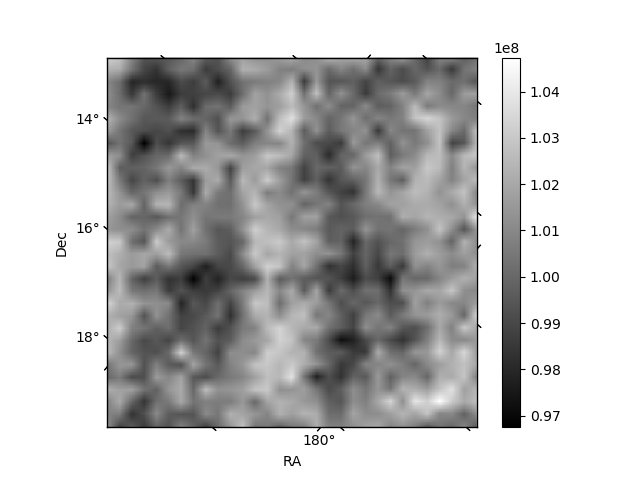
Histogram calculated using DETX and DETY for each event in the final _common_clean file
| Quadrant A | 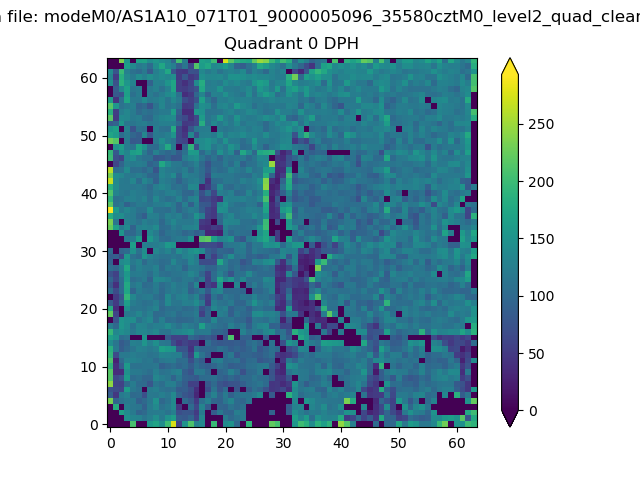 |
 |
Quadrant B |
|---|---|---|---|
| Quadrant D | 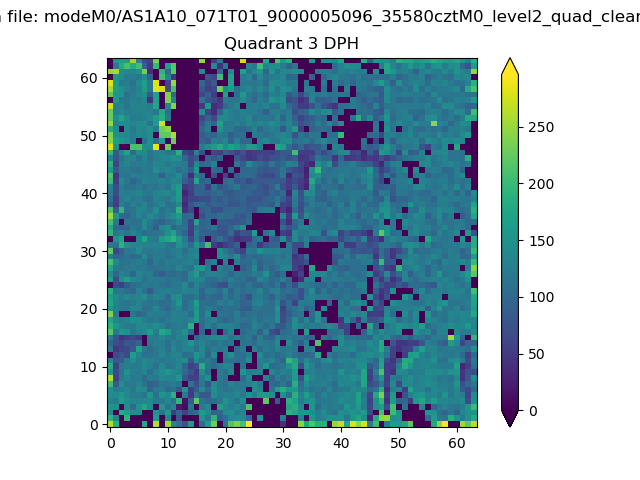 |
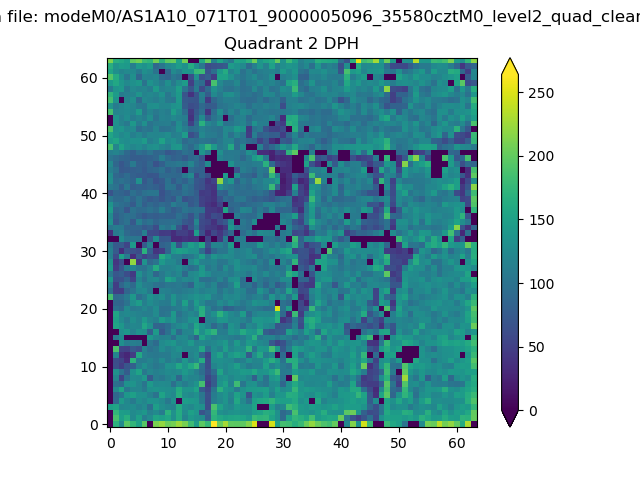 |
Quadrant C |
| Plot type | Count rate plots | Images |
|---|---|---|
| Comparison with Poisson distribution Blue bars denote a histogram of data divided into 1 sec bins. Red curve is a Poisson curve with rate = median count rate of data. |
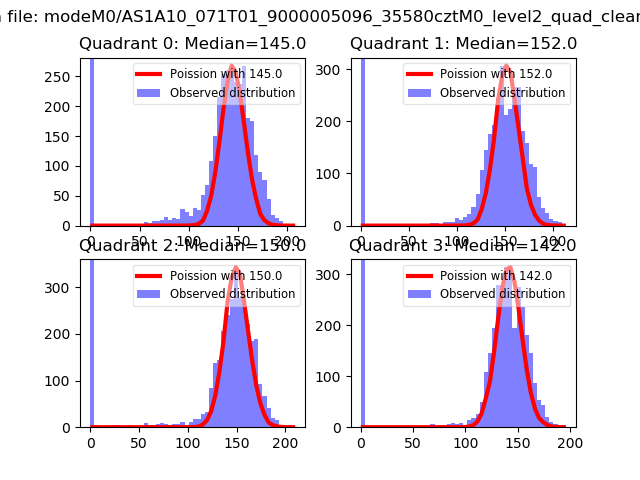 |
 |
| Quadrant-wise count rates Data is divided into 100 sec bins |
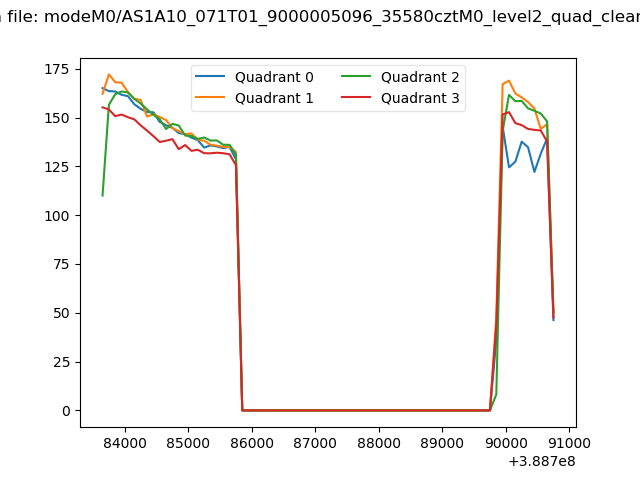 |
|
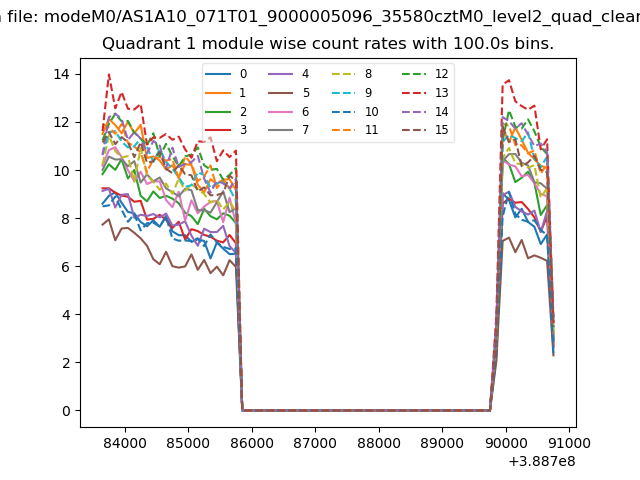
| Module-wise count rates for Quadrant A Data is divided into 100 sec bins |
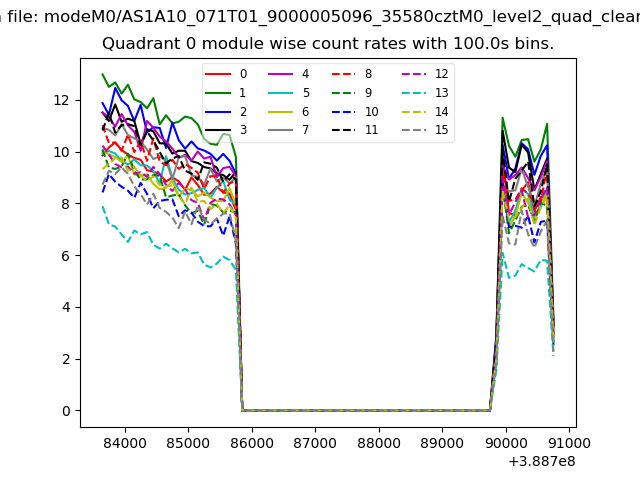 |
 |
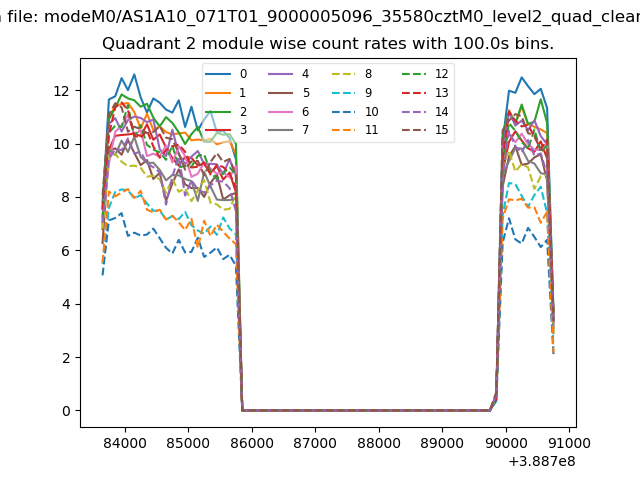
| Module-wise count rates for Quadrant B Data is divided into 100 sec bins |
 |
 |
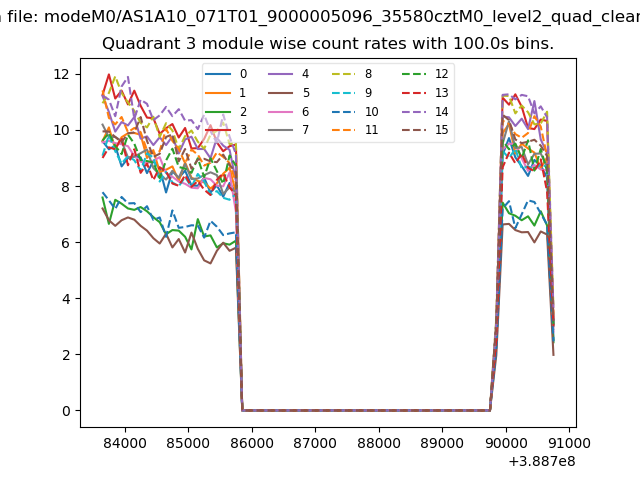
| Module-wise count rates for Quadrant C Data is divided into 100 sec bins |
 |
 |
| Module-wise count rates for Quadrant D Data is divided into 100 sec bins |
 |
 |
| Parameter | Plot |
|---|---|
| CZT HV Monitor | 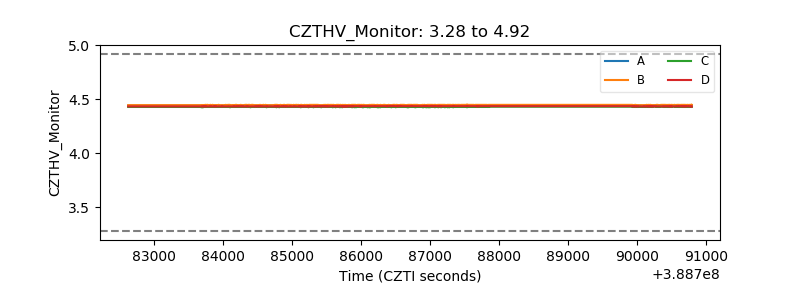 |
| D_VDD | 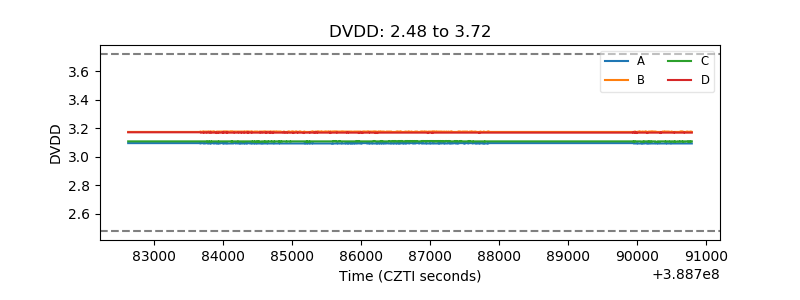 |
| Temperature 1 | 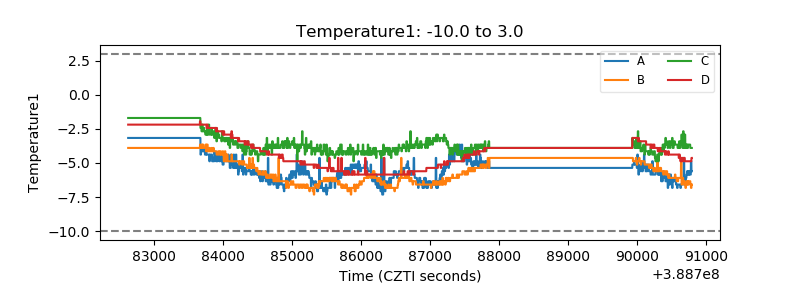 |
| Veto HV Monitor | 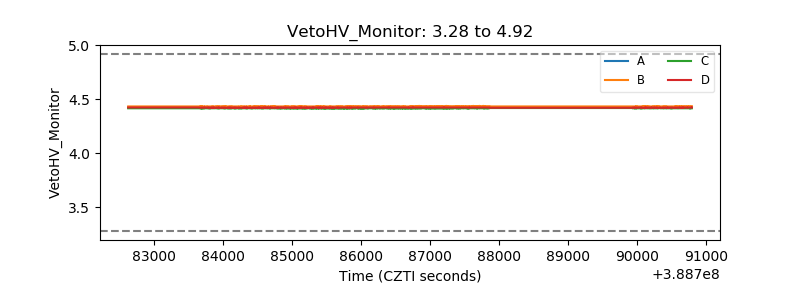 |
| Veto LLD | 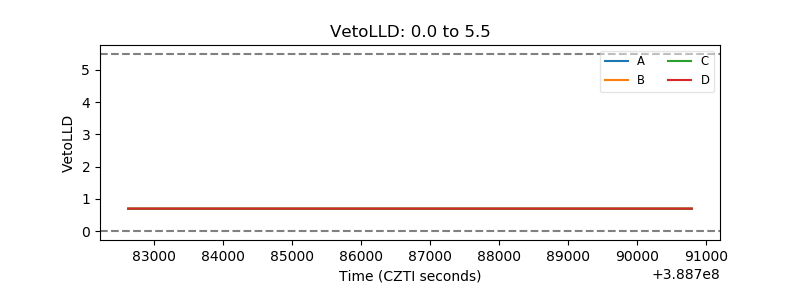 |
| Alpha Counter | 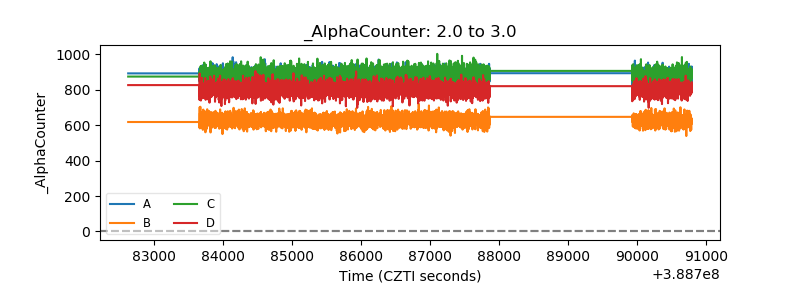 |
| _CPM_Rate | 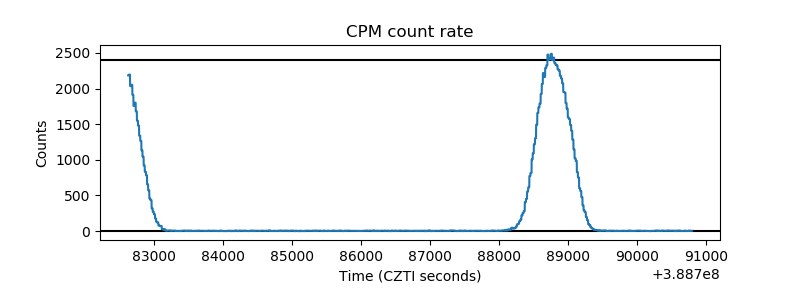 |
| CZT Counter | 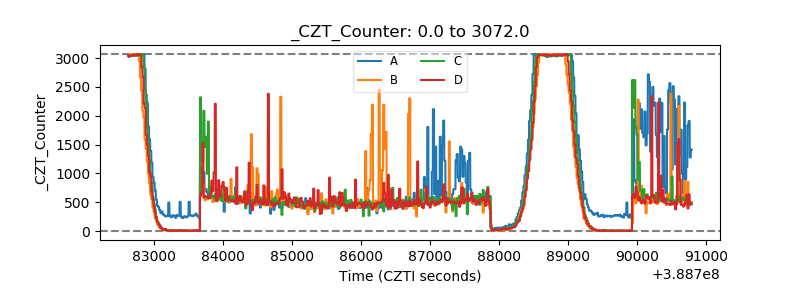 |
| +2.5 Volts monitor | 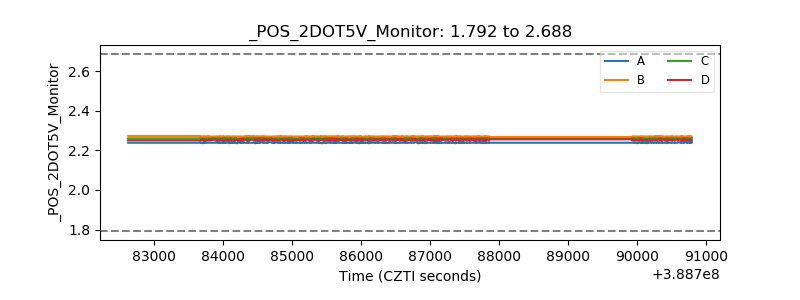 |
| +5 Volts monitor | 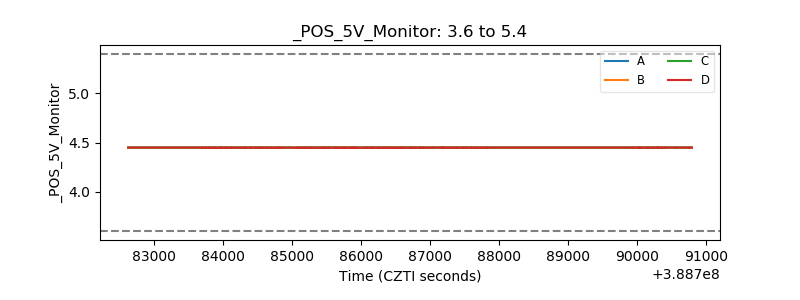 |
| _ROLL_ROT | 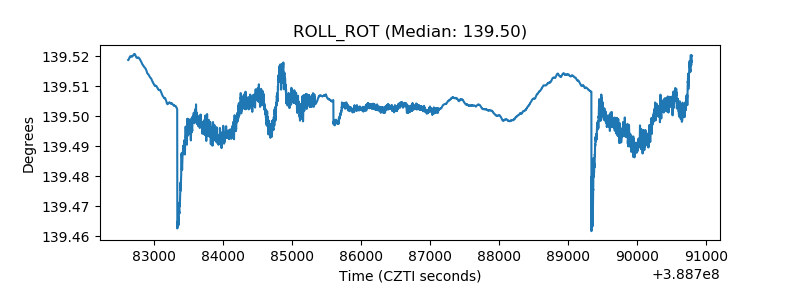 |
| _Roll_DEC | 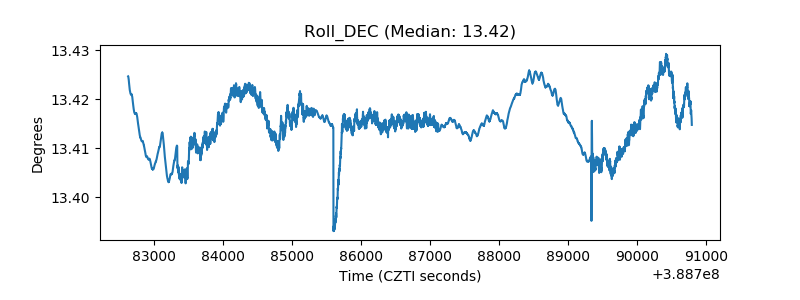 |
| _Roll_RA | 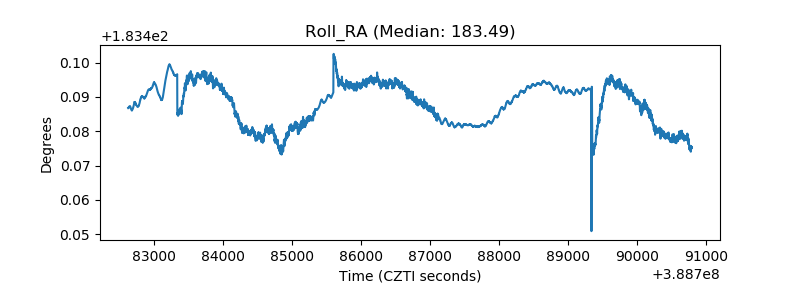 |
| Veto Counter | 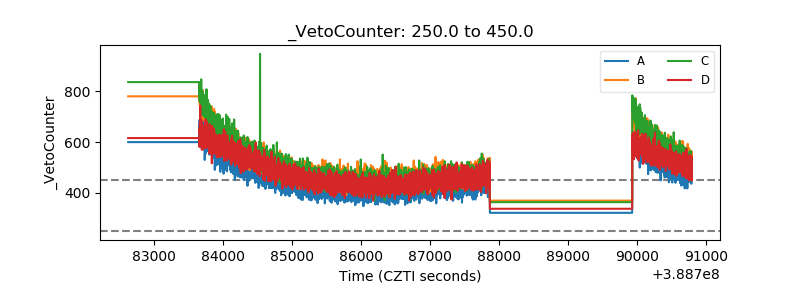 |